
A sharp downwards movement today remained above the invalidation point on the main hourly Elliott wave count, and the long lower wick on this candlestick is interpreted as bullish.
Although bears were able to push price sharply lower, they could not hold the lows and they could not make a new swing low below the low of the 2nd of November.
Summary: The Elliott wave target is at 2,616 and a target from a small pennant pattern is 2,617. The upwards trend has support from very bullish On Balance Volume.
Assume the trend remains the same until proven otherwise. The trend is up.
For the alternate hourly wave count to become the main hourly wave count, price needs to make a new low below 2,566.17 and / or On Balance Volume needs to give a bearish signal. If either of these things happen, then the target for a multi day pullback would now be about 2,539.
Pullbacks and consolidations at their conclusions offer opportunities to join the upwards trend.
Always trade with stops and invest only 1-5% of equity on any one trade.
Last monthly and weekly charts are here. Last historic analysis video is here.
MAIN ELLIOTT WAVE COUNT
WEEKLY CHART
Click chart to enlarge.
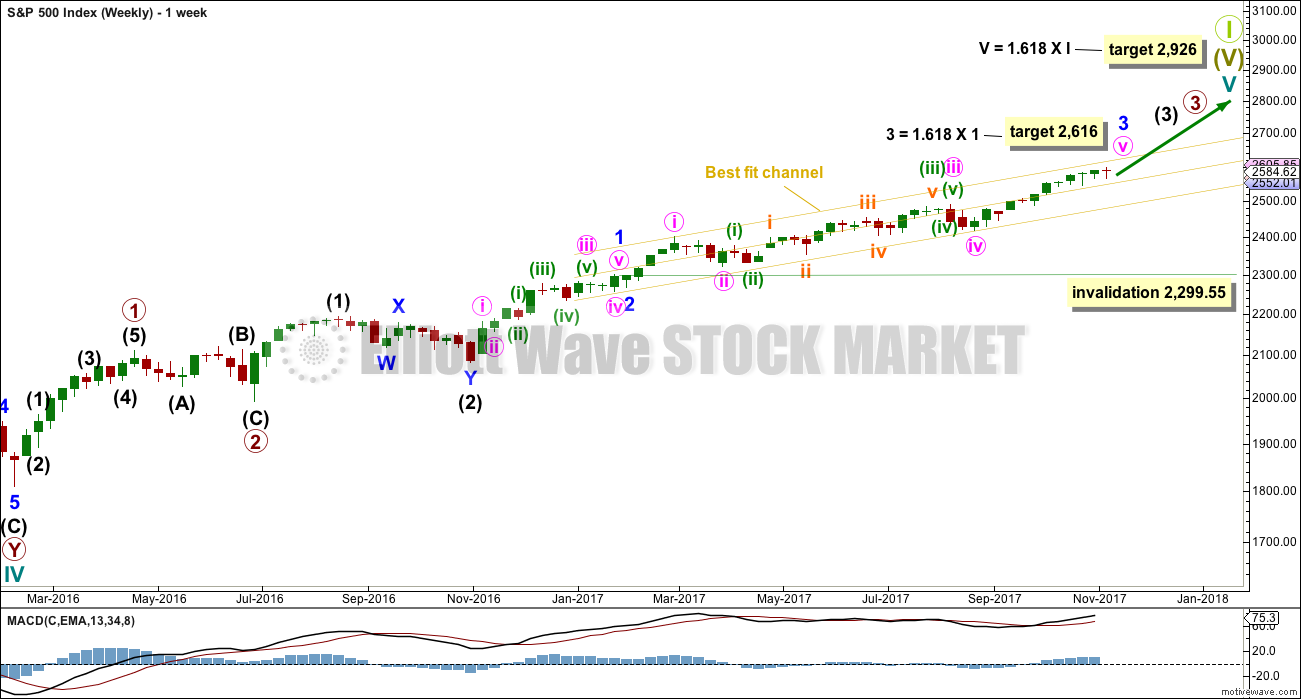
This wave count has strong support from very bullish On Balance Volume at the weekly chart level. While classic analysis is still very bullish for the short term, there will be corrections along the way up. Indicators are extreme and there is considerable risk to the downside still.
As a Grand Super Cycle wave comes to an end, weakness may develop and persist for very long periods of time (up to three years is warned as possible by Lowry’s for the end of a bull market), so weakness in volume may be viewed in that larger context.
When minor wave 3 is complete, then minor wave 4 should find support about the lower edge of the best fit channel. Minor wave 4 may not move into minor wave 1 price territory below 2,299.55.
The next reasonable correction should be for intermediate wave (4). When it arrives, it should last over two months in duration. The correction may be relatively shallow, a choppy overlapping consolidation, at the weekly chart level.
DAILY CHART
Click chart to enlarge.
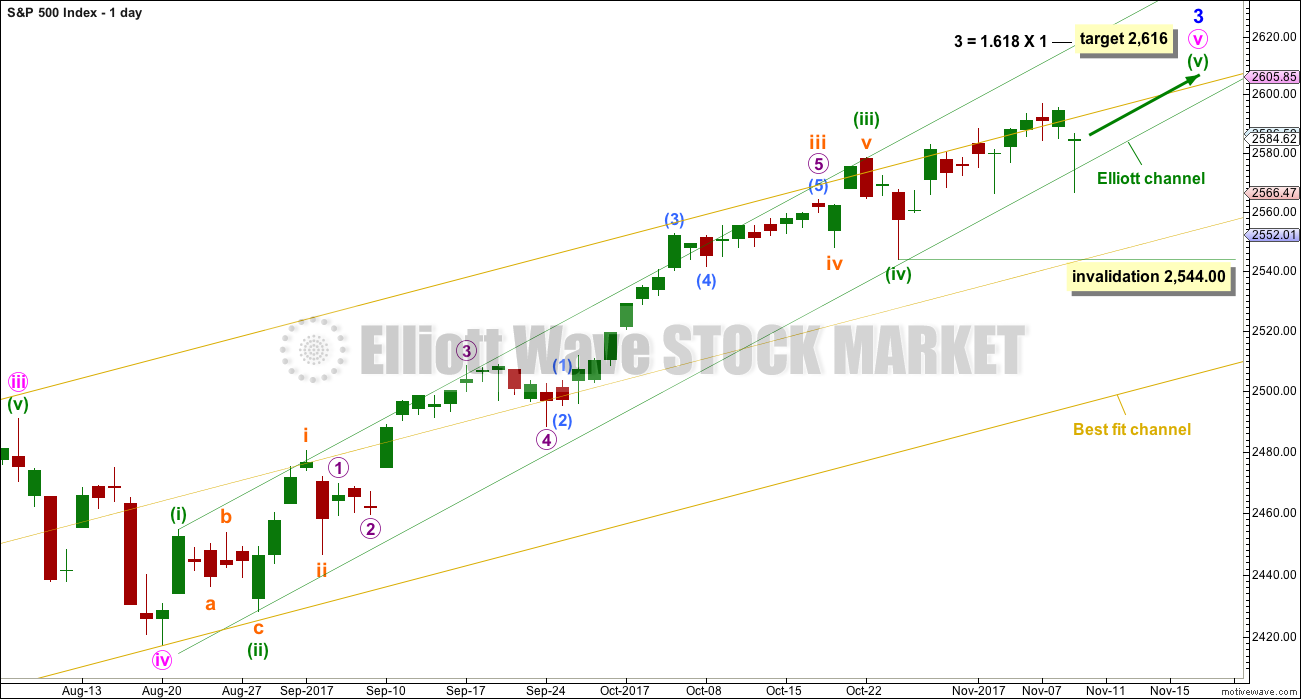
Minute wave v is completing as an impulse. The final fifth wave of minuette wave (v) is underway.
The target for minor wave 3 expects to see the most common Fibonacci ratio to minor wave 1.
Within minuette wave (v), no second wave correction may move beyond the start of the first wave below 2,544.00.
The green Elliott channel is drawn about minute wave v using Elliott’s first technique. It almost perfectly showed where minuette wave (iv) found support. The lower edge of this channel is overshot today, so this may be a warning that the alternate hourly wave count may be correct.
However, the S&P does have a tendency to form slow curving rounded tops. When it does that, it will breach channels only to continue on to new highs before finally turning.
HOURLY CHART
Click chart to enlarge.
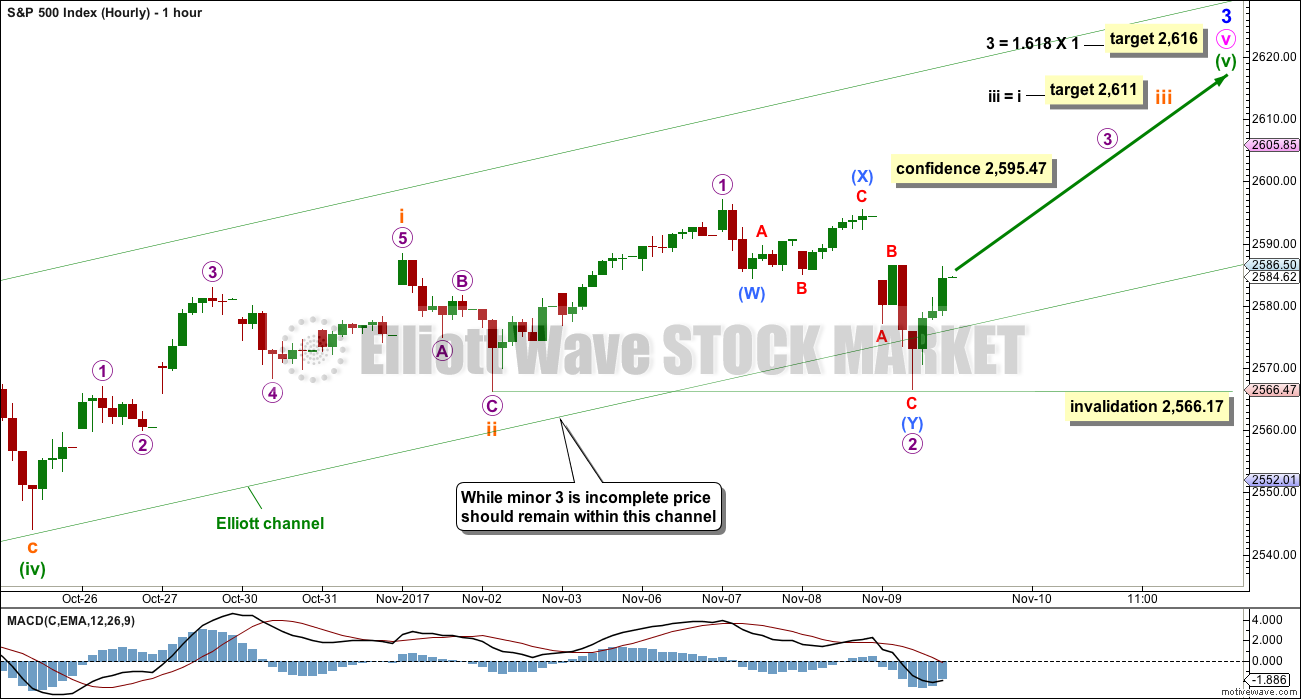
Assume the trend remains the same until proven otherwise. Assume the trend remains up while price remains within the green channel and above 2,566.17. Although price moved below the green channel during this session, it did not manage to print a full candlestick below the channel and it quickly returned back into the channel. The channel is overshot but not properly breached. A clear breach is at least one candlestick below and not touching the lower edge of the channel, preferably by clearly downwards movement and not just sideways movement.
Minuette wave (v) must subdivide as a five wave structure. It may be an impulse with subminuette waves i and ii complete.
This wave count expects to see a further increase in upwards momentum as a small third wave up unfolds.
Within the impulse of subminuette wave iii, micro wave 1 may now be complete. Micro wave 2 may be complete. It may not move beyond the start of micro wave 1 below 2,566.17.
During today’s session micro wave 2 broke below a base channel, which was on yesterday’s hourly chart. That base channel is not working as base channels most often do, so it is removed. The green Elliott channel should suffice now.
Micro wave 2 is now very deep indeed, and is longer in duration than subminuette wave ii one degree higher. This does not have quite the right look, but the S&P does not always exhibit good proportions. This wave count is acceptable still for this market.
I have tried to see if subminuette wave i could have been over at the high labelled micro wave 1, but it will not fit and meet all Elliott wave rules.
A breach of the green channel by downwards movement would be the earliest indication that this first wave count may not be correct. If that happens, then seriously consider the alternate hourly wave count below.
ALTERNATE HOURLY CHART
Click chart to enlarge.
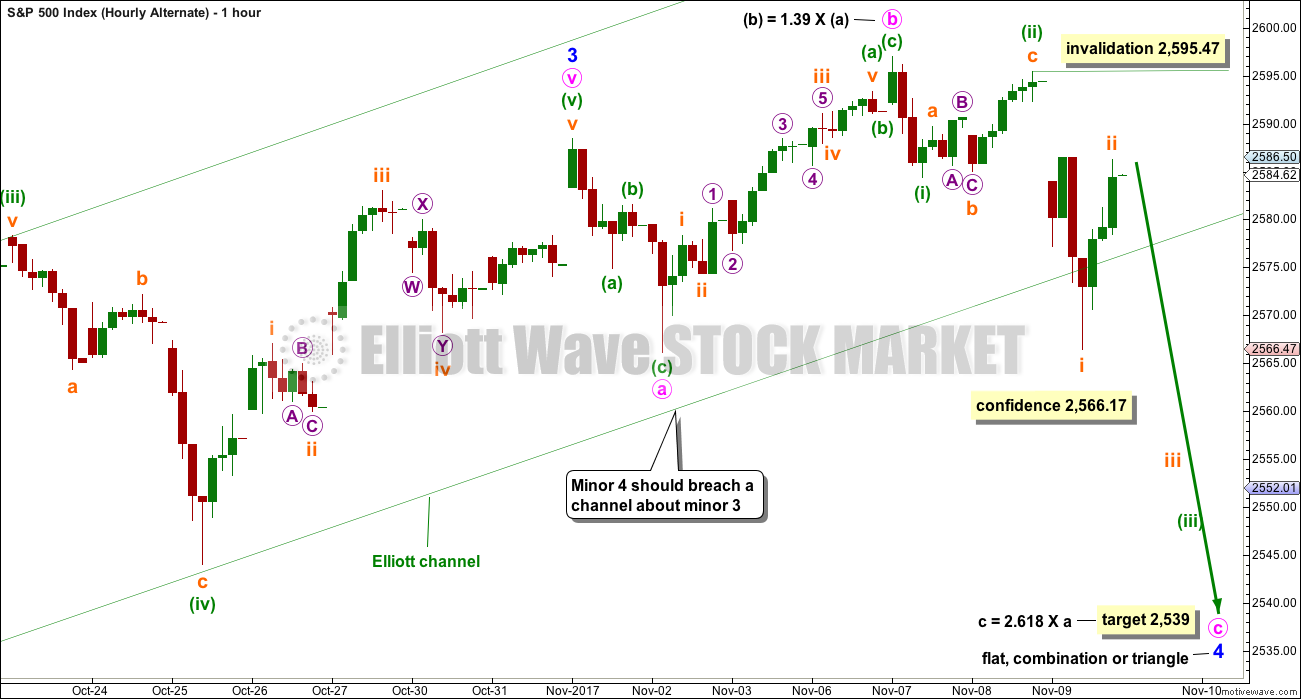
If price makes a new low below 2,566.17, then we may have some confidence in this alternate wave count. A bearish signal from On Balance Volume would be given enough weight in this analysis to switch this alternate over to a main wave count.
This alternate simply moves the degree of labelling within the last five up all up one degree. It is possible again that minor wave 3 could be over.
Minor wave 2 was a quick shallow 0.16 zigzag lasting just three days. Minor wave 4 should also show up at the daily chart level. It may be a sideways consolidation, subdividing as a flat, combination or triangle, to exhibit alternation with the zigzag of minor wave 2. These structures are often more time consuming than zigzags. So far minor wave 4 may have lasted nine days and the structure would be incomplete. It may end in a total Fibonacci thirteen days.
A new correction at minor degree should begin with a five down at the hourly chart level. This has not happened, a three down only is complete. The probability of this wave count is reduced.
Minor wave 4 may be closer to completion. It may still be a flat, combination or triangle although it is labelled here as the most common of these structures, an expanded flat.
The target for minute wave c to end is today recalculated. If minute wave c has now begun with two overlapping first and second waves, then it needs a reasonable amount of space below to complete a five wave structure.
It is also possible that minor wave 4 may be a triangle or combination. If price moves slowly sideways in a choppy consolidation, rather than sharply lower, then this wave count may be relabelled.
Although this alternate has been considered to be an unlikely scenario up until today, there was support today from volume for downwards movement and there is short / mid term divergence between price and the AD line to support this wave count.
TECHNICAL ANALYSIS
WEEKLY CHART
Click chart to enlarge. Chart courtesy of StockCharts.com.
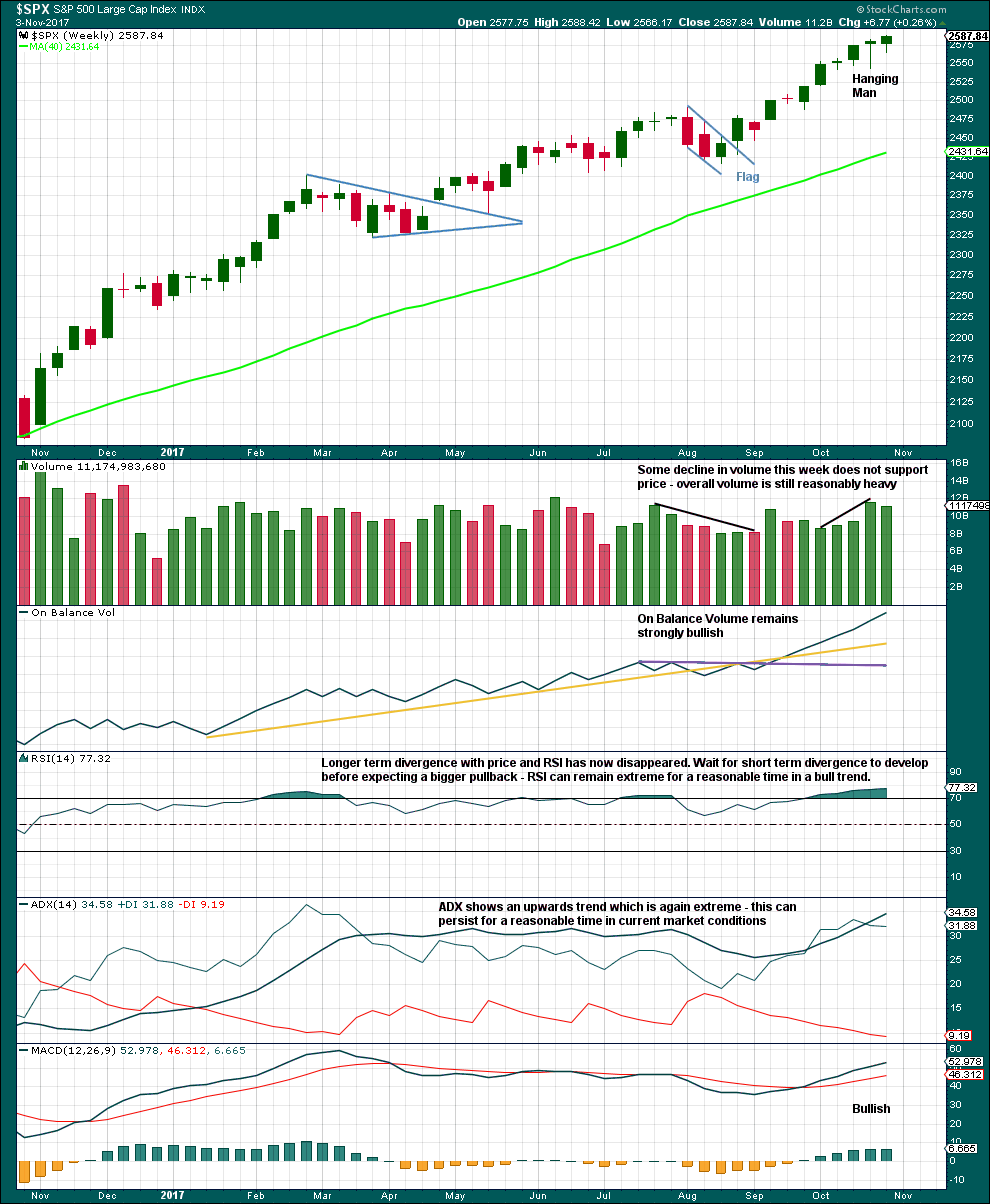
The Hanging Man candlestick requires bearish confirmation because the long lower wick has a strong bullish implication. Last week has not given bearish confirmation, so the Hanging Man candlestick should not be read as a reversal signal.
Indicators are now extreme, but at this stage there is not enough weakness in price to indicate an end to the upward trend here. Extreme conditions for ADX and RSI may persist for several weeks while price continues higher.
DAILY CHART
Click chart to enlarge. Chart courtesy of StockCharts.com.
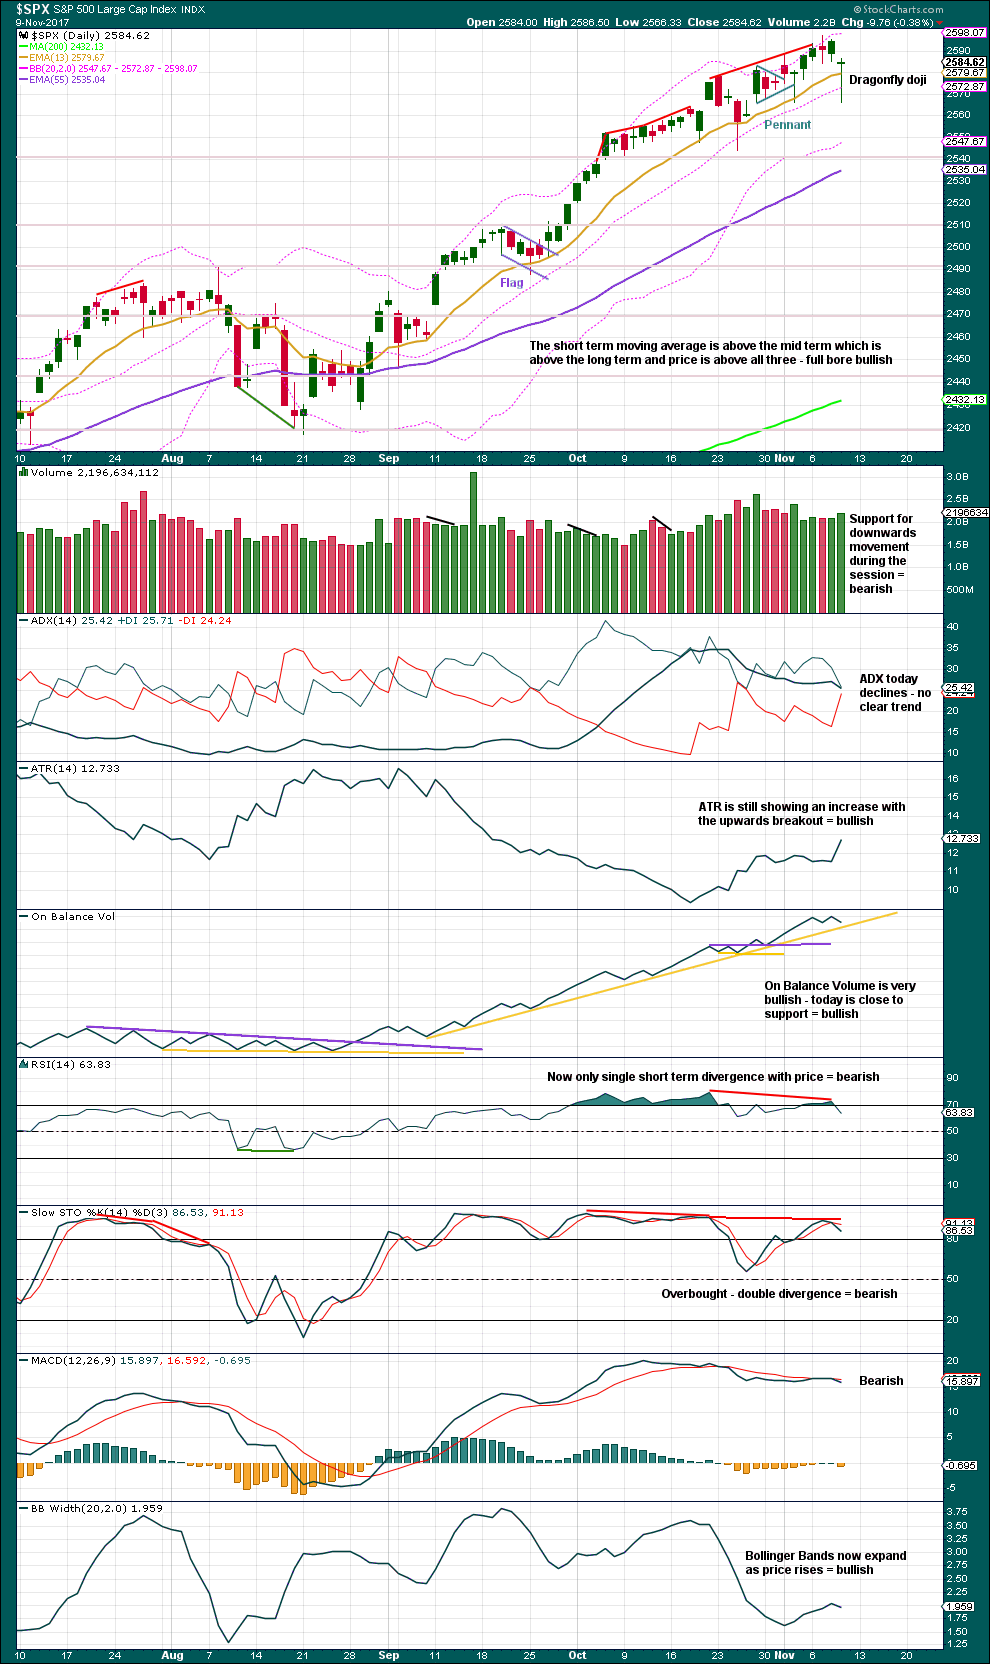
Pennants are one of the most reliable continuation patterns. The measured rule calculates a target about 2,617. Because this is only one point off the Elliott wave target, this area may offer strong resistance.
The trend is clearly up. Go with the trend. But risk management is essential, as always: with RSI and Stochastics both extreme, there is risk here of a pullback to resolve these conditions.
Bullish: The long lower wick on today’s candlestick, ATR, Bollinger Bands, and On Balance Volume.
Bearish: Price today, volume today, RSI and Stochastics.
There is now enough warning signs to keep the alternate in mind as a serious possibility.
A Dragonfly doji can be a top reversal pattern. However, the long lower wick of the Dragonfly has strong bullish connotations, so this candlestick pattern requires bearish confirmation in the following candlestick. This essentially makes it a two candlestick pattern. If tomorrow prints a red candlestick, that would be taken as confirmation of a high and would favour the alternate hourly wave count. If tomorrow prints a green candlestick, that would favour the main hourly wave count.
VOLATILITY – INVERTED VIX CHART
Click chart to enlarge. Chart courtesy of StockCharts.com.
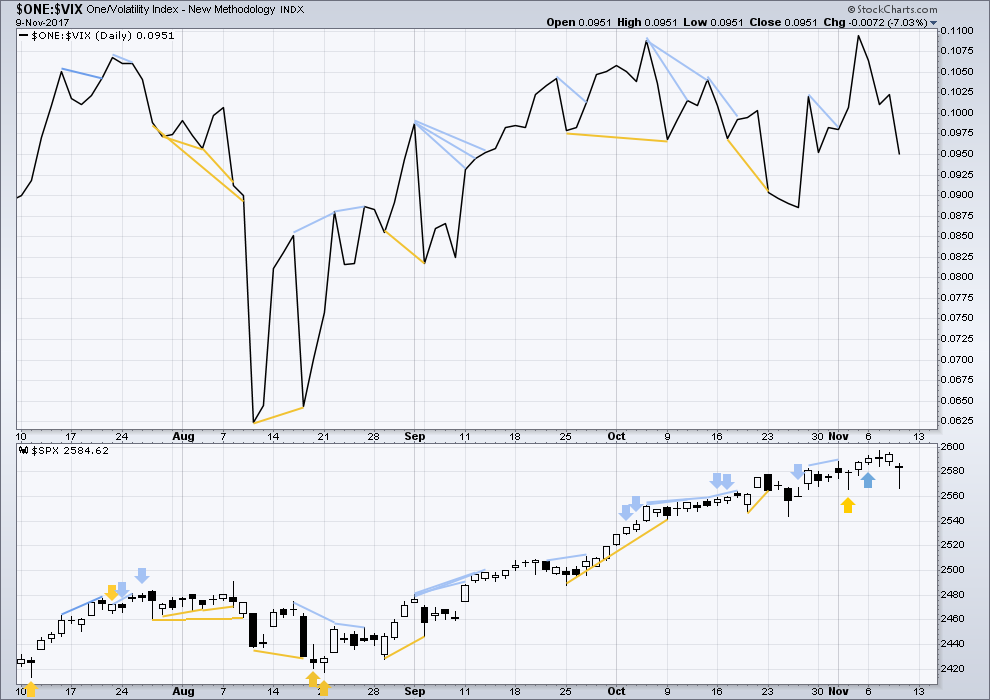
Normally, volatility should decline as price moves higher and increase as price moves lower. This means that normally inverted VIX should move in the same direction as price.
There is no new divergence today between price and inverted VIX. The fall in price today had a normal corresponding increase in market volatility.
BREADTH – AD LINE
Click chart to enlarge. Chart courtesy of StockCharts.com.
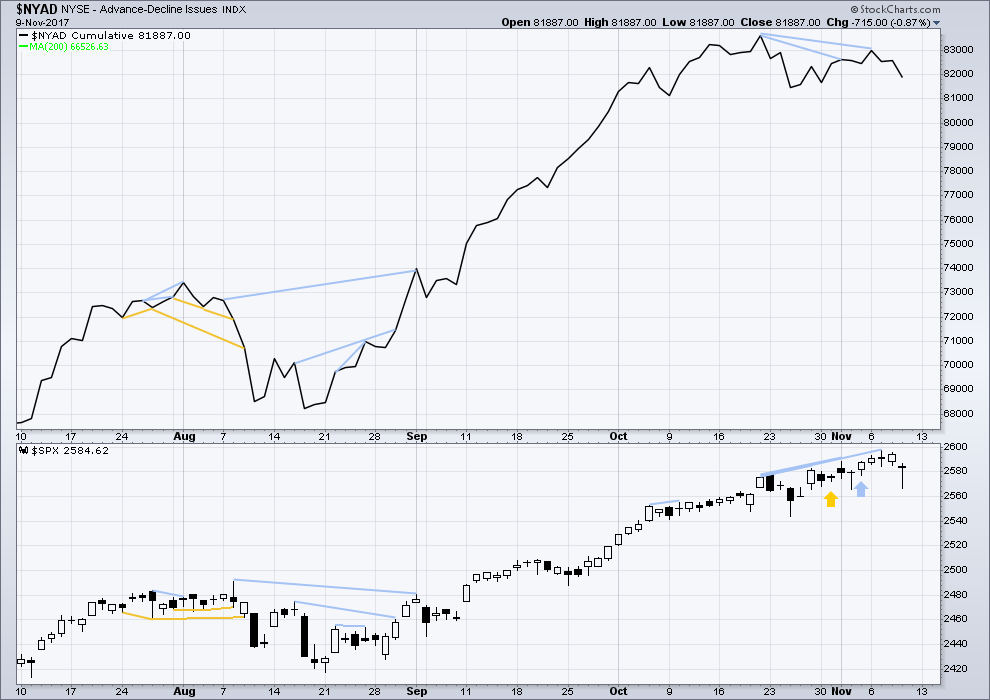
There is normally 4-6 months divergence between price and market breadth prior to a full fledged bear market. This has been so for all major bear markets within the last 90 odd years. With no longer term divergence yet at this point, any decline in price should be expected to be a pullback within an ongoing bull market and not necessarily the start of a bear market.
There is still some mid term divergence back to the 20th of October. As minor wave 3 comes to an end, this should be expected.
Short / mid term divergence with breadth and price will be noted today. This is bearish, and it may be indicating the end of minor wave 3 (main hourly Elliott wave count) to come in a few days, or it may be indicating the alternate hourly Elliott wave count is correct and price is ready to move strongly lower for a few days right here.
Price has moved lower and the AD line has moved lower today. The fall in price has support from a decline in market breadth. This is bearish.
Small caps have moved lower during last week failing to make new all time highs. Mid caps made their last all time high on Wednesday and have failed to make a new all time high for Friday. There is some very short term weakness within this market developing.
DOW THEORY
At the end of last week, only DJT failed to make a new all time high. The S&P500, DJIA and Nasdaq have made new all time highs. DJT has failed so far to confirm an ongoing bull market.
Failure to confirm an ongoing bull market should absolutely not be read as the end of a bull market. For that, Dow Theory would have to confirm new lows.
The following lows need to be exceeded for Dow Theory to confirm the end of the bull market and a change to a bear market:
DJIA: 17,883.56.
DJT: 7,029.41.
S&P500: 2,083.79.
Nasdaq: 5,034.41.
Charts showing each prior major swing low used for Dow Theory are here.
Published @ 06:06 p.m. EST.
Main hourly updated:
No change either really here. Should be ready for a strong thrust upwards if this is the correct count.
Let’s see what On Balance Volume has to say at the close of the session…
Alternate hourly update:
No change really. I notice that micro A has a count of 13 on the 5 minute chart… that’s impulsive. And so that’s the reason for labelling subminuette ii as incomplete.
Thanks Lara!
The second waves do seem to be taking their own sweet time. Glad I rolled my DIA puts earlier. Have a great week-end everybody.
Hopefully we get this minor four completes next week so we can enjoy our Santa Claus Rally into year’s end…’Bye!
They are a bit slow aren’t they.
A bullish signal from OBV on Friday and some bullishness on the weekly TA chart is seeing me swap over the main and alternate wave counts now.
Last analysis the main count has us in a third wave up and the alternate in a third wave down. Why swap if OBV bullish?
Thank you, Lara. You don’t owe us these late-day updates, but we do appreciate them! It’s a sweet extra touch of client care. As the Brits say, “Good on you!”
🙂 Thank you Curtis 🙂 My job is to look after you all the best I can.
Very interesting pricing anomaly in VIX 10.00 strike option chain. The bid on next week and two weeks out is just about the same at around 1.50
Buying a small contingent two weeks out for midway at 1.85 (ask was 2.00). A no brainer (another one of the inside tricks people!!) 🙂 🙂 🙂
Whooooaaa!!! Did I just move the VIX market with that buy???? Egad!!!! Ooops!!! 🙂
If it goes above 11.14 I gonna get me some more!!
Adding VIX 10.00 strike calls two weeks out. We are going to get a spike next week, Yipee! 🙂
Stock position traders: SLCA is worth a look. It could rrrrrruuumble (driven by energy, mostly sand for fracking I believe). I’ve also finally gotten aboard the RHT rocket ship, way too late but any profits a good profit, and in recent RHT style, my buy has gone instant green. It’s in an exponential move on the weekly. Might as well catch some.
I mentioned a week or so ago that I was stalking FXE. It appears to have bottomed and turned, and I’ve gotten long there, I think it’s a decent set up. Go Euro…
This is a watching paint dry market at the moment!
*YAWN*
That said, I have a set up that works for me, and it just might trigger today. Using 8, 21, 34, and 55 ema’s, and I want to see them all cross to the “positive side” and price get clearly above the 55 on a 15 minute chart. Ala Nov 3 action. Extremely similar set up. Very close now…
Okay I admit I entered a tad early…but in XIV, not SPY/UPRO etc. BE stop in place, time to play some guitar! be-deerrrr bedum dum dum….. I do love this job!!
Kevin,
Very nice and simple technique…..visually effective! I like using the ema’s also. I also use the Ichimoku cloud to help confirm the move and to determine the strength of the move.
It could be I got this all wrong and that contracting triangle if forming from a downward trend…I don’t have a clue…lol! 🙂
Surprising that the bulls cannot make even a feeble attempt at re-entering the gap area above this morning’s high around 2586.50….
Oops! I meant yesterday’s highs…
Could turn out to be a breakaway gap to the downside!!! It’s rejected price now twice since the initial gap formed.
Hopefully that move out of the triangle under way so we can get on with it….
That has got to be the most ridiculous, pathetic excuse for a thrust out of a triangle I have ever seen…who are they kidding??!! They’ve gotta do a lot better than that…Yikes!
Okay market wizards, riddle me this one. I look at XIV and I look at SPX. And it’s virtually perfect symmetry. EXCEPT…XIV continuously “slides higher” relative to SPX, because of the 4-5% PER MONTH “natural” rise in price driven by the contango in the VIX futures markets that are used to price XIV. So…if I want to trade SPX using elliott wave analysis (and I do), why don’t I always use XIV as my vehicle, given it’s got a 40-60% PER YEAR POSITIVE EDGE??? To say that’s “huuuge” would be a gross understatement!
So why not? Given also that I’m not a buy and holder, I trade. I’m definitely not in when the market is moving sharply down. So the risk of backwardation etc. doesn’t really apply “to me”, as I see it.
Just curious what all you volatility trading experts think about this.
(The corollary for me is never or extremely rarely use the VXX/UVXY instruments, due to their negative contango continuous price drops. Just sit out the down drafts in the market and XIV).
Also true for SVXY. They have both for quite some time been one-way bets so you are right…
I’m no volatility trading expert, but after years of paying the price for naive trading, I’m finally starting to wise up about spotting low-risk entries and prudent exits.
I know the trend is up. But in this insanely overpriced market, I’m as bearish as they come. That’s why I tend to trade short-term only right now — usually intra-day, occasionally holding overnight if it seems good.
Up or down, I do not care.
For those kinds of trades, I find VXX/XIV to be good because of their massive liquidity and very tight spreads. (I avoid UVXY/SVXY because they are K1 instruments under US tax laws, whereas VXX/XIV are 1099.)
Late last year, my brother took a large long-term position in VXX, buying more and more as it dropped. Of course, he was hoping for a huge spike that never came. You can guess how that turned out…
In VXX???? Oooouucchh. I did the same several years ago, but in XIV. As it dropped from 50. My average price turned out to be 36. All of my retirement money. Yup. Went to 17. I just stopped trading and ignored the market for a year. Yup. I “knew” it would come back. My balls dried up when it got to 35.8…and I bailed out almost BE. Happy day. You know the rest of the story!! Lol!!! Woulda coulda shoulda.
A VIX close above 11.14 would overcome 200 day SMA resistance and presage at least another few more days of marching higher…
Absence of selling pressure as evidenced by this low volume bullish;
Inability of banksters to drive price higher in the absence of sellers bearish;
Stealth accumulation of long vol positions possibly bearish;
Time to wait for Mr. Market to show his hand… 🙂
Movement out of triangle could spike up to gap area where it should find resistance….
Big drop in gold for some reason?
Are you kidding? Dumping of naked short contracts in the futures market is a regular occurrence with that metal…
As luck or perhaps something slightly more would have it, I exited GLD a day or two ago as it appeared to once again be peaking. Lara’s last public gold analysis had it going up to perhaps the Oct highs and then rolling over, and I figured it could easily roll well below that, so I got aggressive with my stop.
It’s interesting to consider the macro trends and their inter-relationships. A continuing bull market in US equities. Yen (safe haven) can’t get off the floor. Interest rates rising, bonds falling (I’m in TBT at the moment). Gold going sideways/down (just bailed on GLD). Commodities definitely in a bull mode (considering a GSG play). Oil spiking up (and maybe initiating a breakout to the upside?), also an inflationary signal . I note that energy today is well off, even though oil is stable; I’m not in energy at the moment, thankfully, but I have been trading it to the long side a lot recent as it’s been hot. So energy and gold moving down sharply together, even with oil stable…hmm, what it all means I dunno.
It’s invalidated my wave count 🙁
Still, so far higher highs and higher lows over the last week. Basing I think.
Triangle not yet complete…
Eyeing November 24 UVXY 20/20.50 put spread. If they trade for under 1.00 that will be the set-up…
We have some kind of triangle underway
We should see a quick upward thrust and a sharp reversal. These are fun to trade… 🙂
I am starting to think that pre-market attempted smash of VIX that was so decisively rejected could be ominous for the short cohort…remember the picture of that python awhile back?
Selling remaining VIX calls for 2.00
Looking for entry on UVXY bull spread for possible ten bagger….
The 1st BTFD Failure about to occur!
That would be YUGE!
They tried mightily in futures to no avail…
VIX B bands are opening to contain price. This is a Verne proprietary signal that often indicates further upward movement…. 🙂
If you are still holding VIX 10 strike calls, the market makers are trying to rob you; don’t let ’em do it!(hint: they will pay a LOT more than the bid…)
VIX is going to bust H&S. I expect so will UVXY…
Vol moving higher…early warning?!
Looks like we need one final low in volatility before fireworks. Another H&S pattern in UVXY…
While I believe it is generally idle to speculate on reasons and causes for market action, it is entertaining. I suspect we ARE in the alternate (and if today continues in the current vein, I suspect the alternate will be tomorrow’s main), and I suspect the root cause of the choppy and increasing downward movement is the incremental perception of likely failure of the tax giveaway to the rich bill. I cannot understand how they could successfully pass it, given some Republicans stsill hold fiscal responsibility values that perhaps outweigh their concern for getting body slammed by Trumpsters (which in turn is probably a smaller concern after last Tuesday). They are proposing giving away $1.5 Trillion of money America doesn’t have to corporations and the extremely wealthy, for zero reason other than “it’s payback time” for those same folks buying their representatives (paying for them to get into office). Arguments that the economy “needs” such a giveaway are clearly and patently absurd, and arguments that US corps are “highly taxed” relative to other countries is pure alternative fact (US is #6 SMALLEST on the country list!). Combined with the increasing voter outrage re: Republicans and their policies demonstrated on Tuesday, I extremely doubtful of success of this bill, and I would expect significant market retrace as a function of that. Just my idle $0.02.
I’ll take your 0.02, and raise you a dime! 🙂
Truer words never spoken….
The Tax Bill will pass! Anyone who thinks it won’t is delusional! You will be amazed at how many new good paying jobs will be created over the next 5 years due to the cut in the corporate rate to 20%, 100% expensing of plant, equipment & other, the change to a territorial system and the 25% cap for pass through entities which includes prioritorships!
THEN Starting after the 2018 Election… The entire bureaucracy of the US Government will be put through a complete restructuring with the Goal of providing services more efficiently for American citizens and effectively than anyone thought was possible. When that is completed… everyone will be amazed at how fast deficits will shrink, be eliminated and debt will begin to be repaid. This will take a few years to accomplish as the bureaucracy will kick and scream every step of the way.
This restructuring is long over due and only Business people who enter Government can accomplish. All these corrupt Lawyer turned politicians don’t know how to do a Fking thing other than direct tax money to make themselves or their friends and donors rich!
Highly entertaining indeed! I’ll keep my eyes open for the start of that transformation.
BTW, in what magical way does this tax bill contribute to reducing the deficit? How does adding 1.5 trillion do that, anyway?
Just watch!
I must confess considering that pathetic cohort in Washington, I have my doubts…
Ironically, it is reported his take will be $31M in reduced taxes.
Rolled DIA 234 puts out 2 weeks for additional 1.10…
Wow! Long live the algos! Look at that…STUCK on 10.50!!
Anybody that thinks there is anything “normal” about this market is not paying attention. Yikes!
If they want to behave predictably, then that offers us a gift. Which I know you are taking and running with as fast as you can 🙂
He! He! 🙂
Massive assault on VIX pre-market. Right down to the 10.50 pivot. Somebody is REALLY running scared. Can we be so lucky as to see a sub-ten trade once more??!!
On Wednesday evening someone chided me for being bearish after I posted a chart showing some interesting DJI indicators. They then went on to cite ther remarkable recent run-up in the Nikkei and all the recent all time highs as reasons for my being wrong. Apart from the fact that this is an argument no experienced trader would ever make, I really had to smile at the irony of what was happening probably at the exact time this argument was being proffered. Fear is more powerful than greed. This is why price USUALLY goes up the escalator, and down the elevator, so to speak. If price starts going up the elevator…well, you get my drift… 🙂
I wasn’t chiding you, I was just pointing out the overall global bullishness of today’s market. When even the Nikkei is flying through the roof, it’s clearly “all aboard” the bull train. The reversal Thursday was something to behold, but it doesn’t change a whole lot. It’s possible we could see a pullback in SPX here depending on how tax reform goes but in any case there is not nearly enough divergence in volume, breadth, or volatility to suggest the end is near. I personally think we’ll see a pullback here lasting for a week or two and then continued choppiness and divergence throughout the next several months. I think the first real signs of immediate danger will emerge toward the beginning of next fall when the Republicans.
But the market will make new ATHs before that and I agree with Lara’s approximate target of 2900. There is way too much technical strength and the wave count clearly supports a higher target.
Maybe…!
Speaking of technical strength,
have you taken a look at market breadth in Nasdaq lately?
What you will dicsvover there might give you pause… 🙂
No point to really even discussing breadth and technicals. It will end when the central banks stop buying, or get scared and sell. To be bullish here is (with any sort of rationale) very very foolish, as the only reason is the momentum built on central bank intervention.
Reasons are immaterial. Being right is immaterial. The only things that matter are the wave count and the technicals and the market action. Being anything except bullish here (generally speaking; short term trading is different) is contrary to all the above. An alternative view…
Guess that’s how the term “contrarian” came about
Well, what goes up must of course come down. And when it goes down it does tend to be much more volatile than the upwards leg.
However…
At this time price is making new ATH’s. Going with the price direction is more likely to make us $$, and that’s what we’re here for.
Trying to pick a high which may come tomorrow or in three years… is going against what price is doing right now. And that’s a sure way to have lots of losses.
To add to this…. when I did that exercise of looking at all the indicators I use in the past examples of 1987, 2000 and 2007 I did note that apart from a candlestick pattern at the highs, the indicators did not signal the approaching high as a major turn. The indicators did give strong warning signals AFTER the high was in place and price was rolling over.
With the sole execution of divergence with breadth.
Even their committed buying has its limits. As more and more index components trade lower and lower, they are going to have to exponentially increase their purchases of the few heavier weighted components to keep the market aloft. The equal weighted Nasdaq has NOT made new highs. When they reach the inflection point boy is it going to be something to behold, CB purchases or no; people are literally not going to believe what is happening before their very eyes. With so much of the index value concentrated in so few stocks, it will not take much selling to spark a precipitous decline. Don’t people understand what is happening???!!!! 🙁
I believe in the indicators Lara has provided us to monitor the impending risk of a major market top. We aren’t close yet. And yes, as the market moves through a sequence of larger and larger 4’s, it’s gonna get a lot more volatile than it has been for the last what, 8 years? But still be routinely pushing up to new ATH’s. Not for the faint of heart, really. Meanwhile…the MAIN AIN’T DEAD YET!!! I bought some XIV to take advantage at the moment, myself.
IYes Nick I think you may be right. It looks very much like Mr. Market has been playing
possum and is getting ready to whack the BTFD lemmings. I suspect the impulse will complete Monday and it will be the Johnny-Come-Lately bears’ turn to get ambushed.
I was expecting to be the one to get whacked on a spec trade I put on with options expiring tomorrow! lol! 🙂
At any rate, a fifth Hindenburg Omen in two weeks on Thursday is telling us to be extremely careful in this market…VIX green!
I think it’s the alternate transpiring
Miss me Doc?
hi wabbit