
For the short term, a small pullback was expected at the hourly chart level before price turned and moved upwards again. This is exactly what has happened for Thursday’s session.
Summary: The Elliott wave target is at 2,616 and a target from a small pennant pattern is 2,617. The upwards trend has support from very bullish On Balance Volume and now today some support from volume.
However, assume the trend remains the same until proven otherwise. The trend is up.
Pullbacks should be used as opportunities to join the upwards trend.
Always trade with stops and invest only 1-5% of equity on any one trade.
Last monthly and weekly charts are here. Last historic analysis video is here.
MAIN ELLIOTT WAVE COUNT
WEEKLY CHART
Click chart to enlarge.
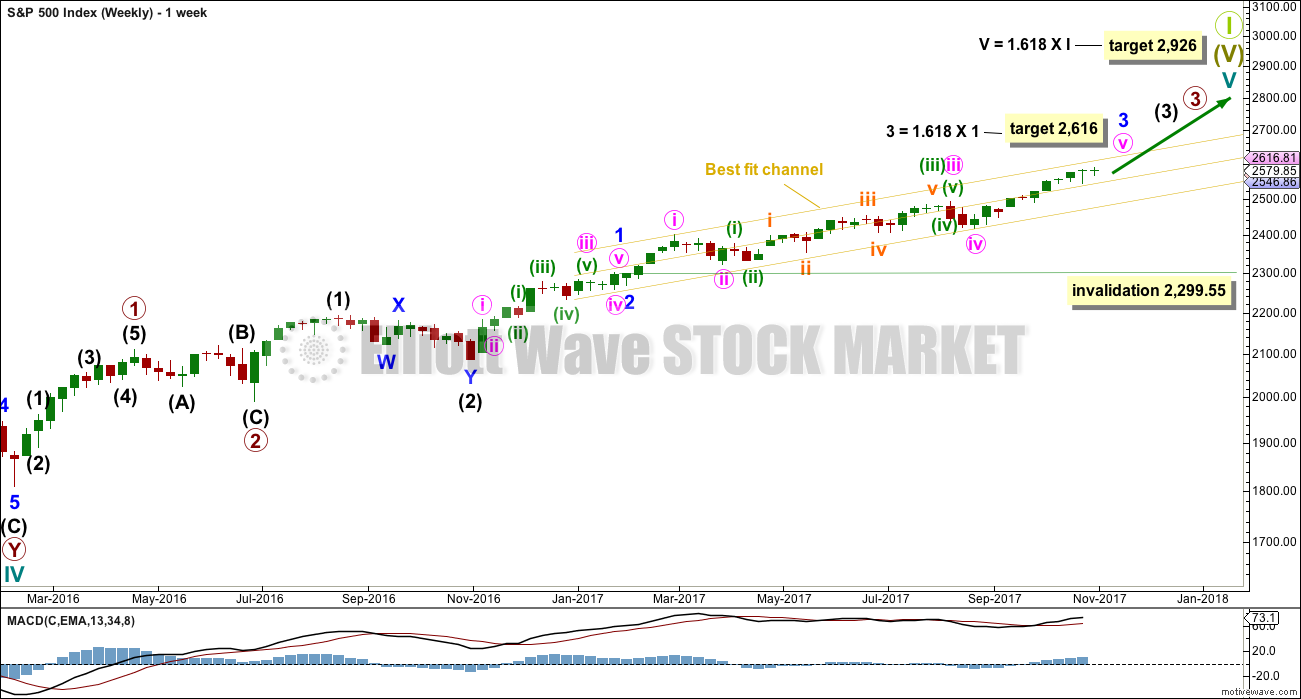
This wave count has strong support from another bullish signal from On Balance Volume at the weekly chart level. While classic analysis is still very bullish for the short term, there will be corrections along the way up. Indicators are extreme and there is considerable risk to the downside still.
As a Grand Super Cycle wave comes to an end, weakness may develop and persist for very long periods of time (up to three years is warned as possible by Lowry’s for the end of a bull market), so weakness in volume may be viewed in that larger context.
When minor wave 3 is complete, then minor wave 4 should find support about the lower edge of the best fit channel. Minor wave 4 may not move into minor wave 1 price territory below 2,299.55.
The next reasonable correction should be for intermediate wave (4). When it arrives, it should last over two months in duration. The correction may be relatively shallow, a choppy overlapping consolidation, at the weekly chart level.
DAILY CHART

Click chart to enlarge.
Minute wave v is completing as an impulse. The final fifth wave of minuette wave (v) is underway.
The target for minor wave 3 expects to see the most common Fibonacci ratio to minor wave 1.
Within minuette wave (v), no second wave correction may move beyond the start of the first wave below 2,544.00.
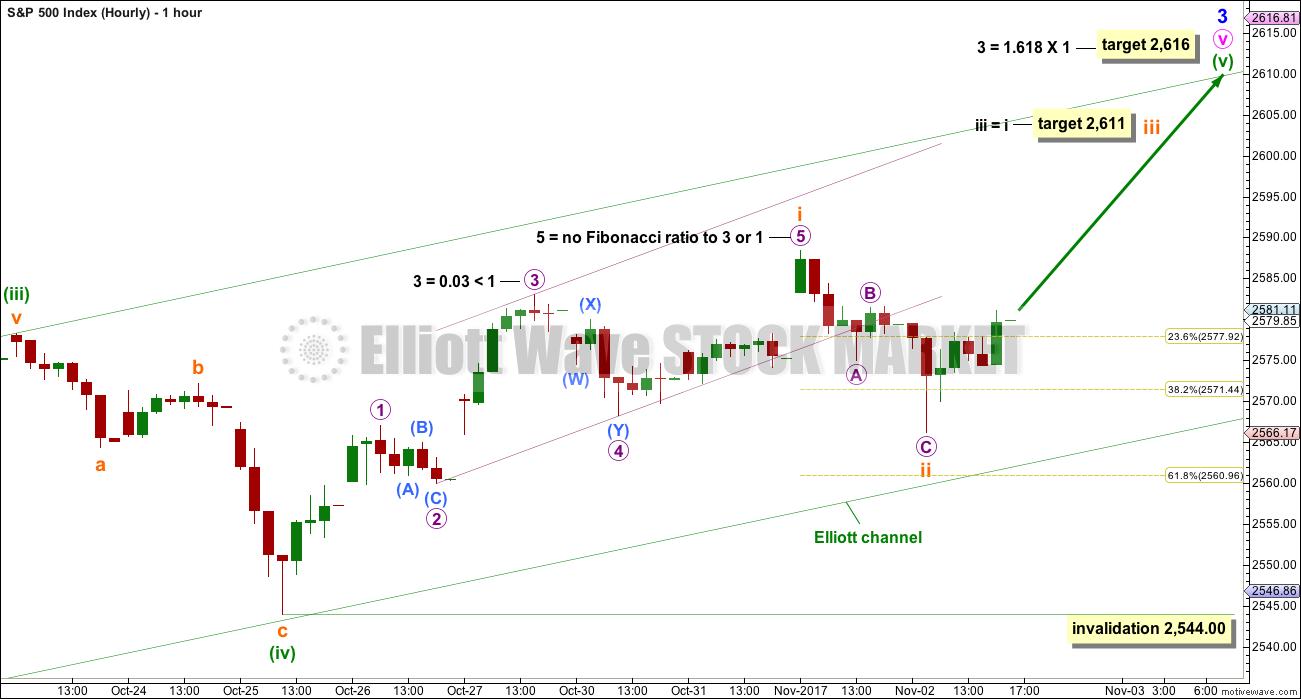
HOURLY CHART
Click chart to enlarge.
Assume the trend remains the same until proven otherwise. Assume the trend remains up while price remains within the green channel and above 2,544.
Minuette wave (v) must subdivide as a five wave structure. It may be an impulse with subminuette waves i and now ii complete. Subminuette wave ii now looks like a completed three wave zigzag.
This wave count now expects to see some increase in upwards momentum over the next 24 hours as a small third wave up unfolds.
A breach of the green channel by downwards movement would be the earliest indication that this first wave count may not be correct. If that happens, then seriously consider the alternate hourly wave count below.
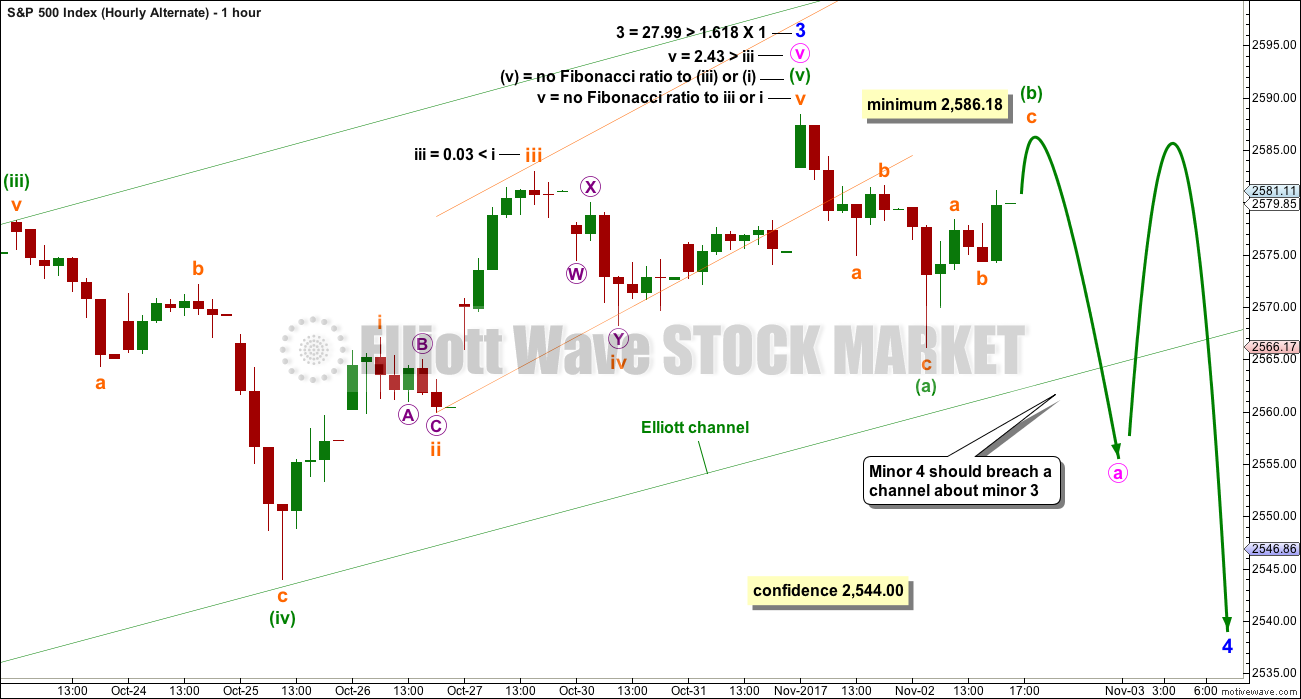
ALTERNATE HOURLY CHART
Click chart to enlarge.
This alternate simply moves the degree of labelling within the last five up all up one degree. It is possible again that minor wave 3 could be over.
Minor wave 2 was a quick shallow 0.16 zigzag lasting just three days. Minor wave 4 should also show up at the daily chart level. It may be a sideways consolidation, subdividing as a flat, combination or triangle, to exhibit alternation with the zigzag of minor wave 2. These structures are often more time consuming than zigzags. So far minor wave 4 may have lasted four days and the structure would be incomplete. It may end in a total Fibonacci eight or possibly even thirteen days.
A new correction at minor degree should begin with a five down at the hourly chart level. This has not happened, a three down only is complete. The probability of this wave count is reduced.
It is possible that minor wave 4 is beginning with a flat correction for minute wave a. Within the flat, minuette wave (b) must retrace a minimum 0.9 length of minuette wave (a). Minuette wave (b) may make a new high above the start of minuette wave (a) at 2,588.40 as in an expanded flat.
Upwards movement during today’s session has some reasonable support from volume. This reduces the probability of this alternate wave count; B waves should exhibit weakness, not strength.
TECHNICAL ANALYSIS
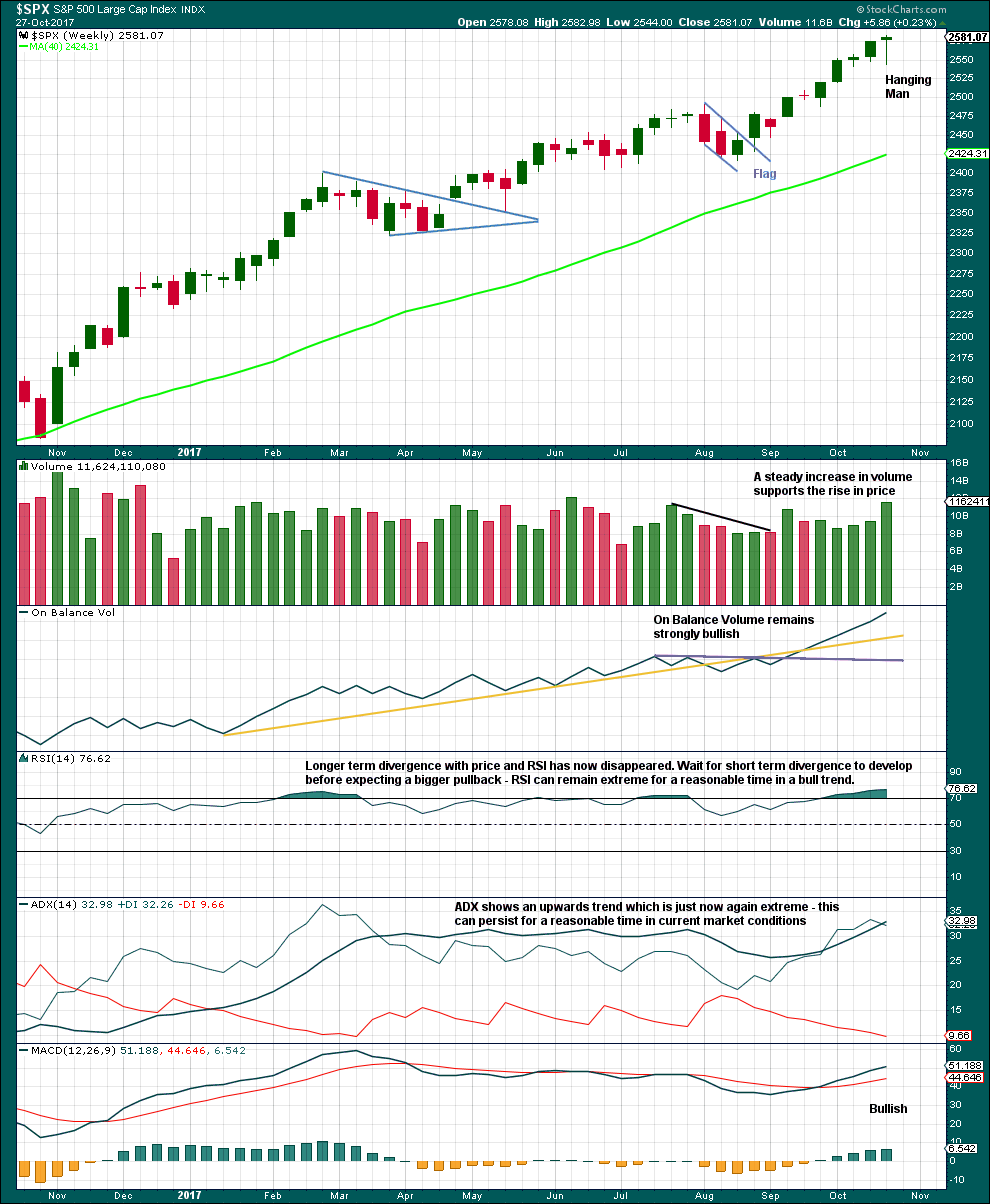
WEEKLY CHART
Click chart to enlarge. Chart courtesy of StockCharts.com.
The Hanging Man candlestick requires bearish confirmation because the long lower wick has a strong bullish implication. Without that bearish confirmation, it should not yet be read as a reversal signal and only as a possibly developing reversal signal.
Overall, this chart is fairly bullish. Only extreme ADX sounds a warning, but most recently this has reached extreme at the weekly chart level and remained so for several weeks while price continued to rise. It may do so again.
DAILY CHART
Click chart to enlarge. Chart courtesy of StockCharts.com.
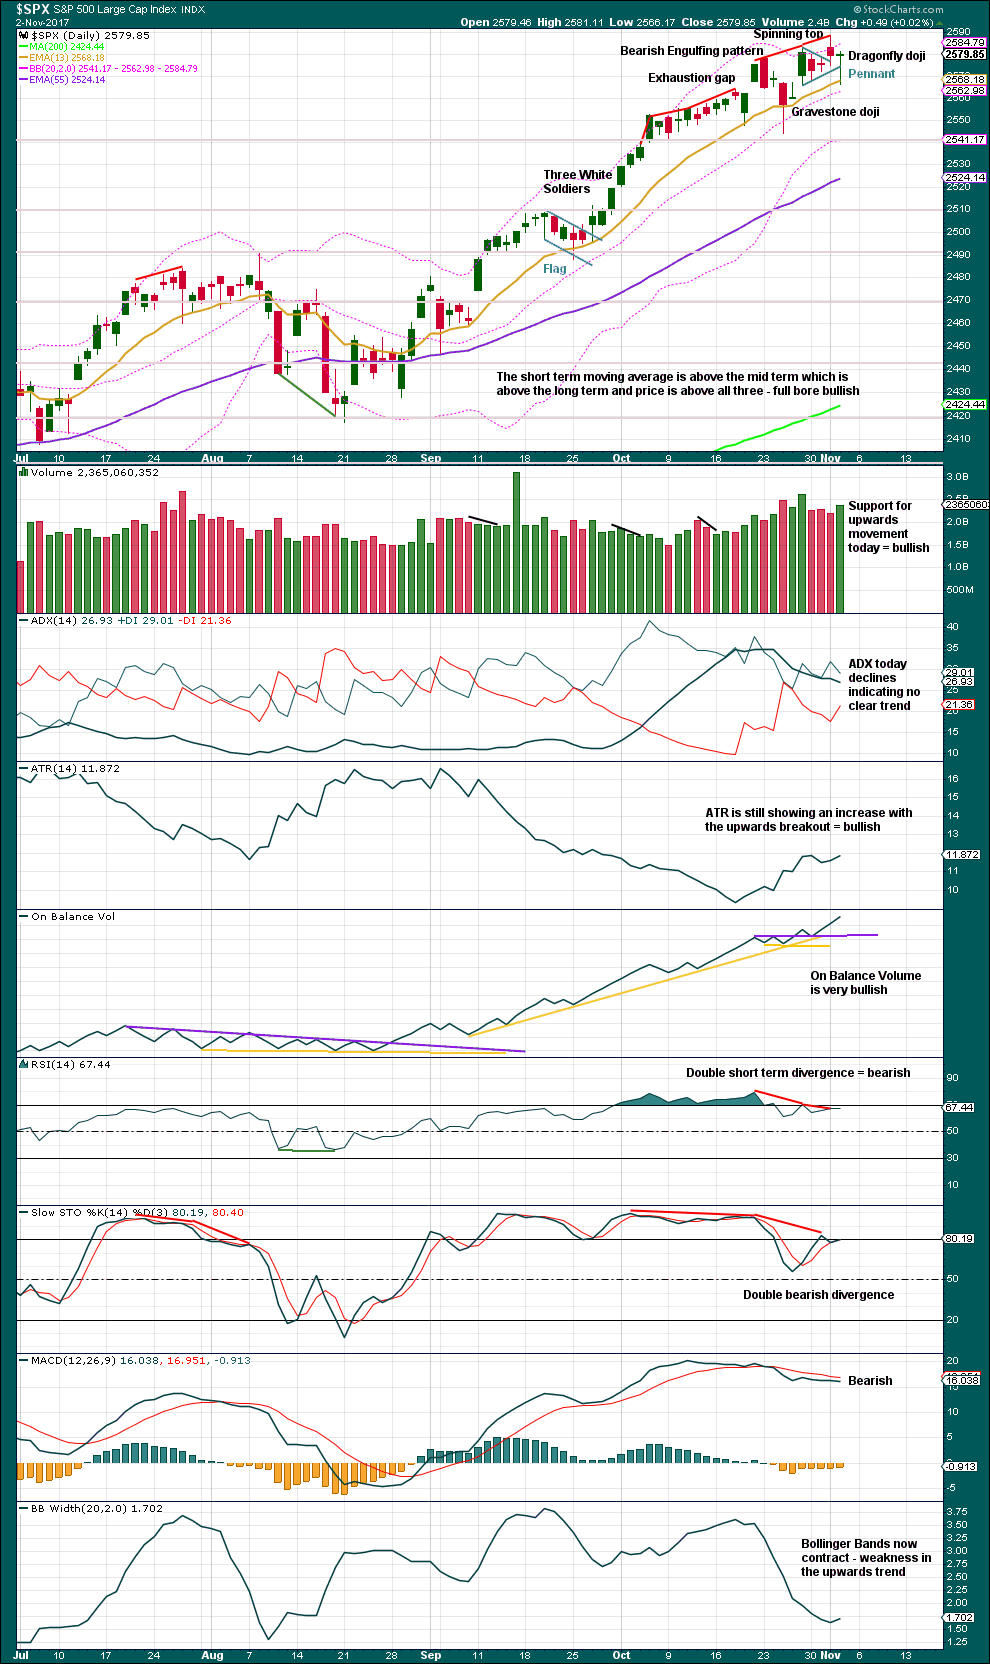
Pennants are one of the most reliable continuation patterns. The measured rule calculates a target about 2,617. Because this is only one point off the Elliott wave target, this area may offer strong resistance.
On Balance Volume remains very bullish, and today volume is also reasonably bullish. These two indicators will be given reasonable weight in this analysis, and they support the main hourly Elliott wave count and the target at 2,616 – 2,617.
There is still some weakness evident in divergence between price and RSI and Stochastics. This can develop further before price finds its high though. It will be taken as a warning that the trend is nearing an end, and not as a reversal signal.
A dragonfly doji is a signal in a downtrend, but not in the context of an upwards trend. It will be given no weight here.
VOLATILITY – INVERTED VIX CHART
Click chart to enlarge. Chart courtesy of StockCharts.com.
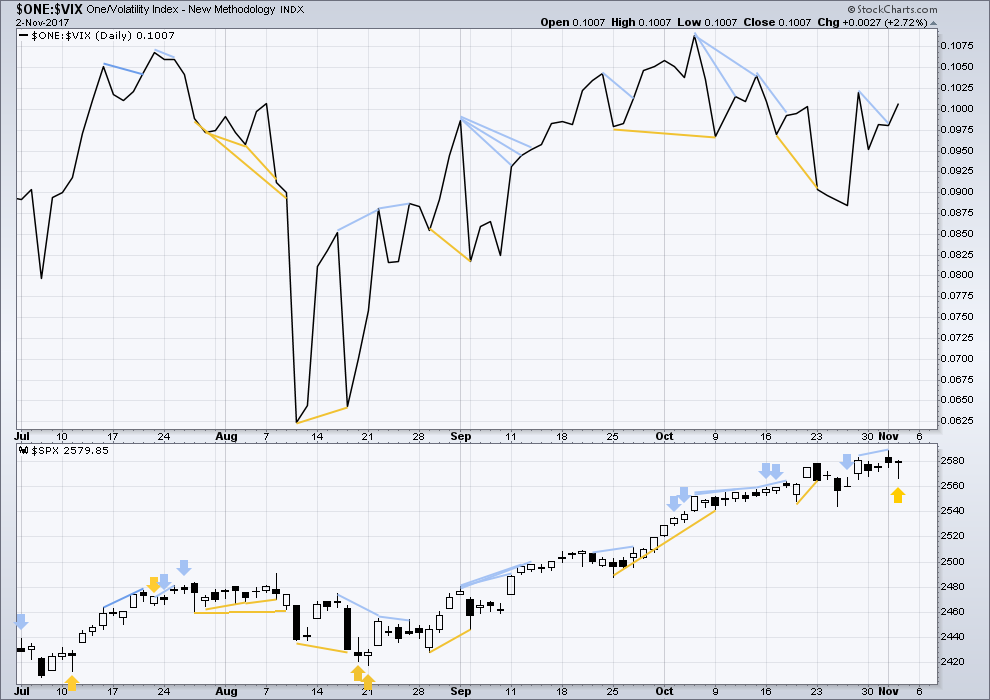
Normally, volatility should decline as price moves higher and increase as price moves lower. This means that normally inverted VIX should move in the same direction as price.
Short term bearish divergence noted in yesterday’s analysis has now been followed by a downwards day. It may now be resolved, or it may need one more downwards day to resolve it.
There is single day divergence today between inverted VIX and price: price moved lower, but inverted VIX has moved higher. Price did not come with a normal increase in volatility while price moved lower; volatility has declined. There is weakness within downwards movement today from price, and this divergence is interpreted as bullish.
BREADTH – AD LINE
Click chart to enlarge. Chart courtesy of StockCharts.com.
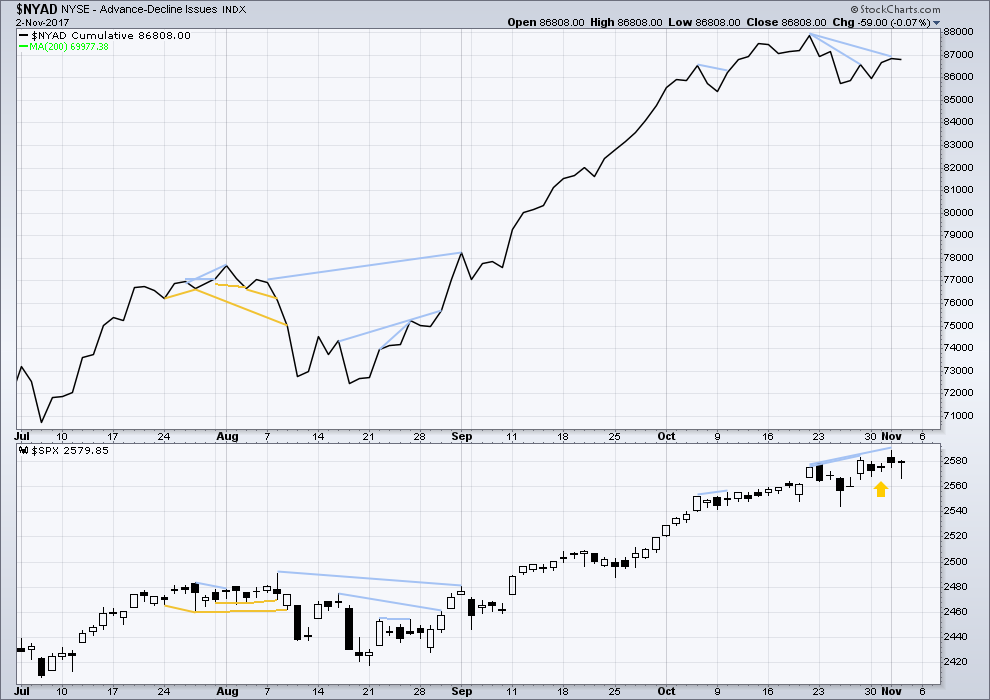
There is normally 4-6 months divergence between price and market breadth prior to a full fledged bear market. This has been so for all major bear markets within the last 90 odd years. With no longer term divergence yet at this point, any decline in price should be expected to be a pullback within an ongoing bull market and not necessarily the start of a bear market.
Bearish divergence noted in yesterday’s analysis between price and the AD line has now been followed by a downwards day. It may be resolved here or it may need one more downwards day to resolve it. There is no new divergence today between price and the AD line.
DOW THEORY
At the end of last week, DJIA and DJT have failed to make new all time highs. The S&P500 and Nasdaq have made new all time highs. DJIA and DJT have failed so far to confirm an ongoing bull market.
Failure to confirm an ongoing bull market should absolutely not be read as the end of a bull market. For that, Dow Theory would have to confirm new lows.
The following lows need to be exceeded for Dow Theory to confirm the end of the bull market and a change to a bear market:
DJIA: 17,883.56.
DJT: 7,029.41.
S&P500: 2,083.79.
Nasdaq: 5,034.41.
Charts showing each prior major swing low used for Dow Theory are here.
Published @ 08:47 p.m. EST.
Main hourly chart updated.
Now, I could also move the degree of labelling within subminuette iii down one degree. It may be a longer extension and only micro 1 may be completing. Just so everybody knows it’s not possible at this time for me to be sure of the degree of labelling within this move.
It makes no difference at this time to the targets. Only invalidation points. But I want to pull up the invalidation point so it’s actually useful in trading.
Micro 4 may not move into micro 1 price territory.
You can lead a horse to water…very bullish falling wedge in VIX and I guess I should not expect every body to see or care about it. I guess Chris and I will just take advantage… 🙂
Verne,
Picked some into the 940ish drop but keeping some powder dry for drop below $8 on VIX.
Make it rain pardner. It just might be that trading volatility isn’t everyone’s cup of tea. Me, I’ll be happy to jump in…when XIV is down to about 90 or less, and SPX EW indicates the start of a new impulse up. Then I’ll jump in hard. At the moment, I don’t want to trade what I perceive as little signal, lots of minor noise (but for you is golden opportunity; that’s awesome).
Heading toward a VIX all time low close? I fail to see the relevance of the 8.84 intraday number when it lasted for literally 1 second. An all time low close on the VIX confirms the continuing rally upward.
I agree, Jimmy. It’s really not as complicated as we sometimes want to think. Recent talk about a “short volatility” bubble is really nothing more than to say that stock prices keep going up. Never mind that it’s beyond all reason. It is what it is.
With that in mind, I’m trying to discipline myself to filter out the bluster and simply nibble away at short-term price action as it occurs, with low-risk entries and prudent exits. Thankfully this week has been good.
Updated hourly chart:
The upwards trend continues. Pullbacks are opportunities to join the trend.
There will be a larger correction lasting weeks coming up, but not yet I think. The structure of minuette (v) needs to complete first.
Pullbacks along the way up while minuette (v) continues should find support now at the orange base channel. That may be a guide for trailing stops for long positions.
Last trade of the week.
Buying December IYT 172 strike puts for 0.90 per contract.
Very bearish pattern developing as price is looking to hug bottom of expanding B band on the way down. Have a great week-end everyone!
Looks like VIX finding strong floor at around the 9.17-9.19 area. Quite an effort under way to break below 9 but no cigar…so far. We should see a strong move below to a new 52 week low or a sharp bounce higher off the lower B band.
It is worth keeping in mind that breakdowns from wedge formations has been going on for some time now. In fact just about every bearish market signal the last several weeks has been feverishly reversed so they are no longer an indication of an IMMINENT trend change. I do think however they are accretive and highlighting overall market weakness and a warning that a market reversal could be fast approaching….
New high in SPX, once again no new low in VIX. This is quite bullish for VIX but not necessarily a capitulation low. The new high is labored and as previously comes on declining volume. No telling how much longer the torturous climb could continue. Let’s see how VIX reacts to the new ATH….
The next VIX move off the lower B band is going to tell a whole bunch about where we are in this impulse up. An expansion of the B bands to contain price will be a big hint as to what degree we are likely seeing .
Maybe that is an ending diagonal with throwover in DJIA ?? …hmmm.
I have been seeing three wave moves (at least to my eye) on this move up but they apparently don’t quite follow EW ED rules. What is clear is that the move up is tracing out some kind of wedge, generally a terminal move.
Hi Kevin, I cannot see it from your chart but it would be interesting for you to post the price points of the top and bottom boundaries of your diagonal….
breach of the top boundary would be a heads up; breach of the bottom would confirm the pattern…
It appears SPX has done a series of three 1-2 patterns, and finally an actual 3. Which would imply price should not drop on the first ensuing 4 to below the high at 2582.93. Not that price is going to head back there anytime soon, the 3 keeps on running…the implication overall is a pretty big overall 3 move in development.
Got some DOG, got some VXX…let’s get happy.
So very interesting that VIX is now lower than my original entry price yet bid on 9.50 strike calls a bit higher at 0.75. Still hoping for a lower cost basis. Maybe someone with deep pockets will throw a lot of cash into a short trade…lol! 🙂
Pneumonic (not bubonic) plague in Madagascar threatening the entire East coast of Africa. Not much reporting on MSM but this has potential to be a global disaster with international travel being what it is today. This thing is airborne – coughing, sneezing, spitting etc.
IKR! That’s really scary…
A VIX spike down to just above 9.00 would be perfect. On closer inspection, the 8.75 number was a bit low I think for the measured move….
That VIX H&S pattern played out absolutely perfectly with price moving back up to test neck-line before heading briskly lower….measured move is about 8.75…
There is the plunge in VIX I was expecting. Price now touching lower B band so we may not get a new 52 week low unless price breaks below it. This could happen but imho not very likely to remain that way for very long…amazing! 🙂
The volatility crunch is nothing short of amazing. I don’t agree with your thesis of the importance of a new 52-week low but it does look like we could get there now.
Quite OK to disagree. Price, which is all that ultimately matters, does not care what either of us thinks! 🙂
I can assure you this is what a lot of traders were looking for. It is now the mirror image of the failure of VIX to print a new low while price was actually making new highs. A new VIX low in the ABSENCE of new market highs will be the ultimate signal of the height of mania…but what do I know?! 🙂
Well, we are only 3 points away now lol.
That is exactly what is so amazing. Even a new high does not change the import of the remarkable message being sent…
Thanks Mr. Market for giving me VIX under 9.50.
The short, mid, and long term volatility short positions are positively massive. The issuers were forced to massively short futures to balance the short and mid term short trades, and I for one cannot even begin to imagine how this one-sided a trade can be unwound in any kind of an orderly manner. As we have seen, the caveat is that it could continue for awhile so taking the other side of the trade in no way guarantees a quick payoff. In fact I am going to start rolling positions out much farther rather than taking short term profits on the next pop….
How is it that intelligent folk can not only assume that volatility will NEVER rise substantially above current levels, but have actually committed vast sums of money to that point of view?!
I am starting to rethink the old adage of fear being more powerful than greed!! 🙂
Is it me or is it an early Christmas Present!!!
Here is something quite interesting. Every single period of seasonal bearishness this year has been steam-rolled by this relentless market. The fact of the matter is we are now entering a season of traditional bullishness- the so-called Santa Claus Rally. Are we going to see an even more manic ramp higher with an even steeper parabola unfolding, OR will the market continue to buck seasonal tendencies but this time in the reverse?! Interesting….. 🙂
Hard to believe all the hand-wringing about the plunge in TSLA shares. It was the one thing about which I strongly disagreed with Tim Knight who kept talking about how strong the chart was. I was underwater on my short for many weeks but despite the obvious mania, that business model has always been toast. Now firmly in the green! Shares are going much lower. The same is true for AMZN despite all the ridiculous hype which I shorted at 1105. Clearly these kinds of trades have to have a long term view as one cannot know how much longer the mania could continue. There is no question about how it will end. AMZN is going to 600.00. Will add to position on close of 972.42 gap…
I agree with AMZN. The manipulation on that stock is criminal. Management panicked after the big miss for Q2 so they decreased Q3 guidance to a ridiculous extent, even though there was no real reason to believe EPS would be crushed that badly. Analysts were quite happy to give them their 0.01 EPS forecast LOL. So even though nothing changed from pre-Q2 projections other than that they had a huge Q2 miss, the stock is up 5% from it’s July high. lol.
If by business model you mean complete vertical integration…well, it works to a large extent for Apple! But for cars…maybe. However, Apple grew into that position. Tesla is trying to go from 0 to 120MPH in 3 seconds as a company, and it’s not possible. Will they ever be able to mass produce the model 3 with high quality? Debatable, and I lean to the “no” side! Nice play on the short.
That is one of my “set- it- and- forget- it” trades….. 🙂
For those interested in positional trade set ups, IBB appears to be turning back to the upside and could post major gains over the next few weeks.
I am actually looking for one more spike higher in the indices with possibly a new VIX 52 week low ahead of a serious decline…look a like a little head and shoulders formation for VIX on five hour…
Risk right now of a Dark Cloud Cover candle in DJIA today, unless price gets moving up instead of down soon. That would not be at all consistent with SPX being in a 3 of a 5 up (in theory). If DJIA price breaks the low for the day, I just might short that via DOG, as I believe such a candle portends at least a few days of consolidation.
Nice call Kevin, a lot of the action of the underlying components suggest more downside ahead, but one more thrust kinda makes sense as well. Are you seeing a potential ending diagonal as well?
I can structure an upward channel in DJIA, but I don’t see an ending diagonal. The DCC is pretty much toast at the moment; the bull woke up a bit late this morning! No short for me today, probably for the best. Working the long side of this and that…
Homebuilders ITB and XHB seeing a relief bounce but are going much lower imho…
Filled on Nov 8 VIX 9.50 calls for 0.60 per contract..
Congrats!! I’m going farther out as well.
🙂
Verne,
You play on the edge with these shorter term options…too risky for me hence would be looking to a few weeks out at least.
Yes indeed. I do NOT recommend my gunslinger approach for most folk. One of the ways I spook the market makers and force some short term capitulation is by using big lots on my trades and getting out quickly…not every one’s cup o’ tea…I am adding contracts on this move down….. 🙂
iGood morning!
Markk Twain referred to Congrress as the only native criminal class, and that has indeed become abudantly clear to the most casual observer. They are not only criminal, they are also clueless and/or corrupt. A careful reading of their just released tax proposal also reveals it vould be the final nail in this already fragile economy’s coffin. While it purports to lowe rates of taxation, it in fact does the opposite because of the number and kinds of deductions eliminated. There is no relief for small businesses which create the lion’s share of new jobs. The housing industry, another critical component of the economy, also takes a big hit becsuse of what they do to mortgage interest and real estate tax deductions The bottom line is that these cretins are showing their true colors in the fact that they will end up getting MORE revenue from the middle class, allowing them to keep spending like drunken sailors, AND the burden of the corporate tax cut will be borne by middle class taxpayers. It stinks to high heaven, and the voters should hold them accountable for this incredible malfeasance…I doubt they will 🙁
Another HO Thursday…
There was another HO last week as well.
Here here!!! It truly reeks of 0.5% corruption. 80% of all the tax $’s “saved” goes to those with incomes over $1M a year. This “tax reform” is nothing more than a massive cash giveaway to the ruling oligarchy of America. “Of the rich, by the rich, for the rich”, is the new DC passphrase. Welcome to the Koch Brothers vision of America, where a few live fabulously, and the masses live in squalor.
I like Paul Krugman in today’s NYTimes: “What we are witnessing now is the end of the charade, the political equivalent of what happened when graduates of Trump University tried to get some value in return for their money”. And later…”You won’t go far wrong if you think of the big tax cuts in the law as having been custom designed to benefit the Trump family”. And later “Why should tax cuts even be on the table? We have budget deficits, not surpluses, and lots of unmet needs for future spending. US taxes are low, not high, compared with other wealthy countries. Predictions that tax cuts will lead to rapid economic growth have been wrong time and again. By large margins, voters want taxes on corporations and the wealth to go up, not down”. Too bad we don’t live in a democracy: what the majority wants isn’t relevant in the US anymore.
I generally vehemently disagree with anything this guy has to say. This time I think he is right on the money.
Trump is so desperate for a legislative “win” he is going to allow the disgusting traitors in the Republican corrupt leadership to lead him right off an economic proverbial cliff. I am just curious as to whether he is actually in on the con or just that naive….
The fact his own family is the “perfect example” of the type of family that makes MILLIONS UPON MILLIONS of incremental profits from this tax plan pretty much says it all. Oh shock and awe…Trump is all about HIMSELF. I’m just stunned. It’s a con on the 99%, and the American public is just ignorant and disinterested enough to sit around with their thumbs in the proverbial place, munching popcorn and watching the NFL and NASCAR to let it happen.
On the positive side for bears like you…the massive deficits will balloon the market even more, UNTIL we hit the massive recession, then a few of us will score big on the short side. Of course, the country will be in economic ruin, but that’s part of the Republican plan: by then, the Dems will be back in power, and nothing better to hand them than a country in the toilet.
I hear ya. I keep thinking about something Tim Knight said a few months back that really had be wondering. He said that the kind of bear market we are likely to see down the road is one that even an inveterate bear like himself is not going to like…it is going to be that ugly….!
I accept your apology. signed, Doc
Sorry Doc!