
A small pullback remains above the invalidation points on the hourly charts.
The main Elliott wave count is still strongly favoured by volume and On Balance Volume.
Summary: The target is at 2,616. Volume and On Balance Volume support this view. The small pullback today may present an opportunity to join the upwards trend.
If price makes a new low below 2,544, then a pullback should be expected to be underway. The target is at 2,533 to 2,527. Short term bearish divergence between price and the AD line supports this view.
Last monthly and weekly charts are here. Last historic analysis video is here.
MAIN ELLIOTT WAVE COUNT
WEEKLY CHART
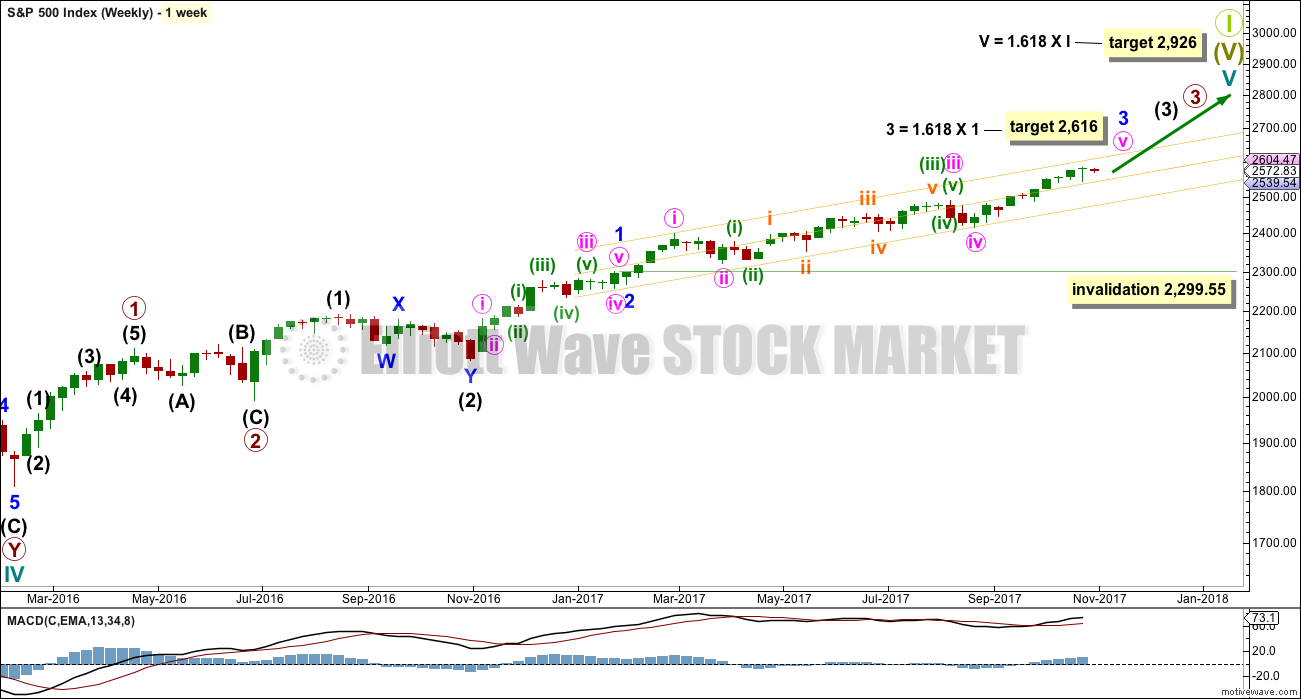
Click chart to enlarge.
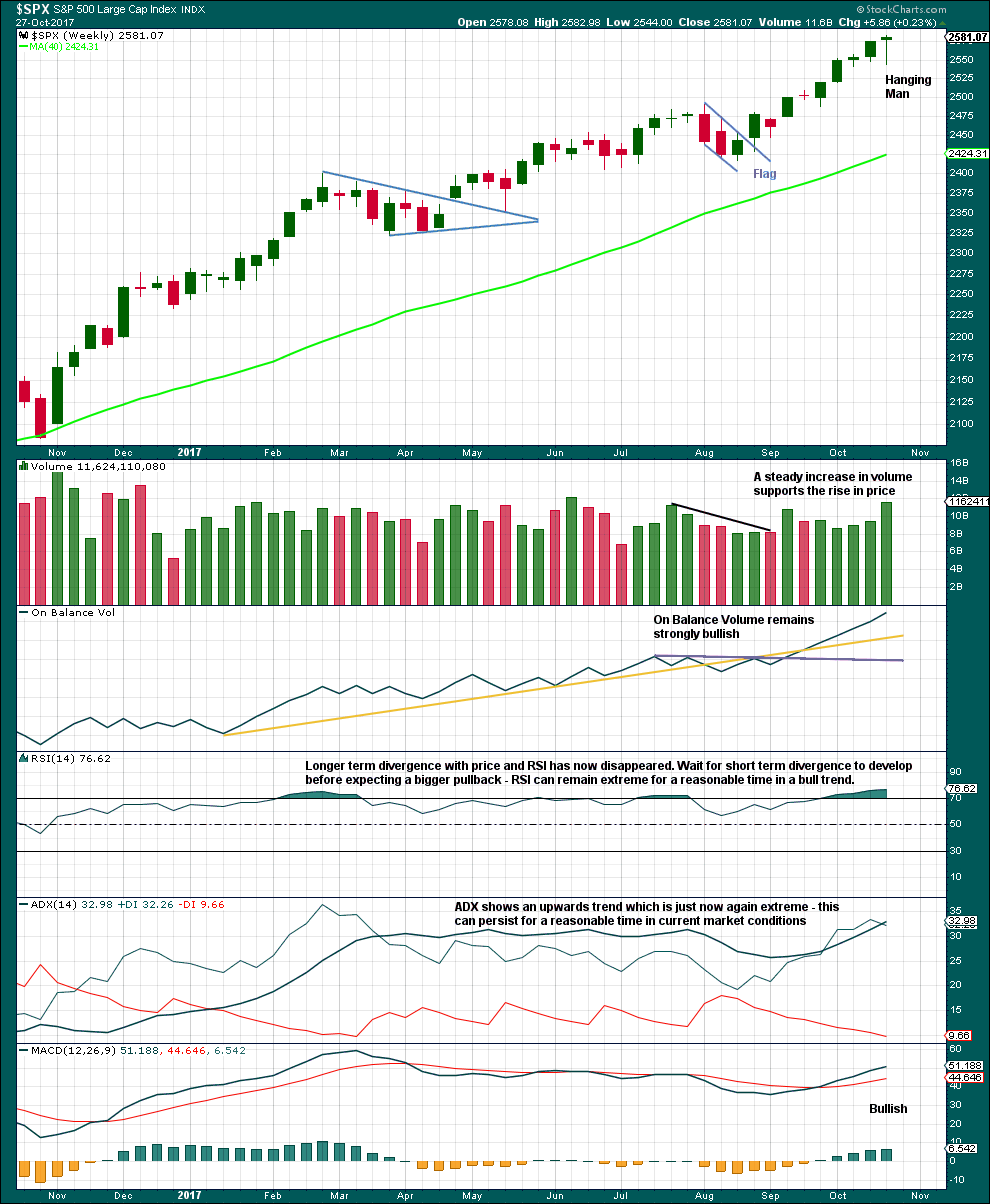
This wave count has strong support from another bullish signal from On Balance Volume at the weekly chart level. While classic analysis is still very bullish for the short term, there will be corrections along the way up. Indicators are extreme and there is considerable risk to the downside still.
As a Grand Super Cycle wave comes to an end, weakness may develop and persist for very long periods of time (up to three years is warned as possible by Lowry’s for the end of a bull market), so weakness in volume may be viewed in that larger context.
Within minute wave v, no second wave correction may move beyond the start of its first wave below 2,417.35.
The next reasonable correction should be for intermediate wave (4). When it arrives, it should last over two months in duration, and it may find support about the lower edge of this best fit channel. The correction may be relatively shallow, a choppy overlapping consolidation, at the weekly chart level.
DAILY CHART
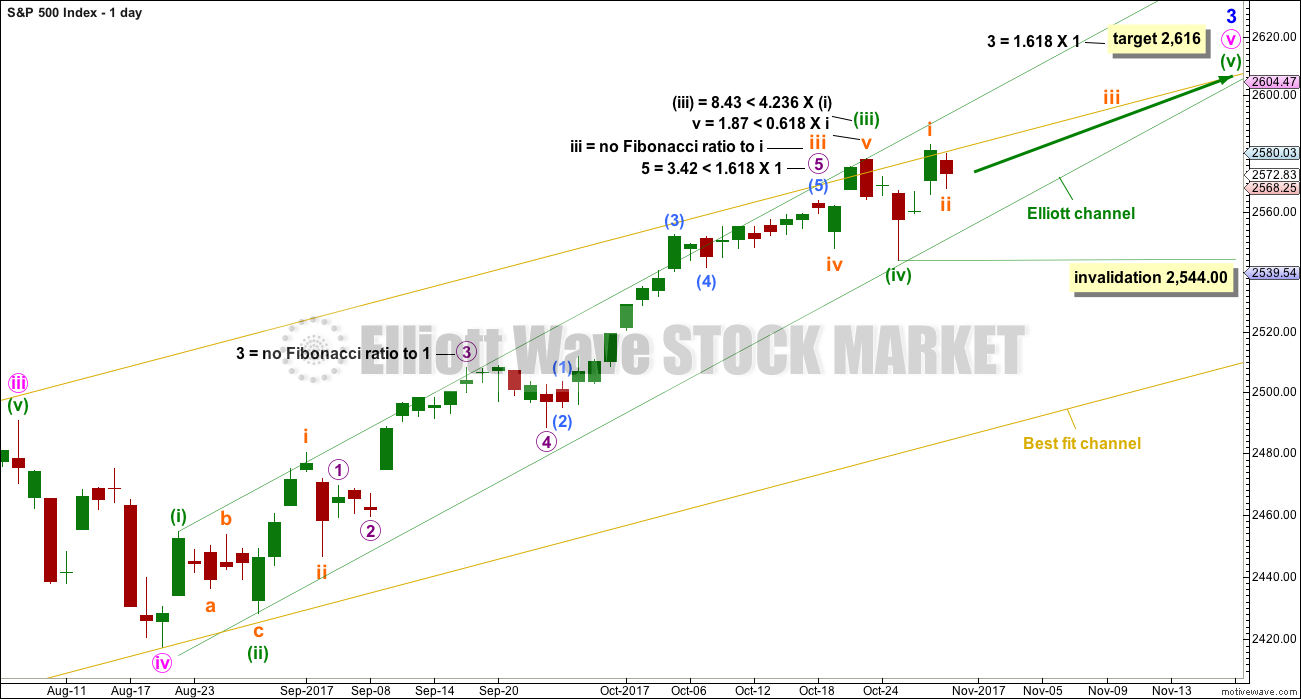
Click chart to enlarge.
Friday looks like a classic upwards breakout from a small consolidation. A breakout is a bullish signal.
The target for minor wave 3 expects to see the most common Fibonacci ratio to minor wave 1.
Within minuette wave (v), no second wave correction may move beyond the start of the first wave below 2,544.00.
Fibonacci ratios for this main wave count are better than for the alternate. This increases the probability of this main wave count slightly.
HOURLY CHART
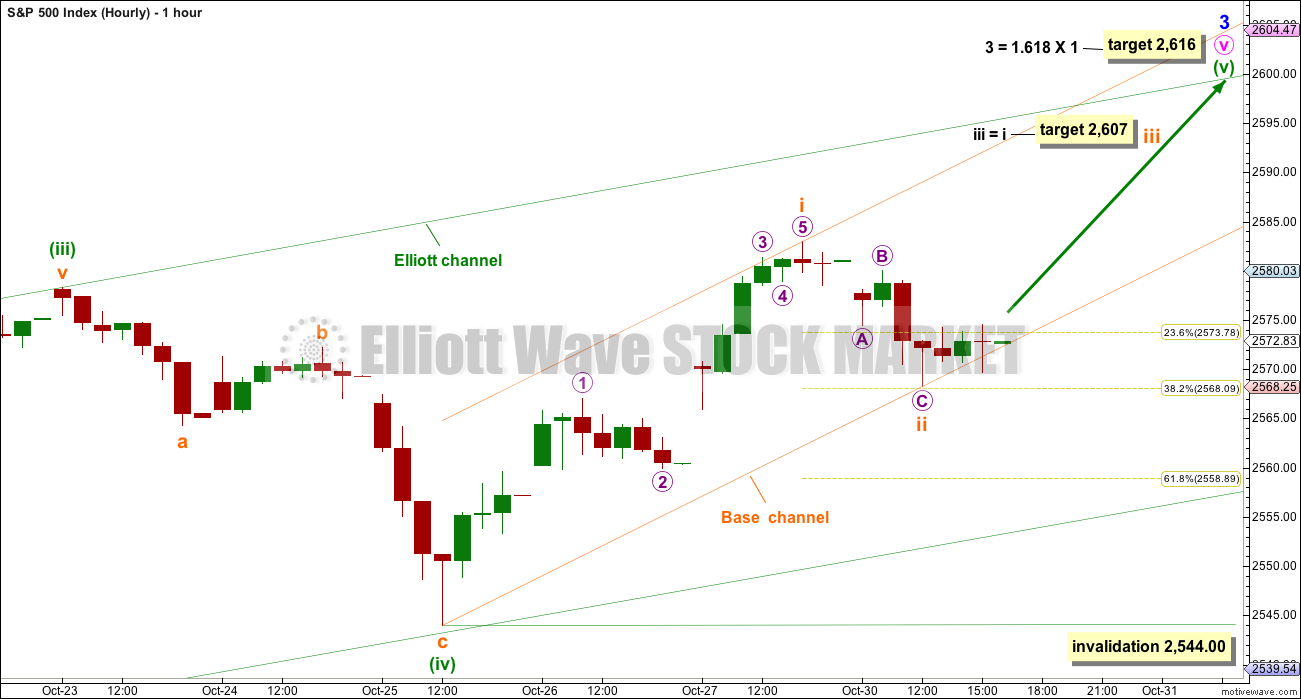
Click chart to enlarge.
For the short term, the analysis is changed to see only subminuette wave i complete at the high for Friday. Downwards movement has breached a channel, which contains the upwards wave labelled subminuette wave i, so this looks like a separate new wave and not a correction within the last wave up.
Subminuette wave ii may be over at today’s low as a shallow 0.382 correction of subminuette wave i. It may also continue lower as a double zigzag to end close to the 0.618 Fibonacci ratio of subminuette wave i at 2,559.
Because subminuette wave ii is shallow, the Fibonacci ratio applied to the target today for subminuette wave iii is equality in length with subminuette wave i. If subminuette wave ii moves lower, then this target must be recalculated.
Subminuette wave ii may not move beyond the start of subminuette wave i below 2,544.00.
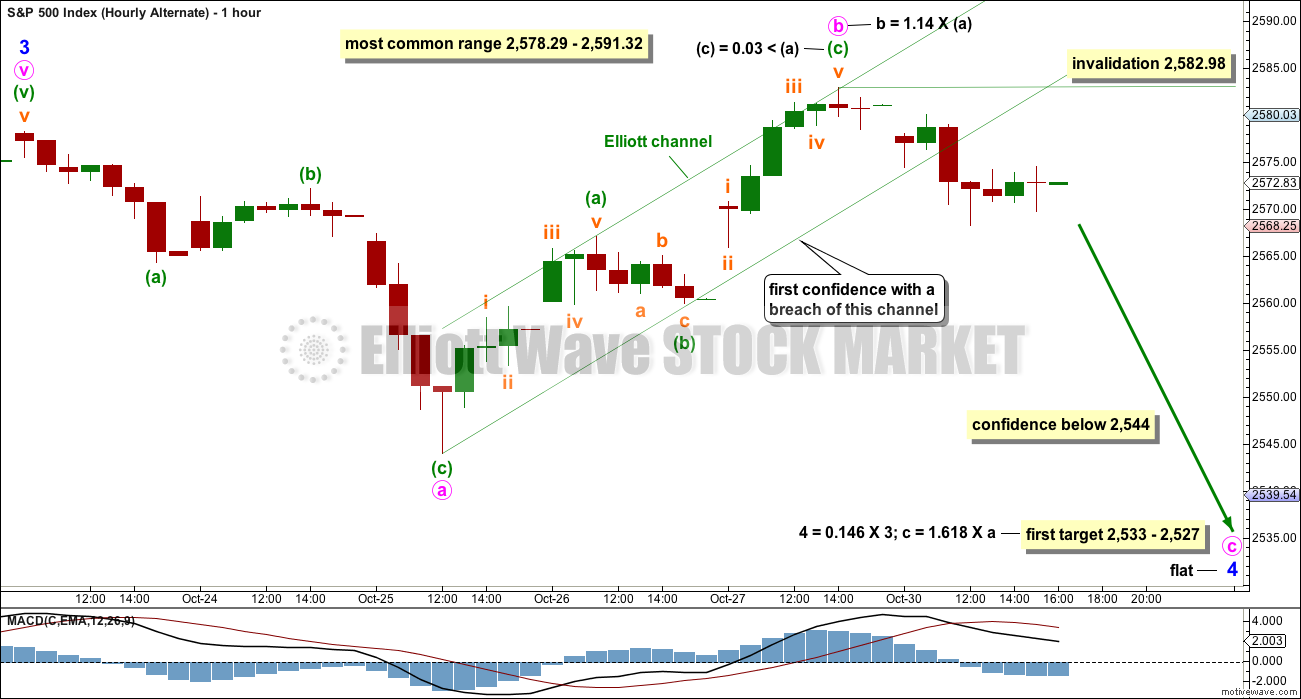
ALTERNATE WAVE COUNT
DAILY CHART
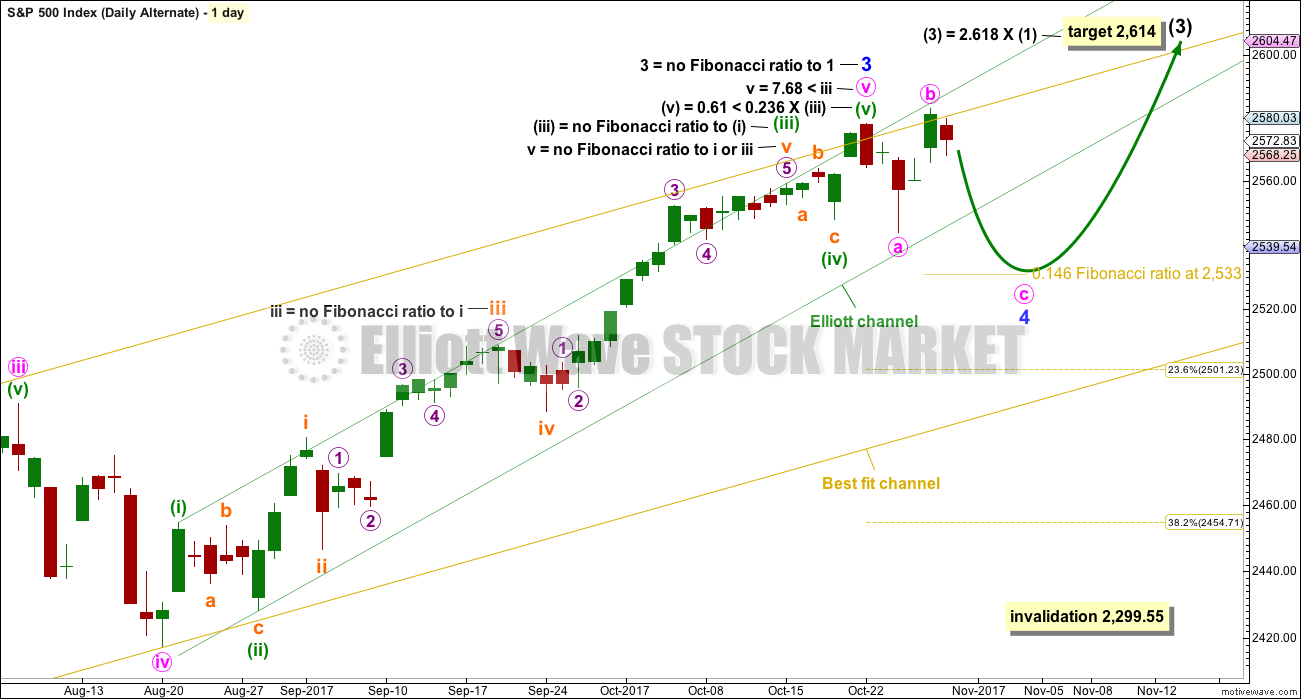
Click chart to enlarge.
This alternate wave count will consider the possibility that minor wave 3 is complete and minor wave 4 is continuing as an expanded flat correction. The degree of labelling within minor wave 4 has been moved up one degree. If minute wave c continues over a few days, then minor wave 4 would have lasted about the right duration for a correction at minor degree, and would not be too disproportionate to minor wave 2 which lasted only three days.
A breach of the lower edge of the green Elliott channel about minute wave v would be expected when minute wave v is complete. If this happens, it would add substantial confidence that minute wave v is over and so minor wave 3 should be over.
Minor wave 4 may not move into minor wave 1 price territory below 2,299.55.
HOURLY CHART
Click chart to enlarge.
Minute wave b is still within the most common range for a B wave within a flat correction. Because minute wave b is longer than 1.05 times the length of minute wave a, this may be an expanded flat correction, which is the most common type.
The appropriate Fibonacci ratio to apply to the target for minute wave c is 1.618. This gives a target close to the 0.146 Fibonacci ratio of minor wave 3.
So far minor wave 4 has lasted five days. If it continues for another three, it may end in a total Fibonacci eight sessions.
This wave count now requires a new low below 2,544.00 for reasonable confidence. The fact that upwards movement labelled minute wave b has good support from volume does not support this wave count; B waves should exhibit weakness, not strength.
TECHNICAL ANALYSIS
WEEKLY CHART
Click chart to enlarge. Chart courtesy of StockCharts.com.
The Hanging Man candlestick requires bearish confirmation because the long lower wick has a strong bullish implication. Without that bearish confirmation, it should not yet be read as a reversal signal and only as a possibly developing reversal signal.
Overall, this chart is fairly bullish. Only extreme ADX sounds a warning, but most recently this has reached extreme at the weekly chart level and remained so for several weeks while price continued to rise. It may do so again.
DAILY CHART
Click chart to enlarge. Chart courtesy of StockCharts.com.
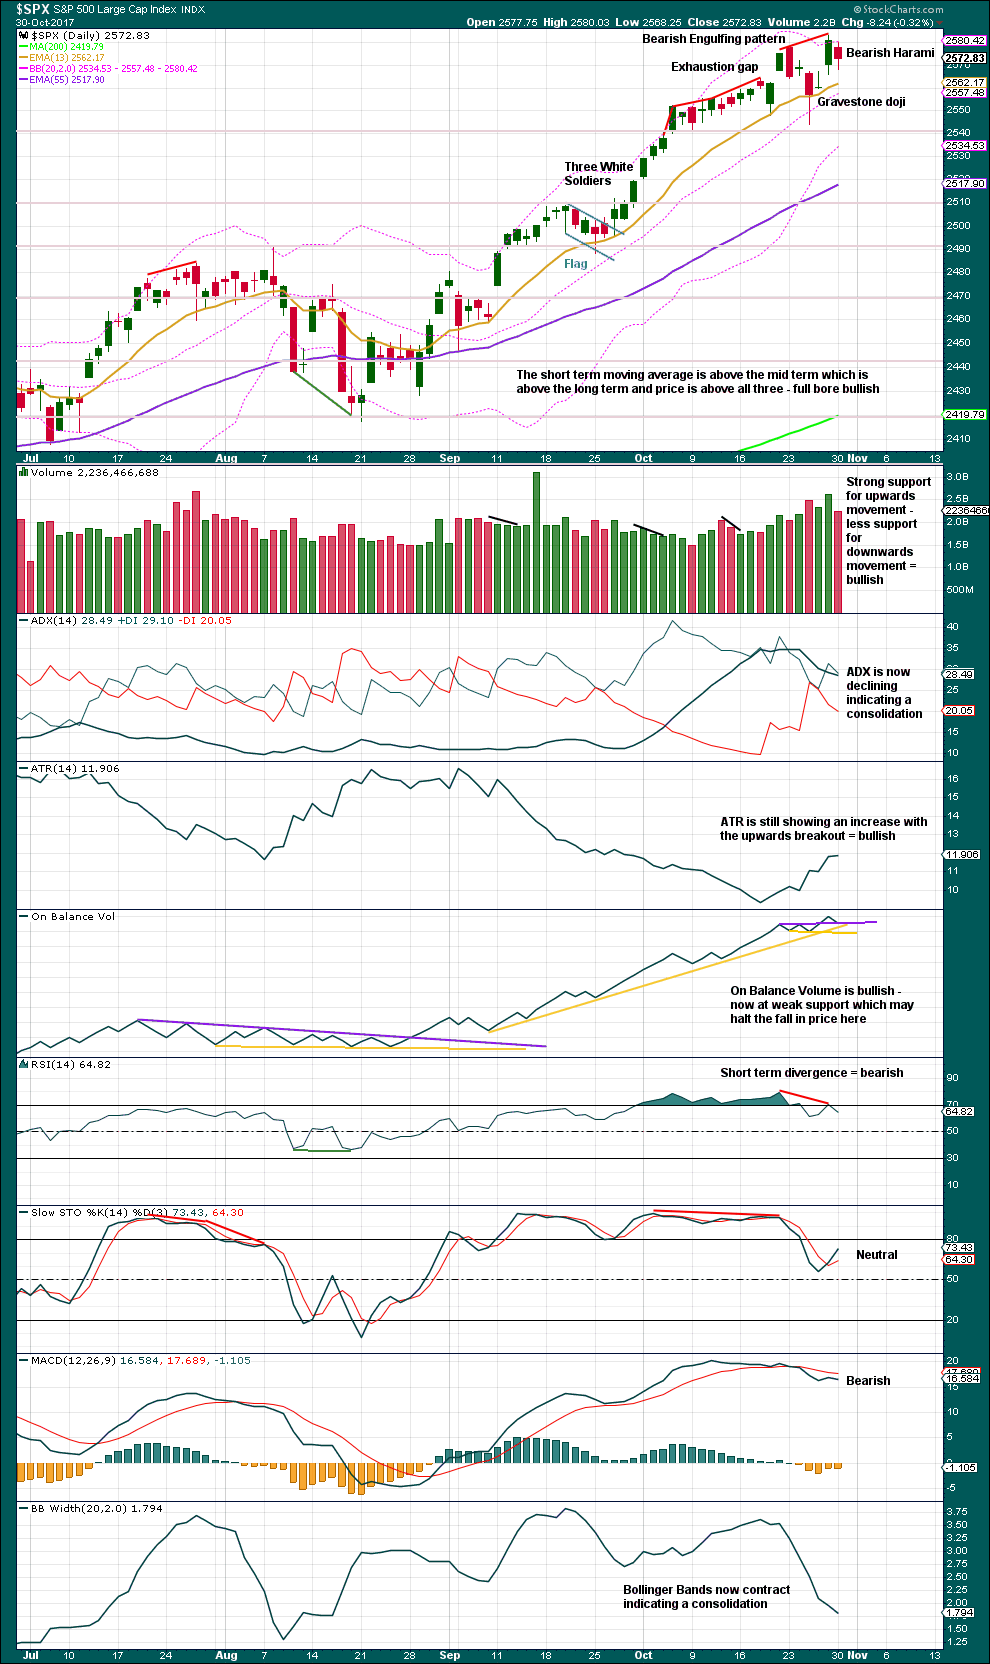
Harami are not strong reversal patterns. Here, a Bearish Harami may indicate either another consolidation within the upwards trend or a reversal. It makes no comment on which direction price may go next nor how far or for how long.
Volume and On Balance Volume remain bullish. Give On Balance Volume reasonable weight; it is one of the more reliable indicators. This supports the main Elliott wave count.
VOLATILITY – INVERTED VIX CHART
Click chart to enlarge. Chart courtesy of StockCharts.com.
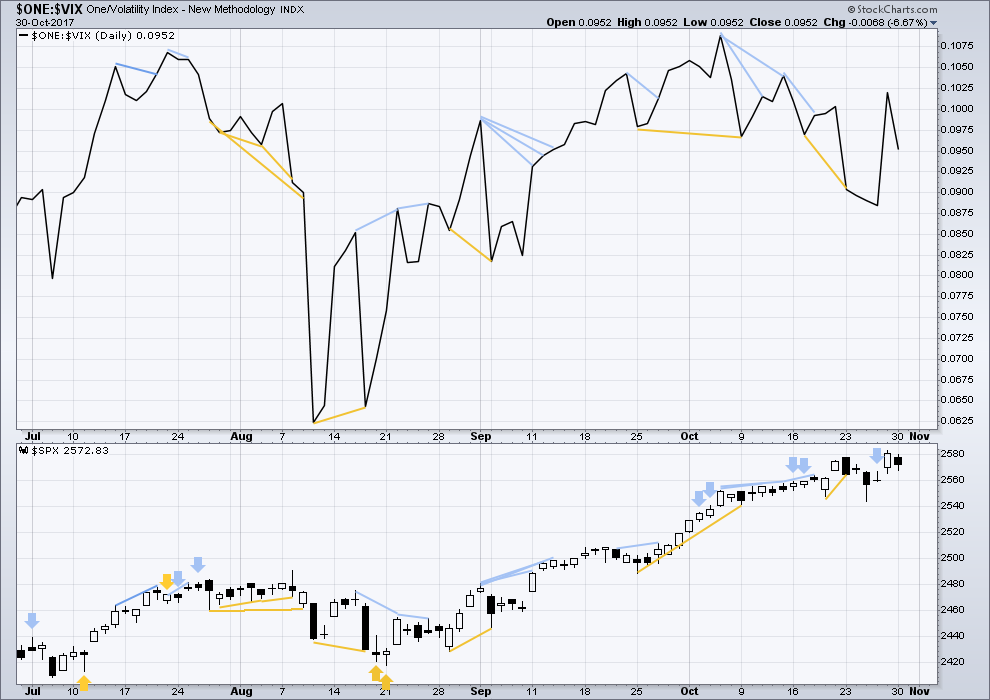
Normally, volatility should decline as price moves higher and increase as price moves lower. This means that normally inverted VIX should move in the same direction as price.
There is no short term divergence between price and inverted VIX. Mid term divergence is more often unreliable and will not be noted here nor given any weight.
BREADTH – AD LINE
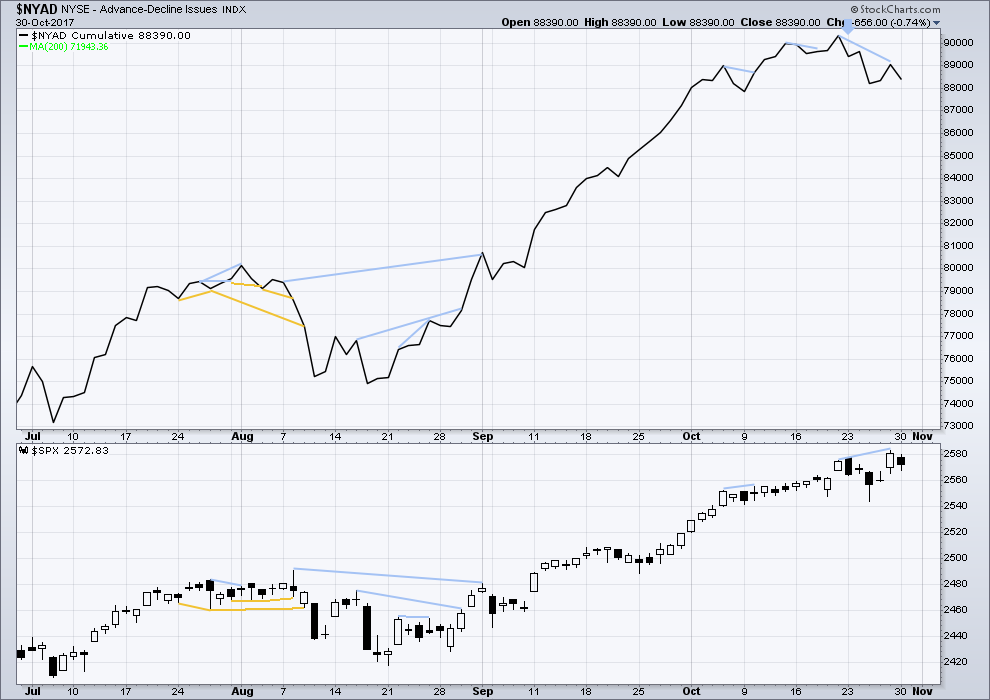
Click chart to enlarge. Chart courtesy of StockCharts.com.
With the last all time high for price, the AD line also made a new all time high. Up to the last high for price there was support from rising market breadth.
There is normally 4-6 months divergence between price and market breadth prior to a full fledged bear market. This has been so for all major bear markets within the last 90 odd years. With no longer term divergence yet at this point, any decline in price should be expected to be a pullback within an ongoing bull market and not necessarily the start of a bear market.
Short term bearish divergence noted on Friday between price and breadth has now been followed by one red daily candlestick. This divergence may now be resolved, or it may need another red daily candlestick to resolve it.
DOW THEORY
At the end of last week, DJIA and DJT have failed to make new all time highs. The S&P500 and Nasdaq have made new all time highs. DJIA and DJT have failed so far to confirm an ongoing bull market.
Failure to confirm an ongoing bull market should absolutely not be read as the end of a bull market. For that, Dow Theory would have to confirm new lows.
The following lows need to be exceeded for Dow Theory to confirm the end of the bull market and a change to a bear market:
DJIA: 17,883.56.
DJT: 7,029.41.
S&P500: 2,083.79.
Nasdaq: 5,034.41.
Charts showing each prior major swing low used for Dow Theory are here.
Published @ 07:29 p.m. EST.
The market is initiating 3 of 5 action per Lara’s analysis, the volatility is extraordinarily low which means the market is generally “just moving up” (pretty much true for 11 months now), enabling lower risk trades, ergo, the long side trading is excellent. I recommend taking aggressive advantage of this prime long trading market!! Lara’s analysis says “up”. That’s the critical information.
A couple of potential set ups now or soon: AAOI, SLCA, HAL. GS has popped and might be moving into a new significant bull phase (wait for a pullback!). XLF similar. IBB may have turned to the upside and has pulled back and may be well set up. I also think IYM is close to set up. It’s not about being right: it’s about making money.
Kevin,
I thought AAOI got hammered at last earnings due to weakness in the optical business. Have you read any new update that makes you think that it might have turned around.
No, I don’t pay much attention to fundamentals, sorry. Price action and volume for me.
AAOI should be in jail for the stunt they pulled in July.
“Pre-release” great earnings and have it spike to $100, only to guide terribly (that’s being nice) and the stock immediately dumps.
Only time I have ever seen a pre-release of earnings… I bet someone needed to sell.
Trader’s may want to look at B.
and ICE
ICE has had some huge call buying recently….
Yep… another snooze fest!
Wish I had some kind of auto pilot so I could do something more exciting and fulfilling with the rest of my life!
But Joseph, what could be more exciting and fulfilling than watching markets and hanging out here? 🙂
Good morning…!
We are in for another boring day with the banksters firmly in charge. The parabolic blow-off could continue awhile as that is the nature of these kinds of moves. We know HOW it will end but not WHEN.
One by-product of low volatility is low premium. Despite the move down in Trannies my puts are only slightly in the green. Price sits on a support shelf of 176.5 that needs to be broken for that trade to really pay off. Have a great day. Back tomorrow if futures get interesting…
Continuing to buy VIX under 10
Excuses, excuses Lara!
Only joking!
LOL
Here I am, home safe and sound.
Just in case anyone missed my note on last analysis, I’m flying home from Tonga tonight. We have to drive up north from Auckland so will arrive home very late. I may not be up in time tomorrow to give you an updated hourly chart before NY closes.
Thank you all for your patience.
Please do sleep in and give those noodle arms plenty of time to fully recover. We will try to keep lively till you return… 😉
FWIW, It is okay with me if you skip the update entirely. Taking a day off here and there is a ‘good thing’ especially when used for recreation and renewal. Be safe.
woo hoo,,sorry Charley
Star Kist!. Tell “em er…Charlie sent ya…!