
A break above the short term resistance line on the hourly chart in last analysis gave a strong bullish signal. The analysis then expected a new all time high.
Summary: Friday’s strong upwards day has support from volume and looks like a classic upwards breakout from a small consolidation. The target is at 2,616. Volume and On Balance Volume support this view.
If price makes a new low below 2,567.07 early next week, then a pullback should be expected to be underway. The target is at 2,533 to 2,527. Short term bearish divergence between price and the AD line supports this view.
Last monthly and weekly charts are here. Last historic analysis video is here.
MAIN ELLIOTT WAVE COUNT
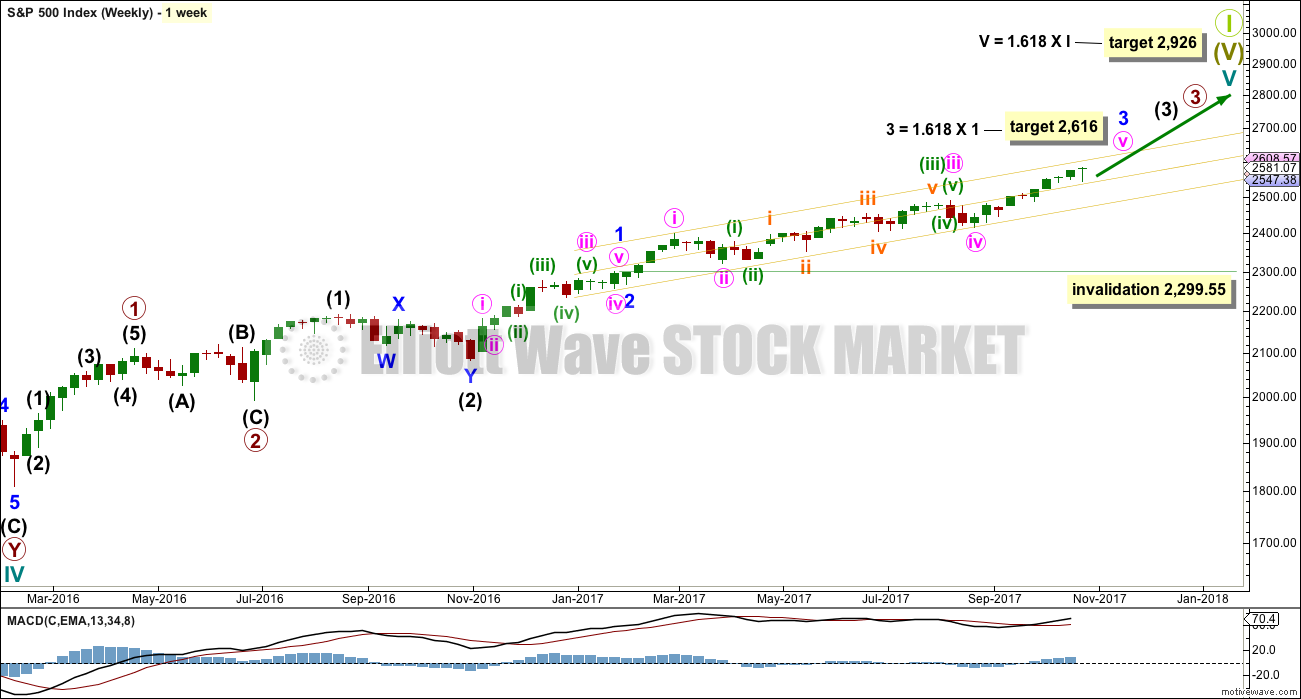
WEEKLY CHART
Click chart to enlarge.
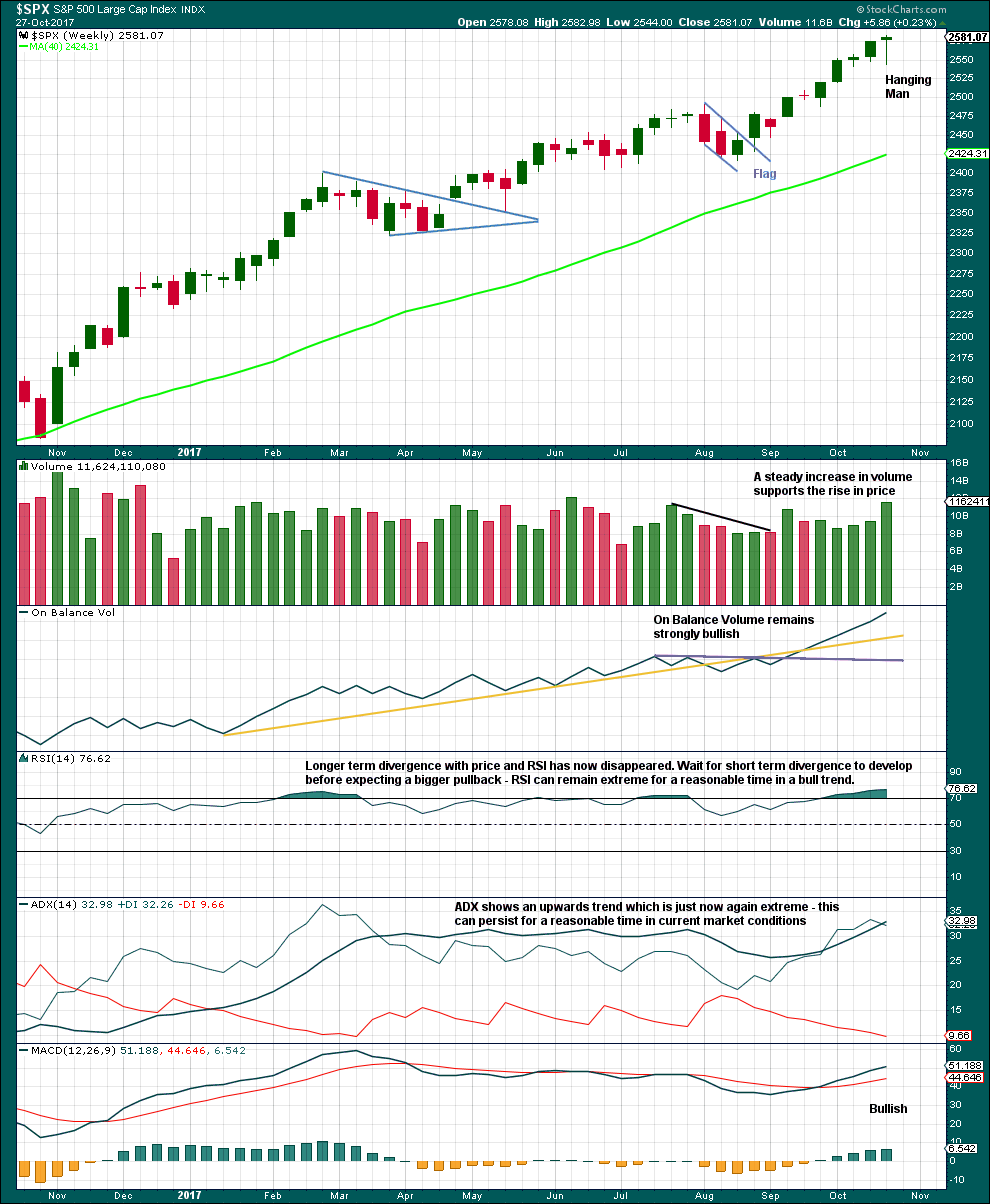
This wave count has strong support from another bullish signal from On Balance Volume at the weekly chart level. While classic analysis is still very bullish for the short term, there will be corrections along the way up. Indicators are extreme and there is considerable risk to the downside still.
As a Grand Super Cycle wave comes to an end, weakness may develop and persist for very long periods of time (up to three years is warned as possible by Lowry’s for the end of a bull market), so weakness in volume may be viewed in that larger context.
Within minute wave v, no second wave correction may move beyond the start of its first wave below 2,417.35.
The next reasonable correction should be for intermediate wave (4). When it arrives, it should last over two months in duration, and it may find support about the lower edge of this best fit channel. The correction may be relatively shallow, a choppy overlapping consolidation, at the weekly chart level.
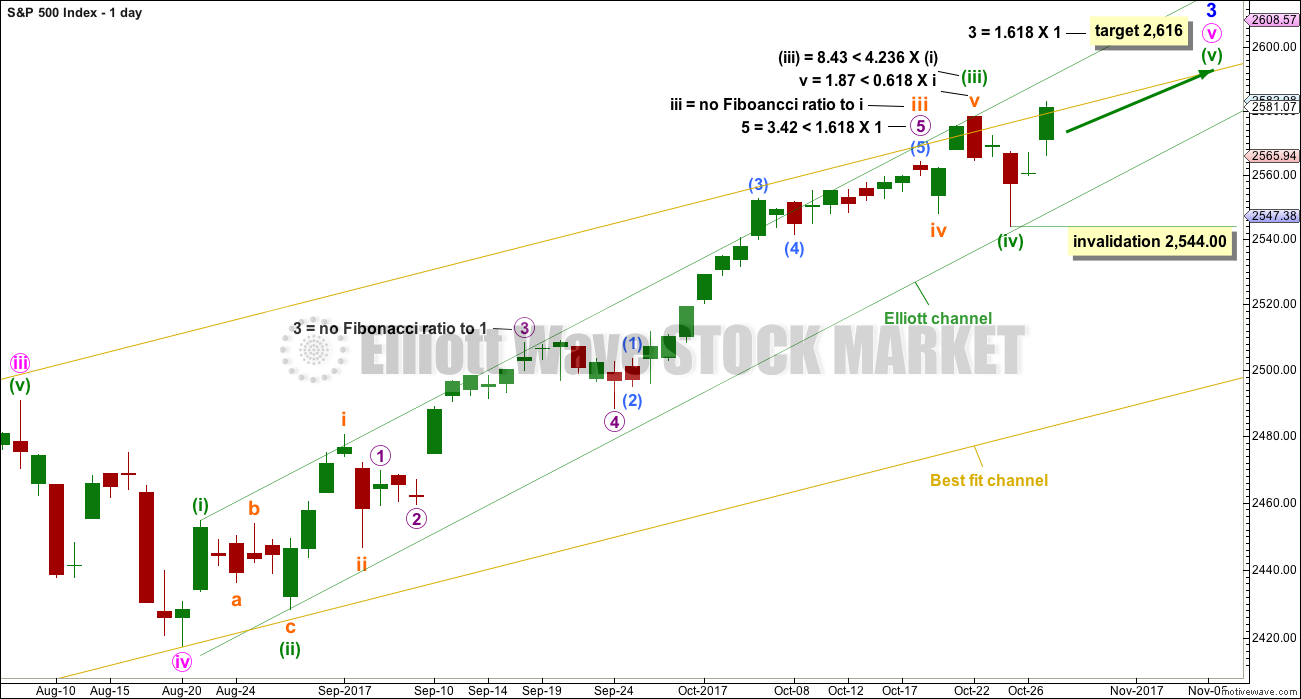
DAILY CHART
Click chart to enlarge.
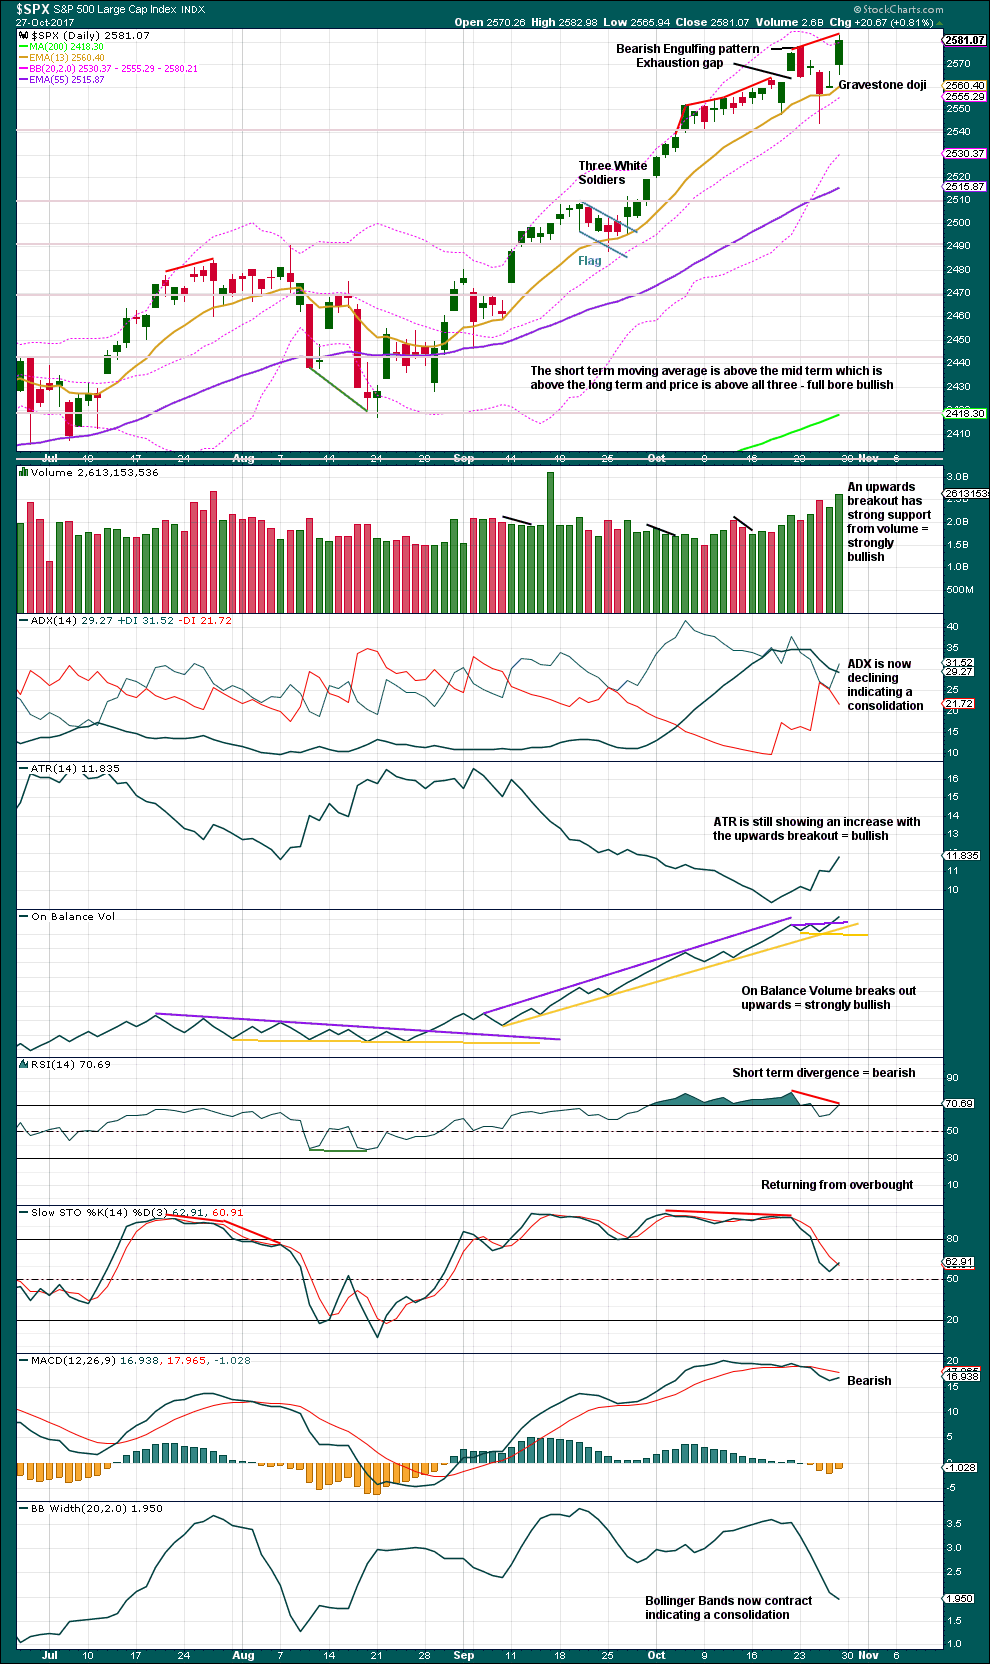
Because Friday was a very strong upwards day with support from volume and because On Balance Volume has given a bullish signal, the main wave count will now switch to fairly bullish. Friday looks like a classic upwards breakout from a small consolidation. A breakout is a bullish signal.
The target for minor wave 3 expects to see the most common Fibonacci ratio to minor wave 1.
Within minuette wave (v), no second wave correction may move beyond the start of the first wave below 2,544.00.
Fibonacci ratios for this main wave count are better than for the alternate. This increases the probability of this main wave count slightly.
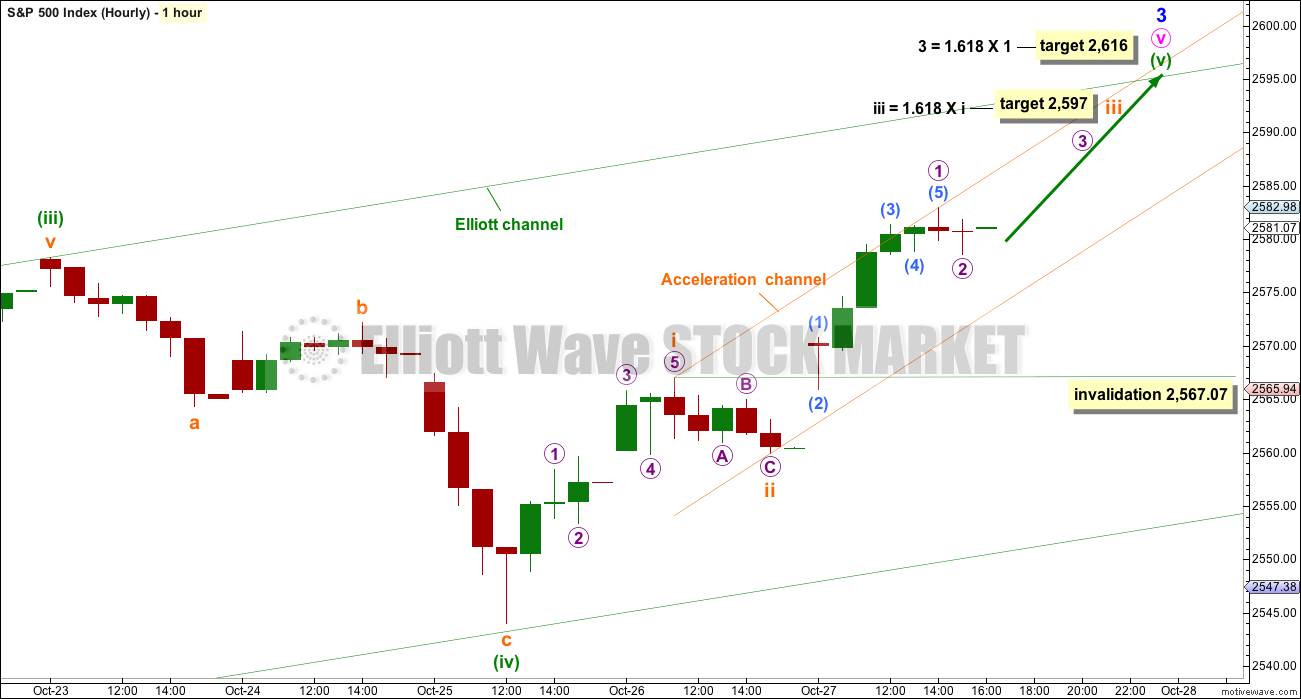
HOURLY CHART
Click chart to enlarge.
If minuette wave (v) is continuing, then it looks so far like it may be a more common impulse structure. The other structural possibility would be an ending diagonal, and that would be considered if price starts to move higher in overlapping three wave movements. For now the most likely structure will be considered.
Subminuette wave iii may not be over at Friday’s high because that would see it slightly shorter than subminuette wave i. If the higher target for minor wave 3 is correct, then subminuette wave iii may be a more common long extension.
While subminuette wave iii is incomplete, then price should remain within the orange acceleration channel. A breach of this channel by downwards movement would support the alternate wave count below.
When subminuette wave iii is complete, then subminuette wave iv may not move back down into subminuette wave i price territory below 2,567.07.
ALTERNATE WAVE COUNT
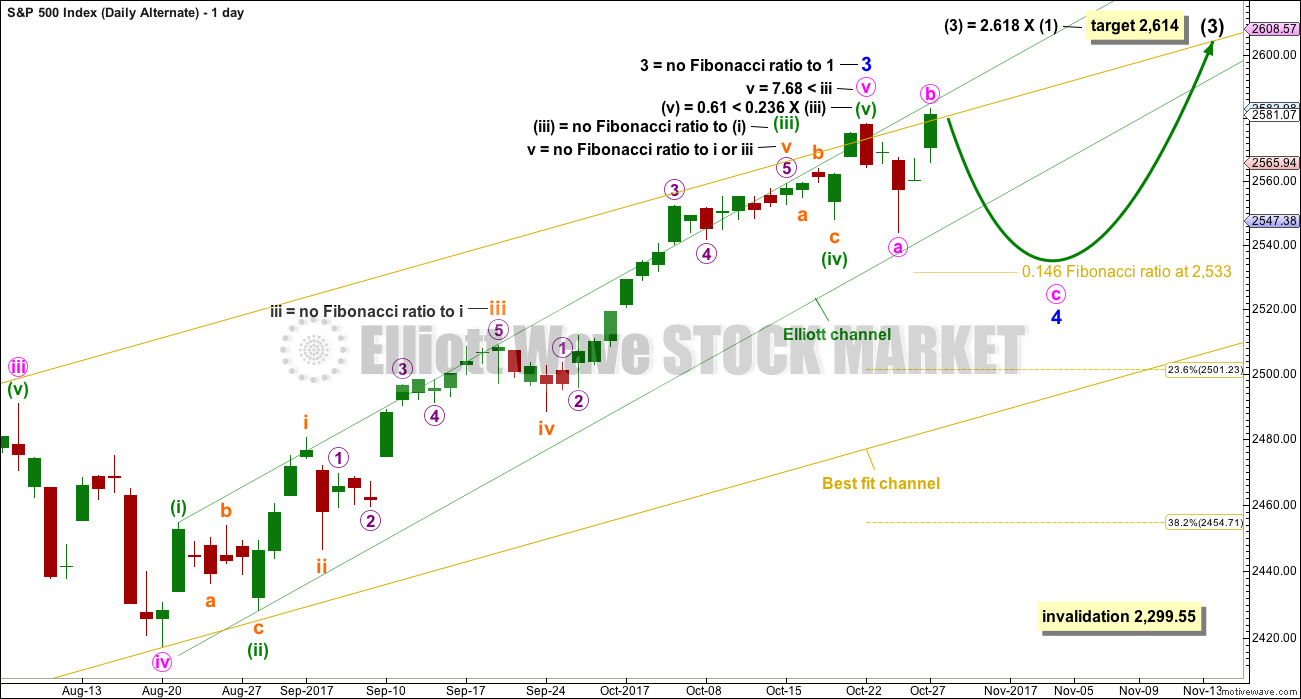
DAILY CHART
Click chart to enlarge.
This was up until today the main wave count. But it is switched to an alternate today due to the strong upwards breakout on Friday.
This alternate wave count will consider the possibility that minor wave 3 is complete and minor wave 4 is continuing as an expanded flat correction. The degree of labelling within minor wave 4 has been moved up one degree. If minute wave c continues over a few days, then minor wave 4 would have lasted about the right duration for a correction at minor degree, and would not be too disproportionate to minor wave 2 which lasted only three days.
A breach of the lower edge of the green Elliott channel about minute wave v would be expected when minute wave v is complete. If this happens, it would add substantial confidence that minute wave v is over and so minor wave 3 should be over.
Minor wave 4 may not move into minor wave 1 price territory below 2,299.55.
HOURLY CHART
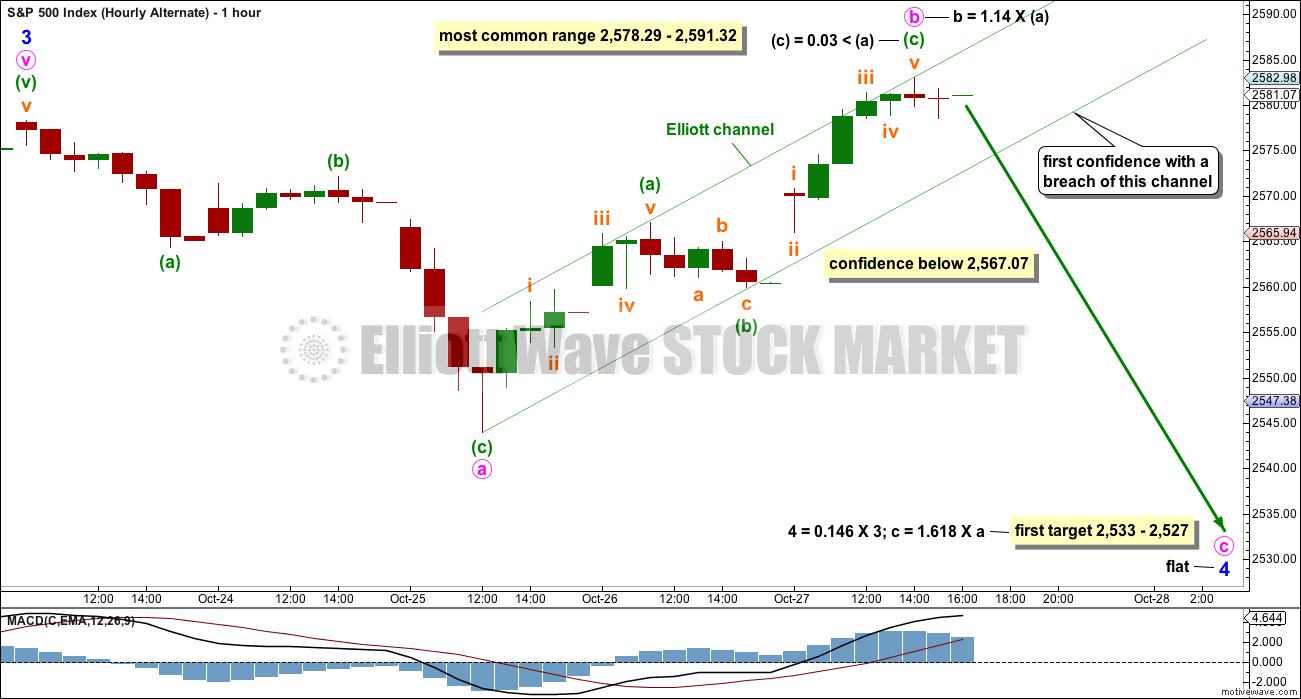
Click chart to enlarge.
Minute wave b is still within the most common range for a B wave within a flat correction. Because minute wave b is longer than 1.05 times the length of minute wave a, this may be an expanded flat correction, which is the most common type.
The appropriate Fibonacci ratio to apply to the target for minute wave c is 1.618. This gives a target close to the 0.146 Fibonacci ratio of minor wave 3.
So far minor wave 4 has lasted four days. If it continues for another four, it may end in a total Fibonacci eight sessions.
TECHNICAL ANALYSIS
WEEKLY CHART
Click chart to enlarge. Chart courtesy of StockCharts.com.
The Hanging Man candlestick requires bearish confirmation because the long lower wick has a strong bullish implication. Without that bearish confirmation, it should not yet be read as a reversal signal and only as a possibly developing reversal signal.
Overall, this chart is fairly bullish. Only extreme ADX sounds a warning, but most recently this has reached extreme at the weekly chart level and remained so for several weeks while price continued to rise. It may do so again.
DAILY CHART
Click chart to enlarge. Chart courtesy of StockCharts.com.
The Bearish Engulfing pattern may have indicated only a small short term pullback. Candlestick reversal patterns make no comment on how long the next trend may last.
Give the bullish signal from On Balance Volume reasonable weight.
VOLATILITY – INVERTED VIX CHART

Click chart to enlarge. Chart courtesy of StockCharts.com.
Normally, volatility should decline as price moves higher and increase as price moves lower. This means that normally inverted VIX should move in the same direction as price.
There is no short term divergence between price and inverted VIX. Mid term divergence is more often unreliable and will not be noted here nor given any weight.
BREADTH – AD LINE
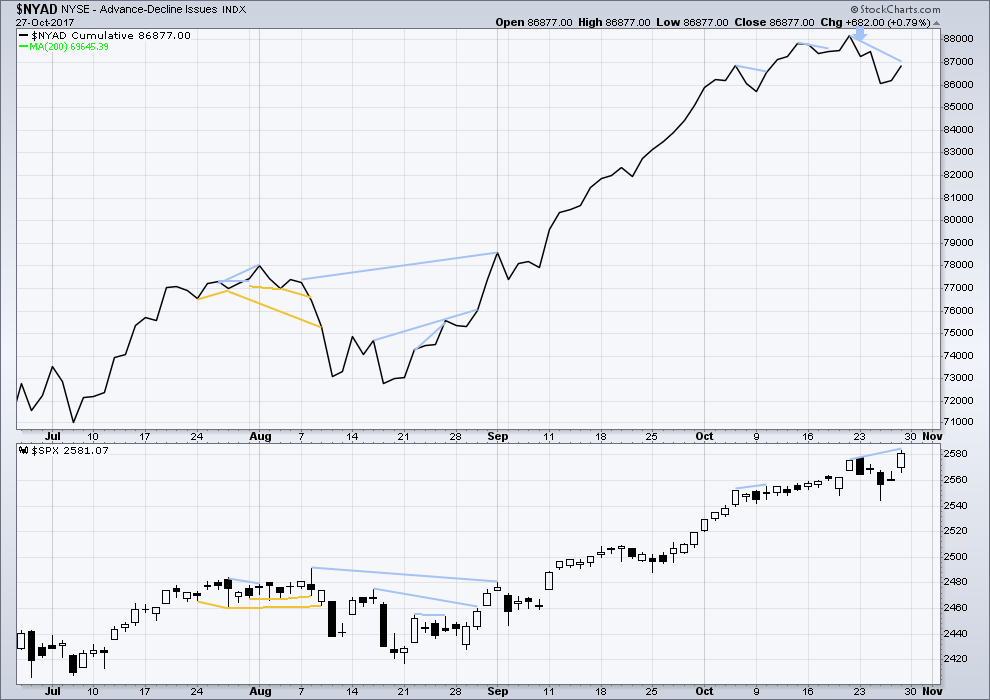
Click chart to enlarge. Chart courtesy of StockCharts.com.
With the last all time high for price, the AD line also made a new all time high. Up to the last high for price there was support from rising market breadth.
There is normally 4-6 months divergence between price and market breadth prior to a full fledged bear market. This has been so for all major bear markets within the last 90 odd years. With no longer term divergence yet at this point, any decline in price should be expected to be a pullback within an ongoing bull market and not necessarily the start of a bear market.
The new all time high for price on Friday did not have support from a rise in market breadth. This divergence is bearish and supports the alternate Elliott wave count.
Mid caps made a new all time high on Friday but small caps have not. This indicates some weakness in breadth developing over the last three weeks.
DOW THEORY
At the end of the week, DJIA and DJT have failed to make new all time highs. The S&P500 and Nasdaq have made new all time highs. DJIA and DJT have failed so far to confirm an ongoing bull market.
Failure to confirm an ongoing bull market should absolutely not be read as the end of a bull market. For that, Dow Theory would have to confirm new lows.
The following lows need to be exceeded for Dow Theory to confirm the end of the bull market and a change to a bear market:
DJIA: 17,883.56.
DJT: 7,029.41.
S&P500: 2,083.79.
Nasdaq: 5,034.41.
Charts showing each prior major swing low used for Dow Theory are here.
Published @ 05:28 p.m. EST on 28th October, 2017.
Flying home to New Zealand tonight. All back to normal tomorrow, but as it’s a very late arrival to Mangawhai I may not be up in time to give you a chart update in comments before the NY close.
We have the flight… then a drive up north.
Sorry everybody, I’ve had problems connecting to the internet this morning and so wasn’t able to put charts up for you prior to the NY close.
I’m going to label todays high a first wave and the new wave down a second wave. This moves the invalidation point lower a bit. This invalidation point for the idea that minor 3 is not over has this price point at 2,544 is the bottom line.
Set an audio alarm for DJI futures at 23,274.49
If we hit it you, know what to do!
I’m outta here. Have a great evening all! 🙂
The price action is proceeding nicely per Lara’s (very bullish) main charts. The pullback today was to almost exactly the 38% fibo of the overall iii wave up since last Wednesday. Now price is either in the 3 of the 3, or is launching the 5. If the latter, the target is <= 2491.50 to assure wave 3 isn't the shortest. Ultimately, that turn point will probably determine whether wave iii is extending (the turn will be higher than 2491.5) or not. It's a good time to be long: close by invalidation, and plenty of upside opportunity. The bullish EW count is being confirmed here. There is no legitimate EW nor technical reason I’m aware of to be bearish at this moment in time and price.
Absolutely fascinating how two people can look at the exact same data and draw diametrically opposed conclusions…
I guess that is what makes a market! 🙂
Yes, that is what makes a market!
Follow… RUT it has been leading for some time now.
It’s Lara’s EW analysis that is bullish, not me. I’m just reiterating what that analysis says re: the immediate action. If you choose to ignore that analysis, that’s fine.
All of the traditional technical signals are weaker than they have been since early September. Particularly MACD, breadth, and volatility.
I am not so sure how useful the EW counts will be for the end of this week… with it being flooded with major earnings. I think either FB & AAPL beat have huge beats like AMZN and GOOG, sending NDX up another 150 points and getting us to 2600. Or I think we could see a little bit longer consolidation, depending on how the tax legislation plays out.
Well, this is quite an interesting development indeed. RUT and DJT are once again dogging it. The news that the GOP is thinking of phasing in corporate tax cuts over 5 years is discouraging for this bull market. And the Manafort indictment will no doubt induce some trepidation.
I sold some of my long positions at the open to free up some cash. I am still quite bullish and long the market but depending on how earnings go this week (especially AAPL) we could see a bit of a downturn that persists.
NQ also in an impulse down off the highs. Looking closely at current wave up to see how it unfolds….
They are spending a prodigious amount of capital buying the indices. Looks to me like the law of diminishing returns in play….
VIX move above 10.89, UVXY above 16.64 confirms bull pennants….
Volatility bull flags a’flyin’…! 🙂
Don’t worry, they are still going to attempt to short it… he! he!
Anyone else see the freakish hail storm in Argentina?
It had vehicles buried in a matter of mere minutes!! Yikes!
I love EW…this iv pullback to very close to the top of the i provides a super high leverage entry point with good +EV!! I’ve also jumped on the finance pullback, GS and XLF.
Meanwhile, the daily chart for HAL shows a rather bullish turn to the upside, take a look.
Looks like an extended fifth in futures; we should see a big second wave up if that is the case…perfect bull trap??!!!
The example of how normal TA has been turned on its head continues to show up in impulsive five waves down that repeatedly fail to signal any significant trend change. I have stopped counting how many of these I have seen this year. We have another example unfolding in DJI futures…..
If it means anything this time, we should see a three wave bounce followed by a waterfall decline….. 🙂
VIX futures (VX) also facing stiff overhead resistance in the 13.00 area. A break above will also probably be an early signal of the VIX short unwind beginning….but not yet….
All eyes on the futures dog-fight. They have to get control of that plunge and I expect that they will buy in into the green before the end of the cash session. They had better…
A CLOSE of UVXY above the top boundary of that falling wedge would warrant caution for long trades imho…
Is somebody trying to screw with my entry on VIX calls??!
Hey!! That’s not fair!!! 🙂
This is one problem with orders that sit in the market, including contingent ones….
I’m starting to think subminuette wave iii (orange iii on main hourly) WAS over at Friday’s highs. Size in price and time of this pullback seems more “subminuette” size than down a timeframe. If so…the high of the 1 should hold, at 2566.87. I got a decent size position built in UPRO this morning, but this pullback took me out for a mighty loss of $17. I will try again in minutes, or maybe hours depending. This ABC down should finish around 2571.5 to 2573…
UVXY should get rejected at least one more time at the 16.00 pivot. I would love to see some cretin make a huge short commitment with a sharp spike down sometime today for a made to order entry. VIX futures hinting I may not get so lucky, let’s see….
Looks like you just saw that!
Yep! Let’s see if he bails or gets some help from his friends! 🙂
If we see a sharp pop off the top boundary around 15.70 it could signal a run for the hills…!
There should be another attempt to push VIX below ten; opening contingent order to snap up 10.00 strike calls if that happens…..
Looks to be turning prior to testing top of wedge but the banksters very predictable; I still think we are going to see a temporary spike down…
UVXY only popped to tag underside of its upper wedge boundary at the open and continues to fall. Buy signal will come with move, and CLOSE, above top wedge boundary around 16.00.
This morning’s gap down filled on furious buying….what next?
VIX has gapped above a bullish falling wedge of the last three days. Look for a move back to test top of wedge boundary around ten….
The futures candles are starting to really look ridiculous. It is confirming my thesis that that is where the real battle will be fought, and won or lost. I saw another report regarding earnings gains in S&P 500 since 2013. It was ALL due to stock buy-backs. No stock buybacks equals zero earnings growth! I knew the buybacks played a substantial part in the P/E numbers being reported by I had no idea that it was that significant. It is not sustainable, period….
One of the advice pundits out there pointed out (in a free video, not giving away proprietary info here!) that the 21 period monthly average true range percentage on the SPX is at a HISTORIC low, and that at that time scale, such lows tend to precede bear markets. We all know that; that essentially what has driven the VIX to historic lows. His analysis of prior major bears is that bear markets don’t start from the position of such a volatility low: first, there is a gradual increase in volatility (ATR% and VIX), for months, and only then does the market roll over and collapse. This is highly consistent with what we know of the EW structure it seems to me: price is now out of the 3 of 3 period that has driven volatility so low, and into the “unwinding” of multiple (and increasingly larger in price and time) 4’s and 5 ‘s. As that occurs, there should be a gradual increase in volatility, while price continues to hit new ATH’s. Eventually…it all rolls over. Just more evidence the market isn’t on the edge of melt-down, and another item to watch re: warning signals.
All other things being “normal”, yes. That scenario does not allow for any kind of unforeseen market exogenous shock. With market internals being as fragile as they are, that risk, ignored as it clearly is by market participants, nonetheless exists…
Shock is always a risk. Me, I’m getting back solidly in line with the long term trend, the intermediate term trend, and the short term trend, which are all up. Building long positions. Best way to maximize profit generation in this market; get broadly and smartly long. The bull market was significantly revalidated yet again on Friday, and it’s bullish until it isn’t.
Yep. I am keeping my long trades until VIX moves decisively above 12.50 and holds it on a closing basis…I am expecting to get high-jacked with that happening after hours but that is risk I am willing to take to stay with the current trend…
Kevin, I’m looking at the 21 period ATR on the monthly chart and I’m seeing it as low, but not as at historic lows.
What am I getting wrong here?
The market continues to “trade heavy”- falling under its own weight despite a marked absence of selling pressure, only to be bought back from declines by deep pockets stepping in to arrest the decline. This has been the pattern folk and will continue until it ends…
Looking to re-load VIX trade on any sub ten re-visit…
VIX previous up-trendline now acting as resistance. We have some more downside work to do prior to an upward break-out. That is quite OK. The longer this inflated ball is held under water the more explosive the break above the surface! 🙂
It is probably not going to happen during the cash session as the banksters appear to still be in firm control. The signal will come via the futures market…did I say that already??!! 😀
I have taken a look at the most promising AMZN leaps and June 2018 1000 strike puts are looking like a good fit. I expect AMZN to revisit the 600 area as there is some semblance of a return to sanity, either voluntarily or forcibly. Those puts are now trading for 40.75/41.90 and should easily be bid at better than 500 if my thesis of a significant AMZN correction is valid. Will load one half full bore probably by the close, and the second half on any break of lower wedge boundary on high volume. I suspect that event is not too far in the future….
Amazon doesn’t have the best trend line, not like Google.
This is the channel I have for AMZN. If this channel is breached to the downside then I’d expect it’s had a trend change.
I continue to be dumbstruck by the price action in AMZN. Taking a bit deeper look into the numbers we would humbly note two striking numbers for third quarter reporting.
Operating Income: – 50% (includes huge CIA contract)
Net Revenue: – 72%
No worries, what’s not to like about being the world”s richest man? Now trading at 280X earnings!!!
AMZN is going to make a few other folk a LOT of moolah…. 😉
Good Monday morning!. Looks like VIX 10.00 strike calls will all be nicely in the green at the open. If you grabbed some take the money and run…rinse & repeat; they will no doubt pile on once again to try and send it back below 10. The level that puts the squeeze on the shorts remains I think at a close above 15. I am expecting that to happen by way of a massive after hours gap…for obvious reasons… 😉
Well, well, well …….. 2926 SPX projected target for this bull market. Nobody can believe it. When we crossed 2200 some time ago and you projected 2500+, that was difficult to believe as well. But now, 2926!
I for one believe. Time to start deploying my mid and long term funds. I have decided on a graduated or cumulative approach reaching full investment near the end of Intermediate 4. That is the plan anyway. Short term funds will await the end of Minor 4 before being deployed.
Thank you Lara for your excellent and thorough analysis and commentary. I hope you had a wonderful time surfing.
That sounds like a good plan Rodney, considering how bullish volume looks.
Unfortunately the surf this week in Tonga has been pretty poor. We’ve still surfed every day except today. The waves have been head high at best, super steep and very fast with most just closing out. When you do get a reasonable one you’re speeding along just over the reef with only about 1ft of water beneath you. Quite the thrill, and somewhat dangerous on my 9’6″ longboard.
I’ve had a few wipeouts but no injuries. Cesar says I’m doing well 🙂
No barrels for me unfortunately. A couple of the guys got barrels earlier in the week, but now it’s a cross shore chop and they’re hard to come by.
Still, the food is great, the warmth is nice, and we’re enjoying the relaxation of Tonga.
Big Tuna here…filling in for my good friend Wabbit who is very busy!
Any questions??!!
Or does somebody wanna piece of me…???
well look whos here,, Charley Tuna… sorry Charley,, you cant be Chicken of the Sea
Hey Big Tuna Charlie. Nice to see you. You put on a bit of weight since we last met. Bigger and Better.
Keep that pesky wabbit at bay. No one here likes him anyway.
Big Tuna here…filling in for my good friend Wabbit….Any Questions?!
Or does somebody wanna piece of me…??