
A Gravestone doji comes just three days after a Bearish Engulfing candlestick pattern. These two patterns together are giving a strong signal.
Summary: The fourth wave may be relatively brief and shallow as minor wave 4, or it may be a much deeper multi week pullback or consolidation as intermediate wave (4). At this stage, it is still impossible to tell which scenario may play out.
At this stage, classic technical analysis is looking fairly bearish. For the short term, use the lilac trend line on the first hourly chart; expect an increase in downwards momentum to a new low while price remains below that line. If price breaks above that line, then the main hourly wave count would increase in probability and a new all time high shortly thereafter would be a possibility.
Last monthly and weekly charts are here. Last historic analysis video is here.
MAIN ELLIOTT WAVE COUNT
WEEKLY CHART
Click chart to enlarge.
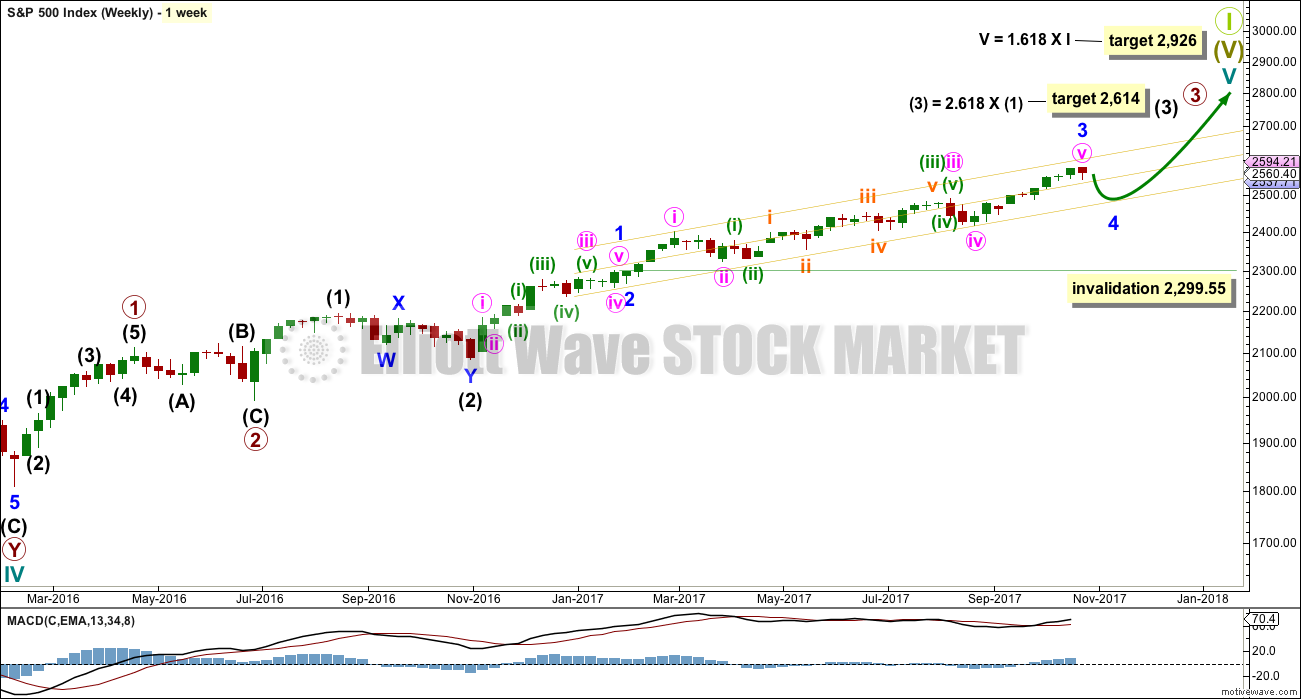
This wave count has strong support from another bullish signal from On Balance Volume at the weekly chart level. While classic analysis is still very bullish for the short term, there will be corrections along the way up. Indicators are extreme and there is considerable risk to the downside still.
As a Grand Super Cycle wave comes to an end, weakness may develop and persist for very long periods of time (up to three years is warned as possible by Lowry’s for the end of a bull market), so weakness in volume may be viewed in that larger context.
Within minute wave v, no second wave correction may move beyond the start of its first wave below 2,417.35.
The next reasonable correction should be for intermediate wave (4). When it arrives, it should last over two months in duration, and it may find support about the lower edge of this best fit channel. The correction may be relatively shallow, a choppy overlapping consolidation, at the weekly chart level.
DAILY CHART
Click chart to enlarge.
To see details of the whole of primary wave 3 so far see the analysis here.
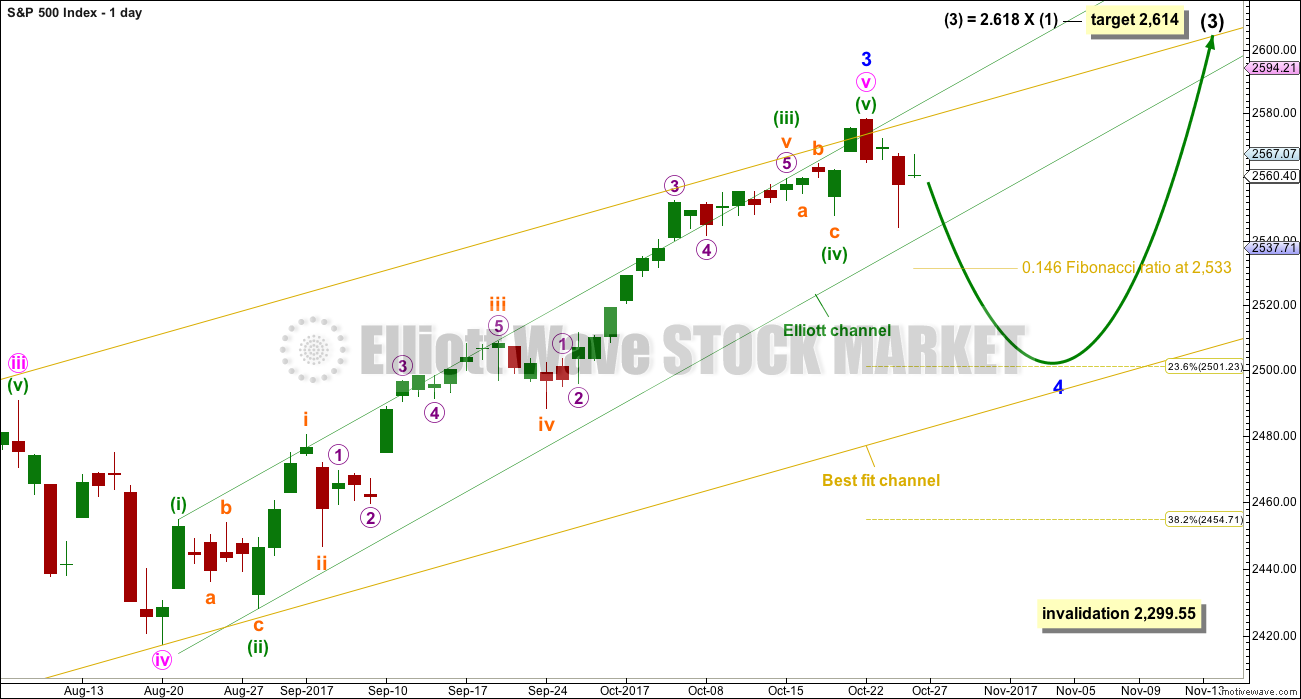
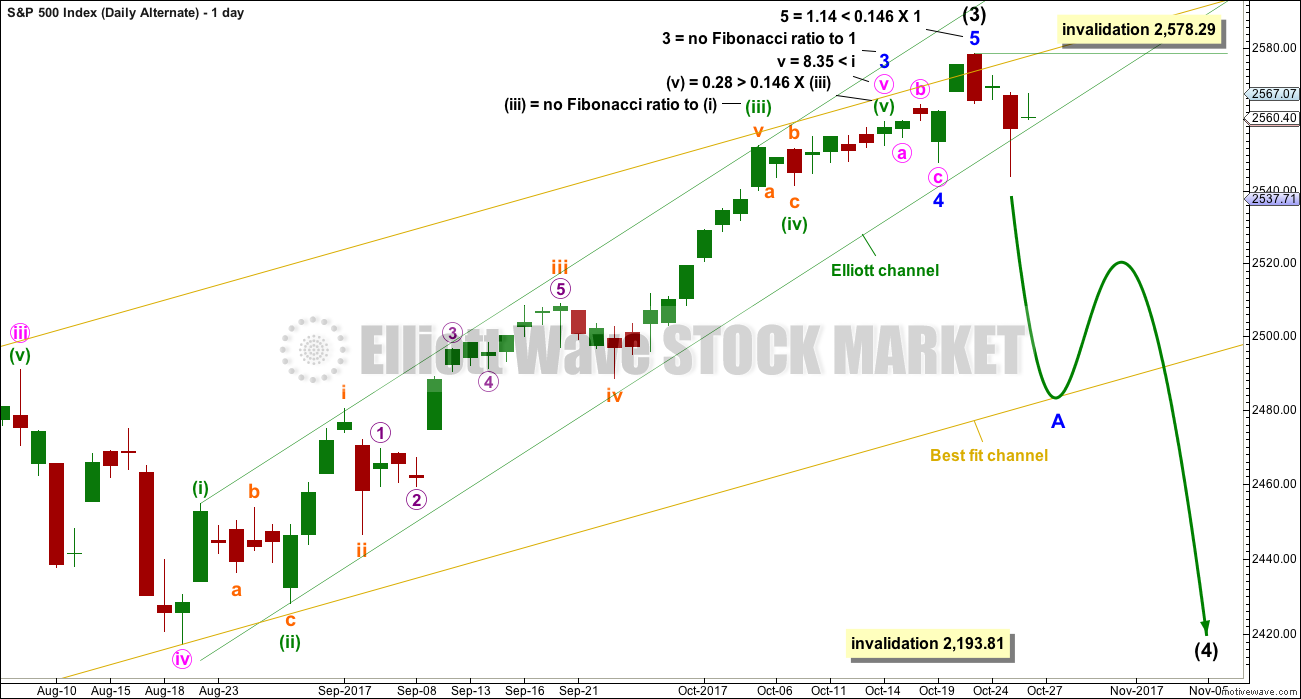
Minor wave 3 may be complete and may not exhibit a Fibonacci ratio to minor wave 1.
Minor wave 2 was very brief at only three days. It is possible for good proportion that minor wave 4 could be as brief.
The 0.146 and 0.236 Fibonacci ratios should be first and second targets for minor wave 4 to end.
Minor wave 4 should break down below the green channel containing minuette wave (v). A breach of this channel would add substantial confidence in this wave count. Note that the green channels are drawn differently on the daily charts. While price is breaking below the channel on the alternate chart, it has not yet done so here on this main daily chart.
If minor wave 4 were to end within the price territory of the fourth wave of one lesser degree, then a target range would be from 2,490.87 to 2,417.35. The 0.382 Fibonacci ratio of minor wave 3 is within this range at 2,455.
FIRST HOURLY CHART
Click chart to enlarge.
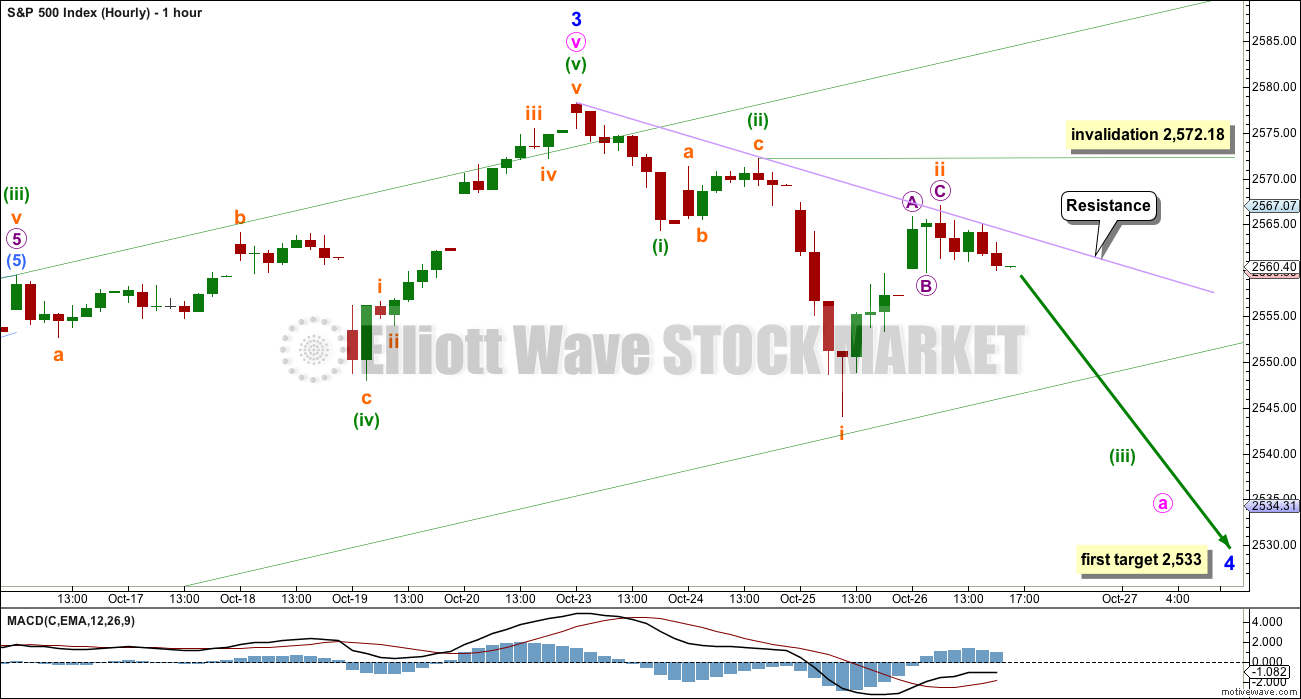
If minor wave 4 is to be more long lasting than minor wave 2, and so to be a more normal duration for a correction at minor degree, then a five down on the hourly chart may be still unfolding.
Two overlapping first and second waves may be complete today. This first hourly chart has some support today from the Gravestone doji on the daily chart.
This first hourly wave count suggests a strong increase in downwards momentum tomorrow and for another one to three sessions thereafter.
While price continues to find resistance at the lilac trend line, this first wave count should be understood to be very likely. If price moves above that trend line, then the second hourly chart below would increase in probability.
Subminuette wave ii may not move beyond the start of subminuette wave i above 2,572.18.
SECOND HOURLY CHART
Click chart to enlarge.
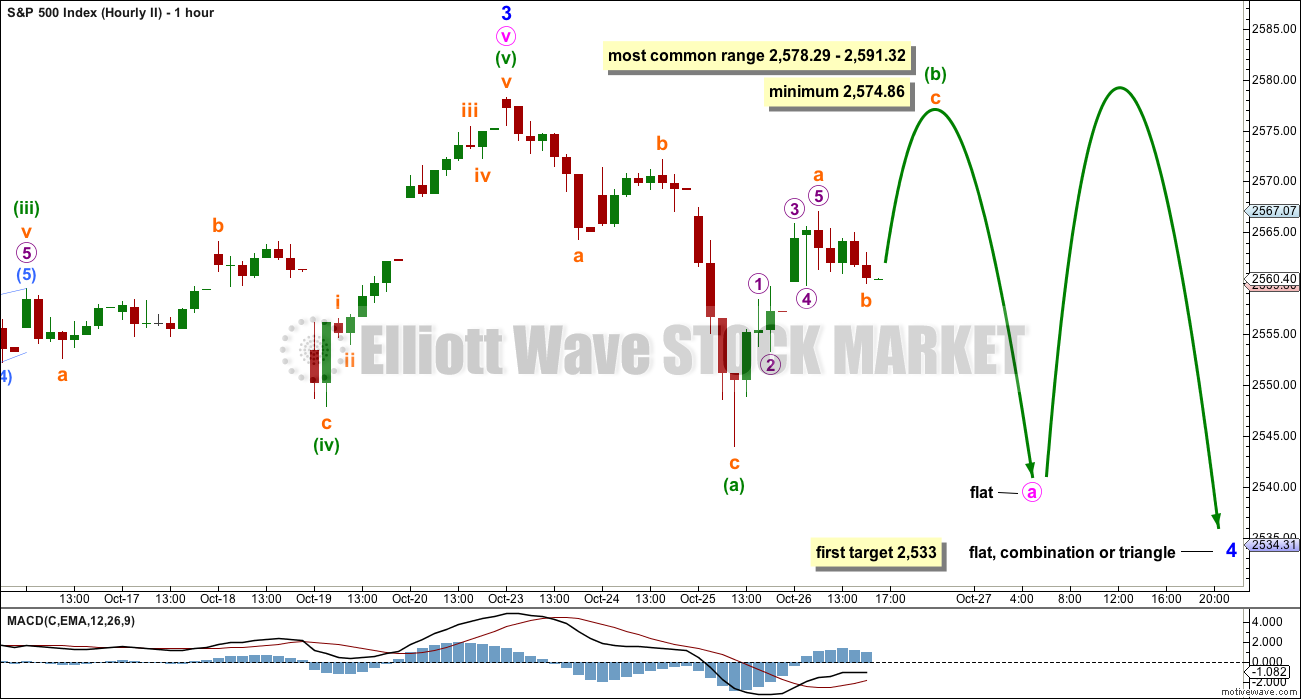
For the main wave count there are more possibilities open at this stage for minor wave 4. Because minor wave 2 only lasted three days, it is also possible that minor wave 4 could be relatively brief.
Minor wave 2 was a zigzag, so minor wave 4 would most likely be a flat, combination or triangle. Within all of those possible structures, minute wave a must subdivide as a three.
Here, minute wave a may be unfolding as a flat correction, which is classified as a three. Within a flat correction, minuette wave (a) must be a three; this may be a complete zigzag. Minuette wave (b) must then retrace a minimum 0.9 length of minuette wave (a) and make another new all time high. The most common range is given on the chart.
This wave count attempts to visually illustrate how minor wave 4 could unfold as a choppy overlapping sideways consolidation, with strong swings from support to resistance and back again, which may include overshoots of support and resistance before price returns into the consolidation zone. This may continue for a few days.
ALTERNATE WAVE COUNT
DAILY CHART
Click chart to enlarge.
It is also possible that both minor waves 3 and 4 could be over.
My initial judgement was to label this as an alternate because of the brevity and shallowness of minor wave 4. This does not look right. However, there is still good alternation and good proportion with minor wave 2, which lasted only three days and was a zigzag. Here, minor wave 4 may have also lasted only three days and may have been a flat correction.
Intermediate wave (3) could be over. A deep multi week correction for intermediate wave (4) may have arrived.
Intermediate wave (2) lasted eleven weeks and was a relatively deep 0.54 double zigzag. Intermediate wave (4) may be a shallow flat, triangle or combination to exhibit alternation. To exhibit good proportion, it may last about eleven weeks or possibly a Fibonacci eight or thirteen.
A new low below 2,547.92 could not be a second wave correction within minor wave 5, so at that stage minor wave 5 must be over. This would add reasonable confidence that a correction has arrived.
HOURLY CHART
Click chart to enlarge.
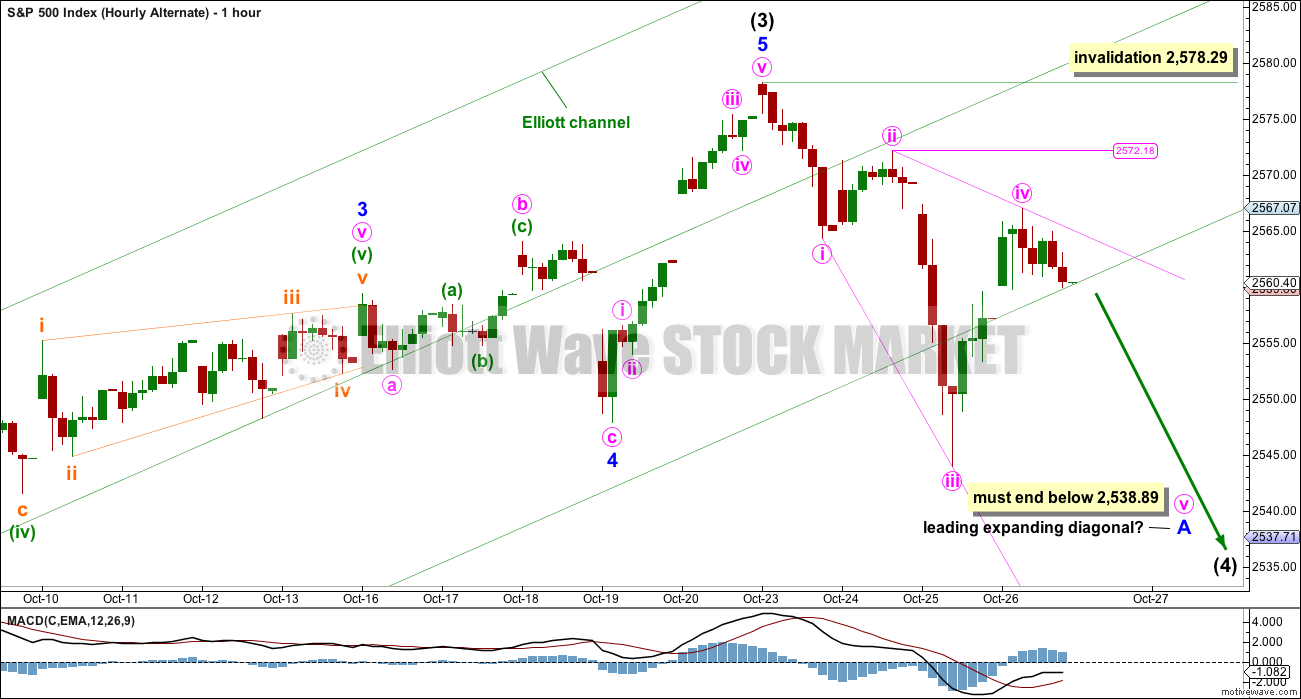
A new trend down at intermediate degree must begin with a clear five down on the hourly chart. That would be incomplete.
If a five down is unfolding, then it may be as an impulse with two overlapping first and second waves; the first hourly chart for the main wave count illustrates this idea. It works in the same way for this alternate wave count.
The other structural option for minor wave A would be as a leading diagonal; here, it may be expanding.
The degree of labelling within the diagonal may need to be moved down one degree for this wave count. It may be only minute wave i of minor wave A that is completing.
Within the diagonal, minute wave iv may not move beyond the end of minute wave ii above 2,572.18.
If price makes a new high above 2,572.18, then it may be possible that the zigzag downwards was minute wave i within a leading diagonal for minor wave A. If that idea is correct, then minute wave ii within a diagonal may not move beyond the start of minute wave i above 2,578.29. That is the final invalidation point for any alternate idea for this wave count at this stage.
TECHNICAL ANALYSIS
WEEKLY CHART
Click chart to enlarge. Chart courtesy of StockCharts.com.
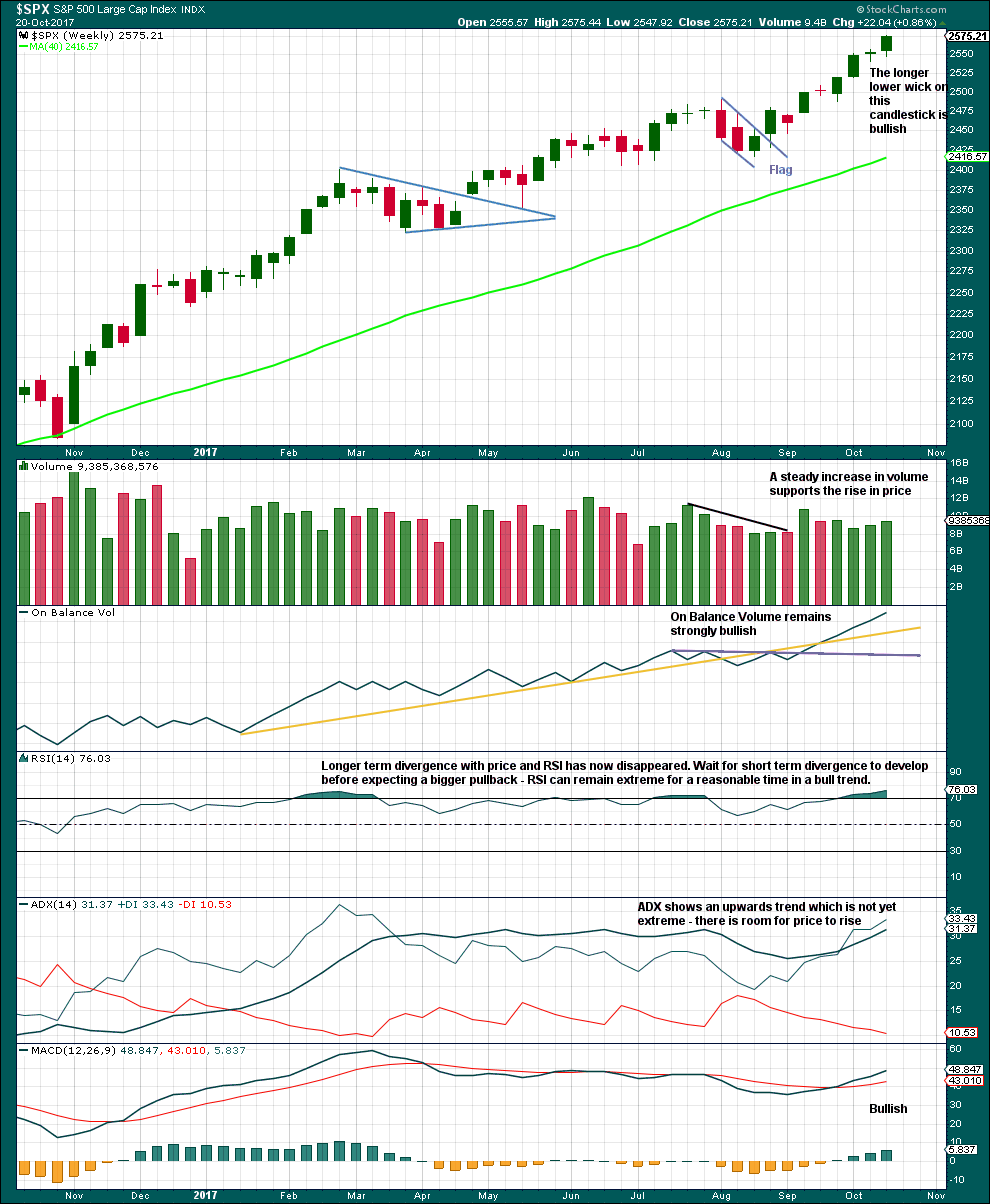
At the weekly chart level, the technicals last week look even more bullish than the week prior.
Longer term divergence with price and RSI does not appear to be very reliable; it has again disappeared. Like divergence with VIX and the AD line, divergence with price and RSI appears to be more reliable for the short term when it is clear and strong.
This chart is fully bullish. There is nothing bearish yet here.
DAILY CHART
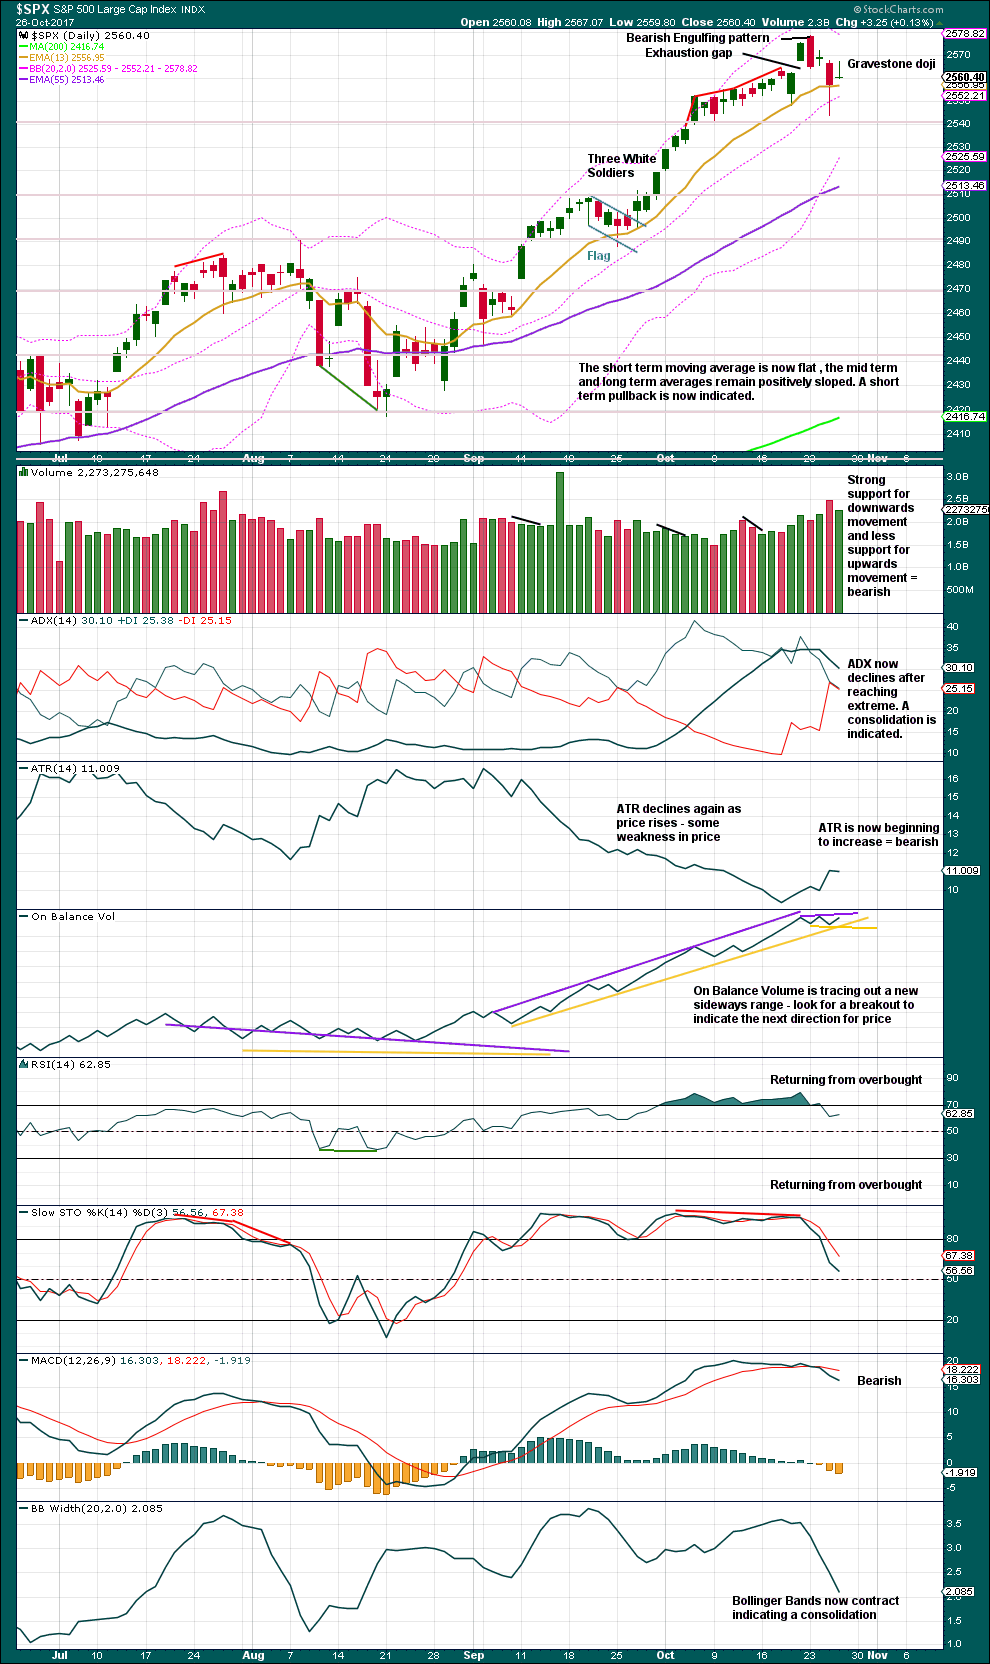
Click chart to enlarge. Chart courtesy of StockCharts.com.
A Bearish Engulfing candlestick pattern and now a Gravestone doji close to the last high are together giving a very bearish signal. This offers strong support to the Elliott wave counts, and more support to the alternate than the main wave count.
On Balance Volume will be watched very carefully over the next few days.
VOLATILITY – INVERTED VIX CHART
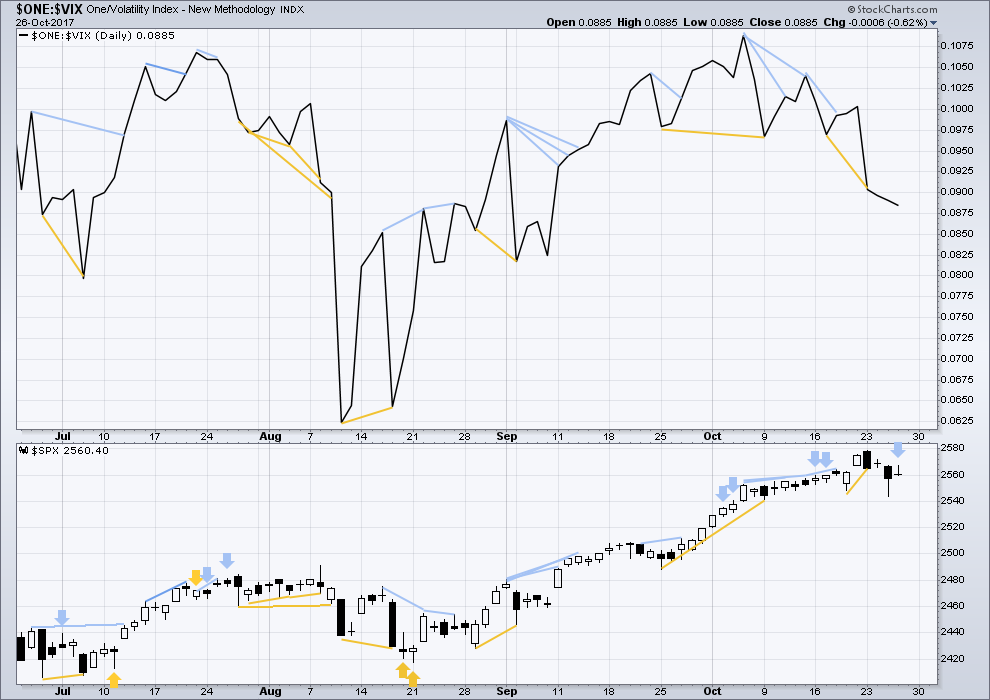
Click chart to enlarge. Chart courtesy of StockCharts.com.
Normally, volatility should decline as price moves higher and increase as price moves lower. This means that normally inverted VIX should move in the same direction as price.
Price moved higher today with a higher high and a higher low, but inverted VIX declined indicating an increase in volatility today. The rise in price did not come with a normal decline in volatility, so this divergence is interpreted today as bearish. It indicates weakness within price.
BREADTH – AD LINE
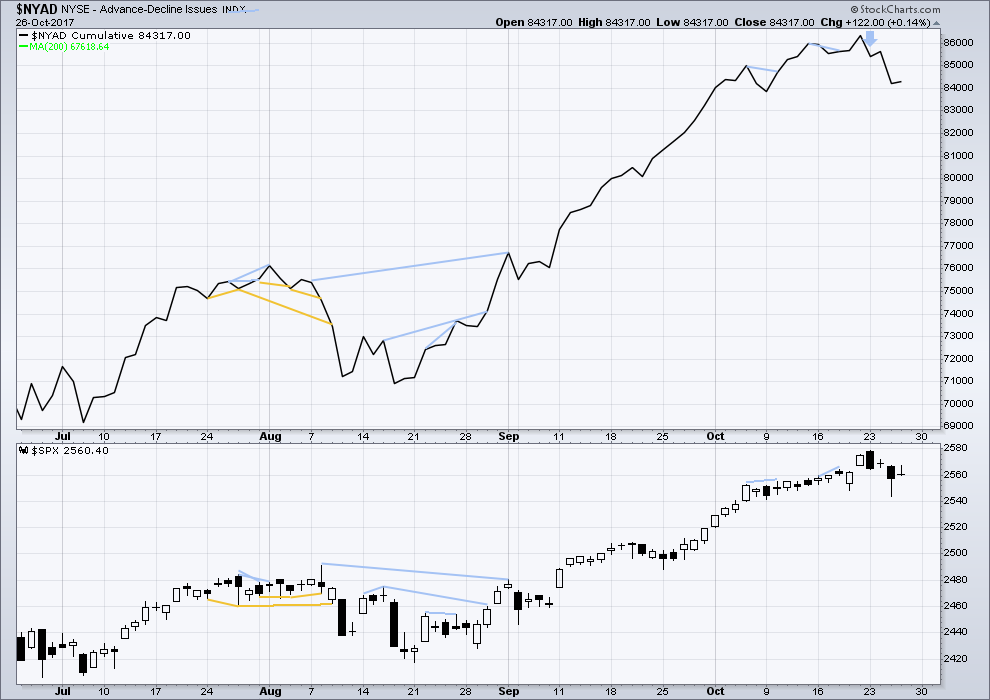
Click chart to enlarge. Chart courtesy of StockCharts.com.
With the last all time high for price, the AD line also made a new all time high. Up to the last high for price there was support from rising market breadth.
There is normally 4-6 months divergence between price and market breadth prior to a full fledged bear market. This has been so for all major bear markets within the last 90 odd years. With no divergence yet at this point, any decline in price should be expected to be a pullback within an ongoing bull market and not necessarily the start of a bear market.
There is no new divergence today between price and market breadth. The small rise in price today had support from a small rise in breadth.
DOW THEORY
At the end of last week, only the Dow Jones Transportation Average has not made new all time highs. The continuation of the bull market has not this week been confirmed. However, the Dow Jones Transportation Average is not far off its last all time high. If it does make a new all time high, then this analysis will be totally and fully bullish.
Failure to confirm an ongoing bull market should absolutely not be read as the end of a bull market. For that, Dow Theory would have to confirm new lows.
The following lows need to be exceeded for Dow Theory to confirm the end of the bull market and a change to a bear market:
DJIA: 17,883.56.
DJT: 7,029.41.
S&P500: 2,083.79.
Nasdaq: 5,034.41.
Charts showing each prior major swing low used for Dow Theory are here.
Published @ 05:45 p.m. EST.
For those who were all Fooled/Brainwashed by the Media along with the queen herself & their minions, here is a article that connects all the dots… All this truth will be out in public very soon!
http://www.zerohedge.com/news/2017-10-27/bombshell-hillary-clinton-dnc-colluded-russia-attempt-steal-election-donald-trump
Possibly. I personally doubt it.
Somebody once told me that if you want to be a successful trader you have to properly recognize the trend and trade with it.
However, if you want to be a great trader you have to recognize market extremes and know how to take advantage.
Some folk on the forum have expressed frustration at my talking about being prepared but that’s quite allright. I trust some of you will pay attention to what I am saying and use it to your advantage in limiting risk. I have been attempting to share out of my own trading experience and the fact is that I have never successfully made a 10X trade other than when market volatility was at an overbought or oversold extreme.
What has been absolutely remarkable about the market volatility this past year it that it has remained at extreme oversold levels for longer than I have ever witnessed…EVER!
I posted a few charts that highlights this and an article that explains this situation.
Does the current ramp higher makes this situation any less extreme? The answer is obvious. When I look at the particular stocks in the indices responsible for the current move higher, I see something quite startling. The lion’s share of the move is focused extremely narrowly in a very few stocks. That situation is extreme in the Nasdaq and quite pronounced in the S&P 500. A large percentage of stocks in the latter DECLINED while the index was up almost 1% on Friday. I have not checked but I would not be at all surprised if we did not have another HO warning on Friday. I am not saying that the trend is not up, for in the short term it clearly has been, but I am saying that market internals are sending a very stark warning.
Some of you probably laugh at Chris and I when we buy vol in the face of these furious rallies. There is a method behind the apparent madness…. I expect the move of VIX below ten once again to be short lived and I am frankly stunned with market breadth sending the signals it is currently, that you can buy VIX for less that ten handles….
Hope you are enjoying your weekend with family and friends!
Hey Verne, I for one appreciate your comments and insights. I may never trade the way you do, but your “color commentary” is helpful.
I narrowly escaped a big loss yesterday. Had a day-only STB SQQQ that was just a couple pennies higher than the price at the closing bell on Thursday. Yikes! That was close!!!
My takeaway: NDX is too dependent on a few high-profile stocks to hold overnight during earnings season. Whew!
Yep. Ya gotta be very nimble on the short side in this market as I learned a while back. I enter sell targets on my short trades as soon as I open them and let me long hedges run. Seems to be working OK. 😉
Verne,
No complains from my side. All info shared is helping me become a better trader. Anyway I can get you email address? Once you ack. I will seek the info from Lara.
No problem. Lara will send it. 🙂
Much Appreciated!
I’ve got a feeling Intermediate 4 is done and we are now in what will be the final 5th up.
BTW, I forgot to ask. Was that a Yellow-fin Tuna? Sure made me hungry for fresh sushi… 🙂
Yes, it was indeed 🙂
Yummy! 🙂
Before I read comments below here’s your updated hourly chart.
The new ATH tells us that this correction is either over already (a possibility I’ll have to consider and will do so when StockCharts give volume data for today)
OR
The second hourly chart is correct and minor 4 is continuing as an expanded flat correction. At this time this is my preferred option considering overbought conditions and divergence.
How about this Daily labeling: (i) = (v)
Except that (v) is currently a 3 🙁
That’s okay. It can be seen as an incomplete 5.
This is going to be my alternate idea. Just not sure what degree to label it ATM…
Here’s another thought. The waves the last few days all seem to me to be big three wave moves. Could we be tracing out an ED?
Verne, going back in the VIX and a touch of UVXY. I can’t help the 9 handle. Just baby long for now, cause I bet I’ll have to leg in, which I’m fine with.
Me too. Keeping my rule intact of buying under ten. I have a bid of 1.25 for the Nov 8 10.00 strikes. I was waiting until just before the close but it looks like it has already put in a bottom so I may have to move the bid up a bit… 🙂
VIX STILL has not made a new 52 week low, new ATHs not withstanding.
Adding another 25 VIX 10.50 strikes at 1.30 for November 15.
Have a great weekend everyone!
Here’s how I see it. We had an abc down to complete a minute 4, after the ATH a few days ago completed a minute 3. Price is now in a minute 5, with targets shown. Inside the minute 5, price is probably still in the minuette 4. A minuette 5 will come next, and once the minute 4 is over, THEN it’s time for the much anticipated minor 3. That’s my current take, anyway.
I’m looking at the hourly chart all squished up Verne and I’m not seeing it. The new low below 2,547.92 on the 25th makes it difficult to fit a diagonal in there.
Thanks! It must have been “pigment” of my imagination! 🙂
Bought at 1.35 on move back above ten. Small contingent of 25 contracts for now…
I just took a quick look at the Nasdaq chart going back five years and there is not a single instance of an upper B band penetration such as we are seeing today. All the tags of the upper B band that I could see were followed by normal corrective moves down of 3 -5% minimum.
A few weeks ago Lara mentioned something similar about an extremity she saw in, I think it was the A/D line or some other one of the indicators she used that previously led to significant corrections. This time that extreme reading did not, at least not so far….
What bollinger band period do you use? I use a 21 period BB. Looking at weekly charts, this week is slightly penetrating through the upper band. I see larger penetrations back in Jan of ’17, following by a steady and strong diet of upward pushing weekly bars. When I go back to monthly, I see periods in time where for several months in a row, the bars were pushing slightly above the upper BB. Currently, for the last 4 months, the upper monthly BB has moved up and away, and price is well below that upper BB. On the daily bar level, yes price today pushed well past the top of the BB. However, the BB’s were quite narrow due to the recent pullback, and the more lateral movement of NDX through the summer. So I see this break up as exactly that, a break up, rather than any sort of climactic move to be followed right away by a strong pullback (though a moderate one wouldn’t be shocking). I don’t see any historical record that indicates an immediate strong reveral is expected or required here. Rather, I see a strong indication that the indecision of the last 3 months in NDX is over, and the market is initiating (broadly speaking) another bull run. We’ll see what next week brings.
My post was unclear, sorry about that. I forgot to include I was looking at upper B band penetration in conjunction with momentum diversion, my bad!
The band I use is the 20 and 2 so it should be quite similar..
I use a 20, 2 BB period. According to the daily chart, Verne is right. There is no time in the last 20 years where we had this deep of penetration of the upper BB that didn’t immediately see a quick pullback. On the other hand, most of those pullbacks were followed by swift follow-throughs.
This market is unlike any other in the last 20 years though so I am not expecting a pullback. If there is one, I will be using cash to buy and add to my 100% long positions 🙂
Hourly II: today’s price stopped rising exactly at a=c. Let’s see if that holds.
Does anyone know why from an EW perspective the corrective wave is permitted to exceed the high of minor three, but not intermediate three?
I think I remember Laura saying that an intermediate wave down should begin with a five wave structure but I was not sure if that was a rule or just a guideline. It would imply that a corrective fourth wave at intermediate degree cannot begin with an expanded flat.
My understanding has always been that EW is perfectly symmetrical and fractal, which is to say, there are no special rules at different levels of timeframe. I would guess that any such are experientially based heuristics added by the practitioner.
It’s just proportion Verne. An intermediate degree move should last weeks to a few months. Intermediate (2) lasted 11 weeks.
A move that lasts quite a few weeks must begin with a five down on the hourly chart.
That hasn’t happened so I’m discarding the alternate wave count today.
Thanks!
Yep! VIX collapse means we are going higher. It could be far in distance but short in time, qualifying as quite a blow off. I am not sure what to make of that NDX jump above the upper B band. It still looks terminal to me. Nothing to do but wait and see. I have not hit my stops on my IYT puts as yet but will probably exit depending on how things close. You cannot fight price, no matter what you think about it! 🙂
Going higher is right. Compare NDX weekly, action for last 2-3 months through today to Dec-early Jan of 2016-17. Oh so very similar, with this big break up. Then it became 3 of 3 action and the market went vertical. This time, we are in 4-5 land, and it’s going to be larger and larger corrections, with steadily increasing ATH’s. For months. IMO. I think the chances of this push up in NDX being a throwoever of the ending diag to be very, very small now. Too large and powerful. Time to be selectively bullish, and pretty tactical due to the frequent fresh 4’s that will pop up.
If that is what happens, it would be the very fist time I have ever seen such a massive price momentum divergence not result in a corresponding significant correction. Of course we are seeing all sorts of unprecedented things in the current market. I am particularly intrigued by how formerly bearish signals are constantly being negated. It is almost as if money comes into the market exactly at those times to drive price higher and negate them. Very strange indeed…up and away…. 🙂
Lara’s Hourly II is tracking well provided it doesn’t rise much further before it falls in the (c) of circle-a early next week. There’s a serious bearish Hanging Man working on the weekly at 2pm ET.
I would have definitely gone with that count if VIX had stayed elevated as the expanded flat is a powerful tool of the banksters to keep traders confused about the trend. If we see a turn back up in VIX before the close it would be most certainly worth serious consideration, especially because of the lower volume of the move up today….
Hmmmm… that could be bearish.
But the problem with the Hanging Man pattern is it needs bearish confirmation. So it’s really more like a two candlestick pattern.
My best guess of what’s up. Implication if correct: a lot of wave 5 up to go. Corresponding wave 1 was tiny (and is already exceeded by this 5 up). Corresponding wave 3 is huge. This could could be seriously bogus, I’m not an expert I’m here to learn, and I always figure the best way to learn is try yourself, then figure out how and why you did it wrong! At this level of view though, this looks “more correct” to me given today’s action. And again, the implication if correct: get out of your positional shorts peoples. The “full on bull mode” Lara speaks of when focused on the weekly is in every way intact!!
It certainly could be a nested situation that does have uber bullish implications to 2688 range.
Nicely done Kevin. I’ll chart your idea and I think I’ll use it as an alternate. I’ll take a look at the Fibonacci ratios and see if it has any nice ones.
SLCA might be starting a move. It’s quite depressed, and has been forming what is now looking like a shallow bowl bottom with a higher low than the larger pullback low. I.e., indications it’s back in an uptrend.
Momentum is not something that too many traders pay attention to but it has been one of indicators I have found very helpful. While divergence can continue for awhile, it always tells you what is eventually coming. Nasdaq in now showing the greatest price momentum divergence that I have ever seen in any chart EVER!
Either price indicators or completely broken or this is a death rattle.
That candle above the B band could be terminal….
Are you looking at daily candles with MACD Verne?
I see the divergence you note. I also see a bearish signal from On Balance Volume.
But I see strong support from volume today for upwards movement in Nasdaq.
I’m very wary of divergence with MACD, but for the daily chart it does seem to be somewhat useful. I’ve noticed though that sometimes it can just disappear?
My current strong view is that minor 3 is now misplaced. The 4 that price has goine through doesn’t qualify as a minor 4 by any means, and I’m not about to buy that this is an expanding flat 4. Well, not yet. It’s in my “unlikely” category now. I believe this move from the lows a few days ago is a wave 5 leading UP TO the minor 3. Meaning, some of the placement of wave structure leading up the recent high where minor 3 was placed will have to be rejiggered. I am strongly reminded of that day a few months ago where price openned on a BIG gap down, and proceeded to move up and up, past the prior close, and keep marching up. That signaled the end of what was then considered a likely primary 3. This push up, overall, signals the end of what we’ve considered a minor 3. I’ll add that we can EXPECT A LOT MORE OF THIS, as we roll incrementally through larger and larger 4’s. Each new one is likely to be “THE END OF THE BULL MARKET”, and won’t be. There are what, 3 or 4 stacked up here, waiting to play out over the next 6-18 months? Something like that.
Interesting. I have to confess I have no idea how to assign an EW count to what we are seeing right now. The market simply to become more extreme with each passing day; just when you think it cannot become any more so…
Looks like the alternate wave count was just taken out of contention.
Time for another expanding flat that extends forever and then ceases to be an expanding flat!
You got it, Jimmy! Hopefully we’ll know by middle of next week.
I was actually hoping for a normal correction as I thought it essential to the case for a final wave higher. I have to say I am now starting to think that another wave up after this is very much, at least in my own mind, in doubt. I could be wrong…..
New ATH in SPX. Amazing isn’t it??!!
If VIX does not make a new low prior to the close, I will be buying more calls….
This is starting to get REALLY interesting considering the ongoing meager volume readings…
Not really. Just par for the course.
Just a hair below invalidation of the 5 wave count up. So far. I’ve taken a short (SPXU) with a rediculously tight stop. Back up to a fresh ATH, I’m out. High leverage!!!
A revised/corrected view of the impulse up. The marking is showing where the v will be the length of the i-iii. At the moment, the v is about .618 of the i-iii. And could be a top.
Yeah Kevin, by sheer luck I took SPX and RUT short gains near the lows on Wednesday, and now re-loading. Methinks I’m done overthinking this ridiculous market, commit the capital, have a 10% trail stop and go surf.
Yeah! Same here. I was tempted to let a few ride but we’ve seen this picture so many times before I thought it prudent to take the money and run. Every instinct would suggest NOT shorting this move up but I think I am going to execute a few more trades in that direction at the close. Gravity always wins! 🙂
A day surfing is always a profitable day!
I decided to wait for the close before a move on vol. Price continues to fall…a move below ten short term bullish for equities….
TSLA and UL are definitely on sale right now.
UVXY 16.50 calls expiring next week bid at 1.08. If bid goes below 1.00 I think I will grab a few. It seems to be finding support right at 10 day MA….
21 day MA providing resistance and any break above could be important…
So far VIX finding strong support at its own 21 day MA….
Tremendous B band compression in the inverse leveraged small cap ETF TZA.
Aa very big move ahead it would appear….
There are some developments taking place behind the scenes that should arrest the attention of anyone with a stake in the American economy. Ever heard of the Petro-Dollar? If you know what I am referring to I am very interested in what you have to say about this post. If you don’t, never mind because you don’t know what you are talking about.
The Chinese went to both Iran and Saudi Arabia and told them they were no longer going to pay for the oil they bought from them in Dollars, but would be willing to pay them in Yuan. That is now a done deal people. Iran was initially a bit hesitant but the prospect of new US sanctions made that a no-brainer.
Here is what made the deal irresistible – the Chinese guaranteed immediate on-demand exchange of the Petro-Yuan ( get used to hearing that term by the time the lame stream media gets around to reporting this, then again may never do so) for GOLD. This is ominous for the Dollar. I used to be on the side of the argument that said dollar-denominated debt destruction would almost certainly send the dollar higher near term. I am now seriously re-thinking that thesis.
What’s it mean for gold, Verne?
I’ve been told (don’t know the veracity) that Iraq moved off the dollar for oil payments in 2001, and that was the “real” driver of the invasion of Iraq a few years later. “No no no!” said Daddy US Warbucks. The logic being that petro-dollars is the largest driver of demand for US $$ in world today, and if the world oil industry moved away from $ as the sole oil purchasing currency, the US economic interests would be seriously hurt, so a message needed to be sent very loudly and clearly. Interesting times.
Yep. It is why we murdered Saddam Hussein. It is why we murdered Muammar Gaddafi. The latter not only intended to demand payment for his oil in Gold, he planned on uniting African nations behind a Gold-backed Dinar.
We wantonly destroyed two of the most stable and prosperous nations because they dared to attempt to expose the thuggish scheme propping up the US Dollar.
I am not sure about the near term prospects for the Gold price Kevin.
These things are so far remote from the thinking of the average American it possibly could take years before the masses wake up from their screen induced slumber and figure out what is going on around them. Long term, 5000.00 dollars an ounce is in my view inevitable.
That would be nice! My gold position is underwater at the moment…
My approach over the last few years is to simply accumulate some of the best miners, and keep buying the metal and not even think about it. I think one has to have a long term view of that trade.
You can do very well selling covered calls against your long position and actually steadily grow your position even when Gold price wildly fluctuates. 🙂
Verne, you have a point. I’ve heard similar things but I am still skeptical. The Chinese do not have any interest in a weaker dollar in the short term. Long term yes. Short term now. I doubt this amounts to much over the next year or two. 10 years from now it may be an issue. Will the U.S. find a reason to invade the Saudis? LOL
I completely agree Jimmy. There is very little chance that the Dollar is going to in the short term cease to be the reserve currency. Right now there is nothing to replace it. The immediate result of these interesting moves by the Chinese is to over time constrain the ability of the US to use one of their most powerful weapons, control of the reserve currency, to bully the rest of the world. Remember this process has been proceeding apace as a few years ago the BRICS nations already moved to settle local trade in their own currencies, by-passing the Dollar as was the case for decades. The Chinese are playing a long term game here.
As a matter of fact, that power was recently on display when the US threatened the Chinese with exclusion from SWIFT over North Korea and they got on board with the UN sanctions….
How I’m modeling SPX right now…a 5 wave push up in progress, in wave 4 of the final wave 5 (oops, just kicking off the final 5?). Then a move back down to the range of the 4, as shown by the down arrow. But don’t believe me; believe yourself!!
Your third wave appears to be the shortest…. 🙂
That’s because I draw casually. Remains to be seen how wave 5 develops. And if 3 is shortest, it’s wrong. Note that if price turns below or at the ATH…it’s valid. Price needs to get to about 2579.70 to make 3 the shortest.
Ordinarily that move above the upper B band would of late have to be taken with a grain of salt as price in so many assets have now developed the habit of staying pinned against the upper band for sessions on end. The momentum divergence and low volume of this pop suggest to me it is terminal, a con job, new ATH notwithstanding…just one man’t opinion.
We have a clue ladies and gentlemen – smart money is buying the VIX beat down. Keep an eye on that long lower wick…it just might get a longer, or as an Austrian friend I had would put it “Long-er” 🙂
I think the Qs are done. Huge momentum divergence with this blow off move above upper B band. Buying 50 contracts of November 17 150 puts for 1.74 each…
There was that very large “ending diagonal” in NDX. Price has now blown through the top BUT…it could be a throwover. I might consider a short if/when price comes back into the diagonal from above.
Yep. A fifth wave throw over is ideal. Confidence comes with a move back below top line of ED boundary, confirmation with move below lower boundary line.
These things make their presence know with stunning swiftness so if that is what we have we should know shortly….
I am short…
RUT is the leading index lately!
Could that be the fourth wave done?
At least we know we’re in a flat now.
I think the clock might be ticking backwards…
SPX above yesterday’s high, negating that long upper wick yesterday…why aren’t we surprised?
I for one, am not buying it. I think the bearish signals are real.
I expect them to ramp it into the week-end to continue to try and intimidate the bears.
I will be looking to futures on Sunday evening to tell the tale.
We are in for another frothy session methinks. Interesting volume profile so who are they kidding?
Short term VIX has decisively broken the uptrend line so unless it is retaken it looks like we are going higher. This will be confirmed if it acts as resistance now…
“Everything is proceeding as I have foreseen!!”. Well, not precisely because I did NOT expect this strong a kick back up. But the model of froth at the top for a week or so as SPX slowly rolls over is still very much in play. Markets churn with higher volatility when they top, so this is all part of “what happens”. Unless/until price starts breaking with strength into new highs, and I doubt that will be today, if at all. We’ll see!! Meanwhile, a few bears are attempting to fly…
Agreed. I think the smart bears are methodically getting positioned.
The key here I think is patience and understanding as you said, top formation is a process. Another key continues to be scalping the moves until we get a sustained confirmed trend…
Selling June 2018 AMZN 1400/1420 bear credit spread for 1.1.
Risk is 2000 per contract if AMZN trading above (hyuk!) 1420 next June. This is what I call a “thermometer” trade and not expected to be particularly profitable. Its value is to signal the breakdown of Amazon’s price by a precipitous collapse of the bid on the long calls. THEN, is when you jump into the puts…if they are still affordable that is…. 🙂
AMZN is doing for Nasdaq, what IBM did for the DOW about a week ago. Clever!
Interestingly enough IBM already heading back toward that gap area….
Very peculiar. Instead of DJI running ahead of the other indices it is now lagging them. Does it signal an inability to engage in across the board ramping? Who will join whom, I wonder?
VIX “should” give a clue.
No clue yet… still in Trap mode.
I have been waiting for an oppotunity to short the most ridiculously overvalued stock in the world and the day has arrived. The move back above 1000 is the signal. I will start this trade with June 2018 bearish credit spreads and switch to put options as soon as it moves back below 1000. I think it is going to around 650 based on that broken wedge. Also holding MSFT leaps.
You mean AMZN?
By my quick math… when AMZN opens this morning it will be trading at about 4.55 Times Revenue.
No company should be trading for more than 2.5 Times Revenue and that is for a fantastic growth company at peak valuation.
The other extreme in a bear market most companies would trade at 1 times revenue or under 1 times revenue.
Bingo! 🙂 🙂 🙂
Today it begins! The final TICK!
The Bulls get trapped today.
AMZN Valued at $505.66 Billion this morning on estimated full year 2017 Revenue of about $116 Billion
In what Reality does that make any sense???
AMZN now Valued at $514.89 Billion per Google Finance
… INSANE
Nana na na nana na na hey hey hey goodbye!
“In what Reality does that make any sense???”
33% Revenue Growth YoY is probably a good start for a company guiding 60B next quarter. Also, just getting licenses in 13 states for prescription drugs…the AMZN hammer is dropping on so many businesses.
You shall all see… Extreme multiples of Revenue just Prove we are at a major cycle top!
AMZN now valued at $519.72 Billion 4.48 Times estimated full year 2017 Revenue!
Go Back in history and look where markets topped and what the multiple of revenue was. Then look at bottoms and compare that multiple of revenue.
Beating analysts estimates is a fools game! You should look at year over year growth on GAP reported numbers… non GAP is pure Bull S!
Until that day, I’ll be riding my long up. Long since $164 (2011 — when everyone said it was overvalued then too…)
You can thank the Fed and QE & other QE from central banks for your gains. None of that was from real economic growth.
All that QE is now in reverse and will take away from what asset benefited most.
You remind me of the angry guy, Baum, who shorted the banks in ’07.
Whatever! AMZN will go to 1.5 Times revenue in the bear phase of this market.
Wait until the Government comes calling because controlling too much.
Good morning!
It would appear based on fututes price action that my personal rule sbout never leaving ptofits sitting in the market still obtains! Despite reliable reversal bearish engulfing and shooting star candles the price whipsaw continues. At the risk of sounding like a broken record, again my opinion is that any sustained market decline is being fiercely resisted, and the msrket’s inabilty to trace out an very clear impulsive wave down means the banksters are still firmly in charge. We have seen this pattern so often now that we really cannot dismiss the possibility of yet another abc type decline. I am going back to my thesis that the real breakdown will come in the futures market, and that we should continue to expect intraday declines to be reversed.
Eventually the whipsaw will end. Market risks are real and growing. We had another Hindenborg Omen this week. A Venezuelan bond default is looming. I will be keeping a keen eye on VIX today. It may signal what to expect in the very short term.,
Holy Cap’n Ahab!
Thatsa big fishy! 😀
Grilled, or pan seared?
Raw. Marinated in lemon for 2 hours, rinsed in salt water, served with coconut cream, lime and a little chilli. YUM
Oh My! Sounds delectable!! 🙂
Look what’s on the menu for tonights dinner! Super fresh…
Now into some more waves….
I thought ya threw back the little ones!!
Eehh..!
Super fast!