A small doji after the Bearish Engulfing Candlestick pattern completes a Bearish Harami Cross.
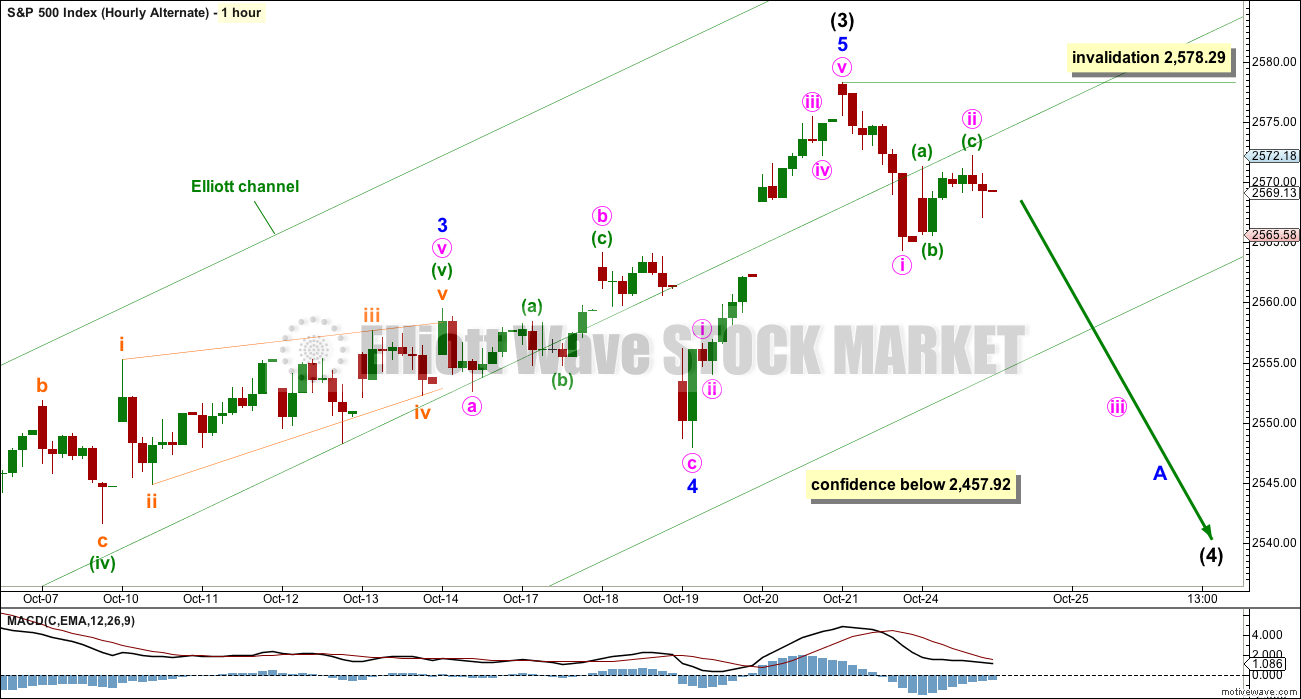
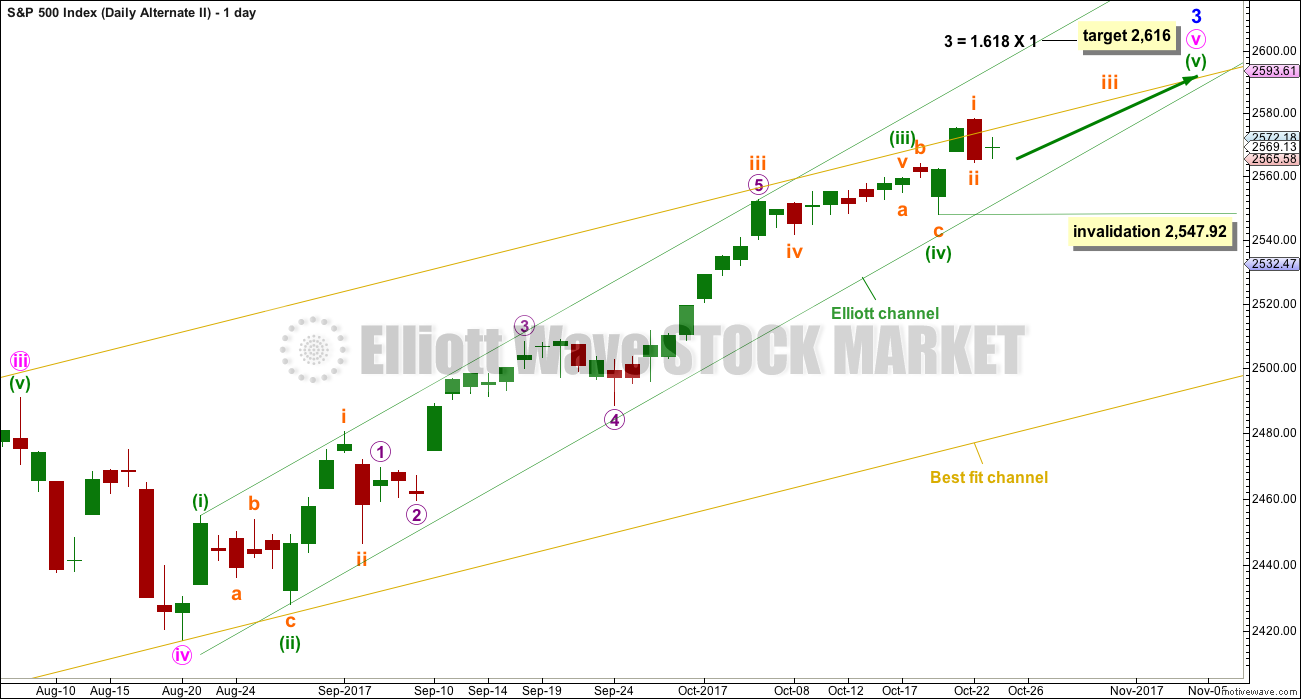
Summary: A new wave count today will assume the trend remains the same while price remains above 2,457.92. It is published as a second alternate. If price makes a new all time high tomorrow, then use the target at 2,616.
A fourth wave may have arrived. Reasonable confidence may be had in this view if price makes a new low below 2,457.92. The fourth wave may be relatively brief and shallow as minor wave 4, or it may be a much deeper multi week pullback or consolidation as intermediate wave (4).
Last monthly and weekly charts are here. Last historic analysis video is here.
MAIN ELLIOTT WAVE COUNT
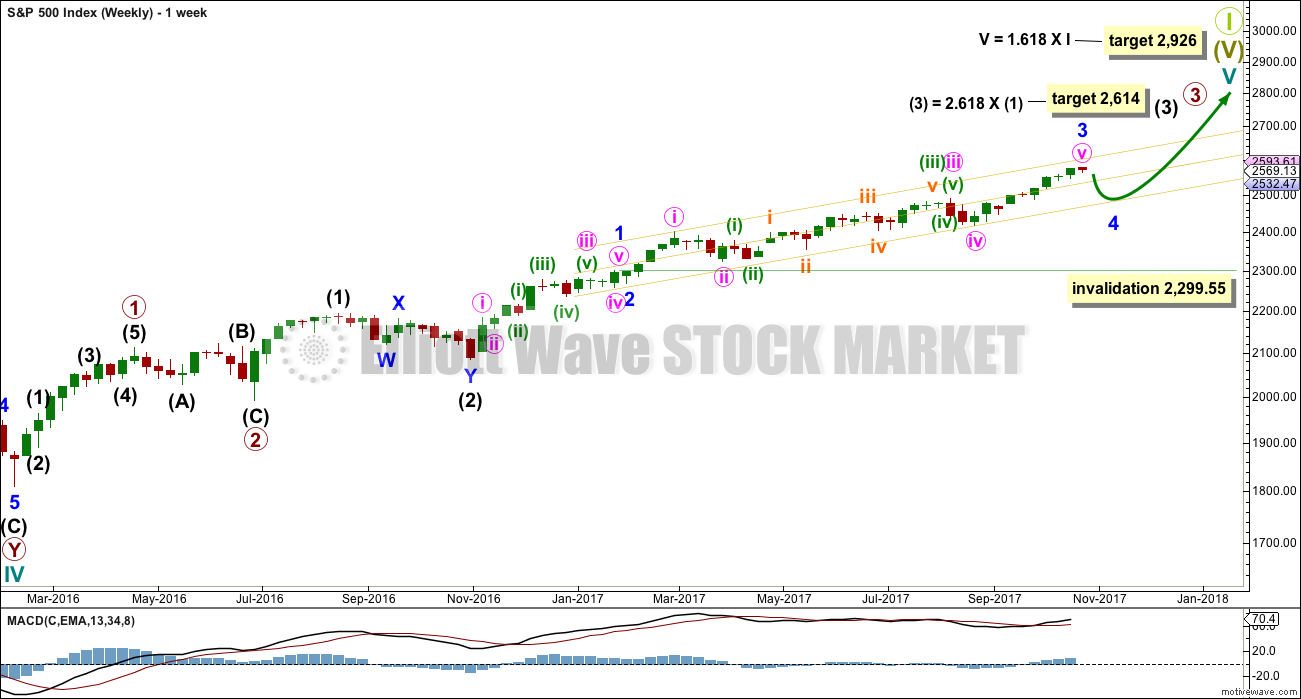
WEEKLY CHART
This wave count has strong support from another bullish signal from On Balance Volume at the weekly chart level. While classic analysis is still very bullish for the short term, there will be corrections along the way up. Indicators are extreme and there is considerable risk to the downside still.
As a Grand Super Cycle wave comes to an end, weakness may develop and persist for very long periods of time (up to three years is warned as possible by Lowry’s for the end of a bull market), so weakness in volume may be viewed in that larger context.
Within minute wave v, no second wave correction may move beyond the start of its first wave below 2,417.35.
The next reasonable correction should be for intermediate wave (4). When it arrives, it should last over two months in duration, and it may find support about the lower edge of this best fit channel. The correction may be relatively shallow, a choppy overlapping consolidation, at the weekly chart level.
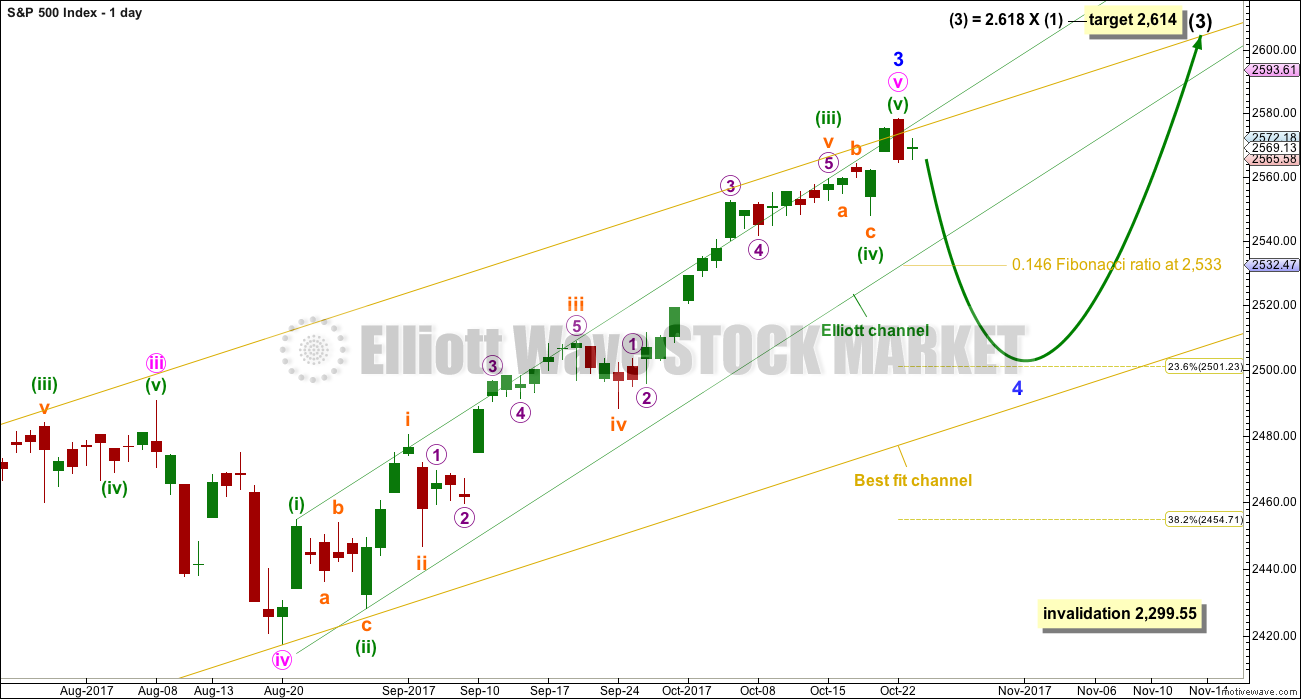
DAILY CHART
To see details of the whole of primary wave 3 so far see the analysis here.
Minor wave 3 may be complete and may not exhibit a Fibonacci ratio to minor wave 1.
Minor wave 2 was very brief at only three days. It is possible for good proportion that minor wave 4 could be as brief.
The 0.146 and 0.236 Fibonacci ratios should be first and second targets for minor wave 4 to end.
Minor wave 4 should break down below the green channel containing minuette wave (v). A breach of this channel would add substantial confidence in this wave count.
If minor wave 4 were to end within the price territory of the fourth wave of one lesser degree, then a target range would be from 2,490.87 to 2,417.35. The 0.382 Fibonacci ratio of minor wave 3 is within this range at 2,455.
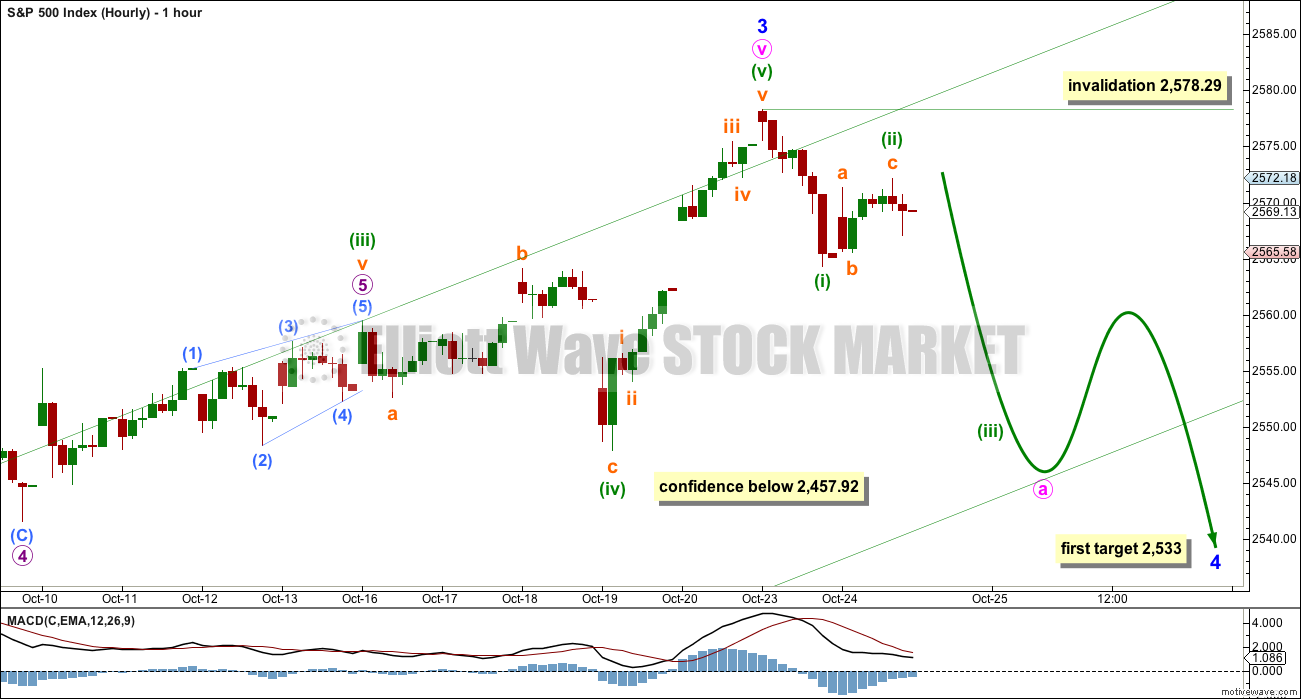
HOURLY CHART
So far downwards movement looks impulsive and will subdivide as a five wave impulse on the five minute chart. So far upwards movement looks corrective and fits best as a zigzag.
A new low below 2,457.92 would add reasonable confidence that a correction has arrived, but it will not tell us which wave count is correct.
Minor wave 2 was a quick zigzag, so minor wave 4 may exhibit alternation as a shallow and sideways flat, combination or triangle.
First, a five down should complete even for a correction at minor degree. That would be incomplete. While it is incomplete, minuette wave (ii) may not beyond the start of minuette wave (i) above 2,578.29.
ALTERNATE WAVE COUNT
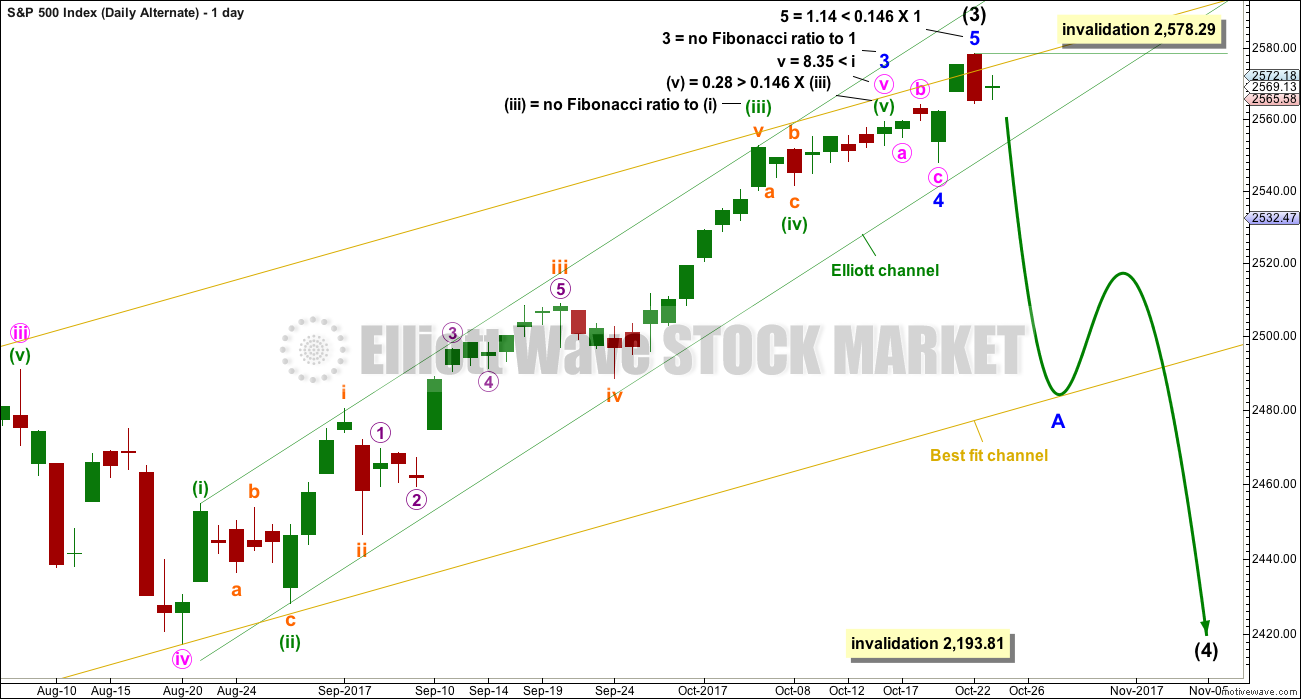
DAILY CHART
It is also possible that both minor waves 3 and 4 could be over.
My initial judgement was to label this as an alternate because of the brevity and shallowness of minor wave 4. This does not look right. However, there is still good alternation and good proportion with minor wave 2, which lasted only three days and was a zigzag. Here, minor wave 4 may have also lasted only three days and may have been a flat correction.
Intermediate wave (3) could be over. A deep multi week correction for intermediate wave (4) may have arrived.
Intermediate wave (2) lasted eleven weeks and was a relatively deep 0.54 double zigzag. Intermediate wave (4) may be a shallow flat, triangle or combination to exhibit alternation. To exhibit good proportion, it may last about eleven weeks or possibly a Fibonacci eight or thirteen.
A new low below 2,547.92 could not be a second wave correction within minor wave 5, so at that stage minor wave 5 must be over. This would add reasonable confidence that a correction has arrived.
HOURLY CHART
A correction at intermediate degree should begin with a five down on the hourly chart. That would be incomplete. While it is underway, no second wave correction may move beyond the start of its first wave above 2,578.29.
SECOND ALTERNATE WAVE COUNT
DAILY CHART
It is also possible that minor wave 3 is not over. This wave count will remain viable while price remains above 2,547.92. If price makes a new all time high, then use the target at 2,616.
Within minuette wave (v), the correction of subminuette wave ii may not move beyond the start of subminuette wave i below 2,547.92.
TECHNICAL ANALYSIS
WEEKLY CHART
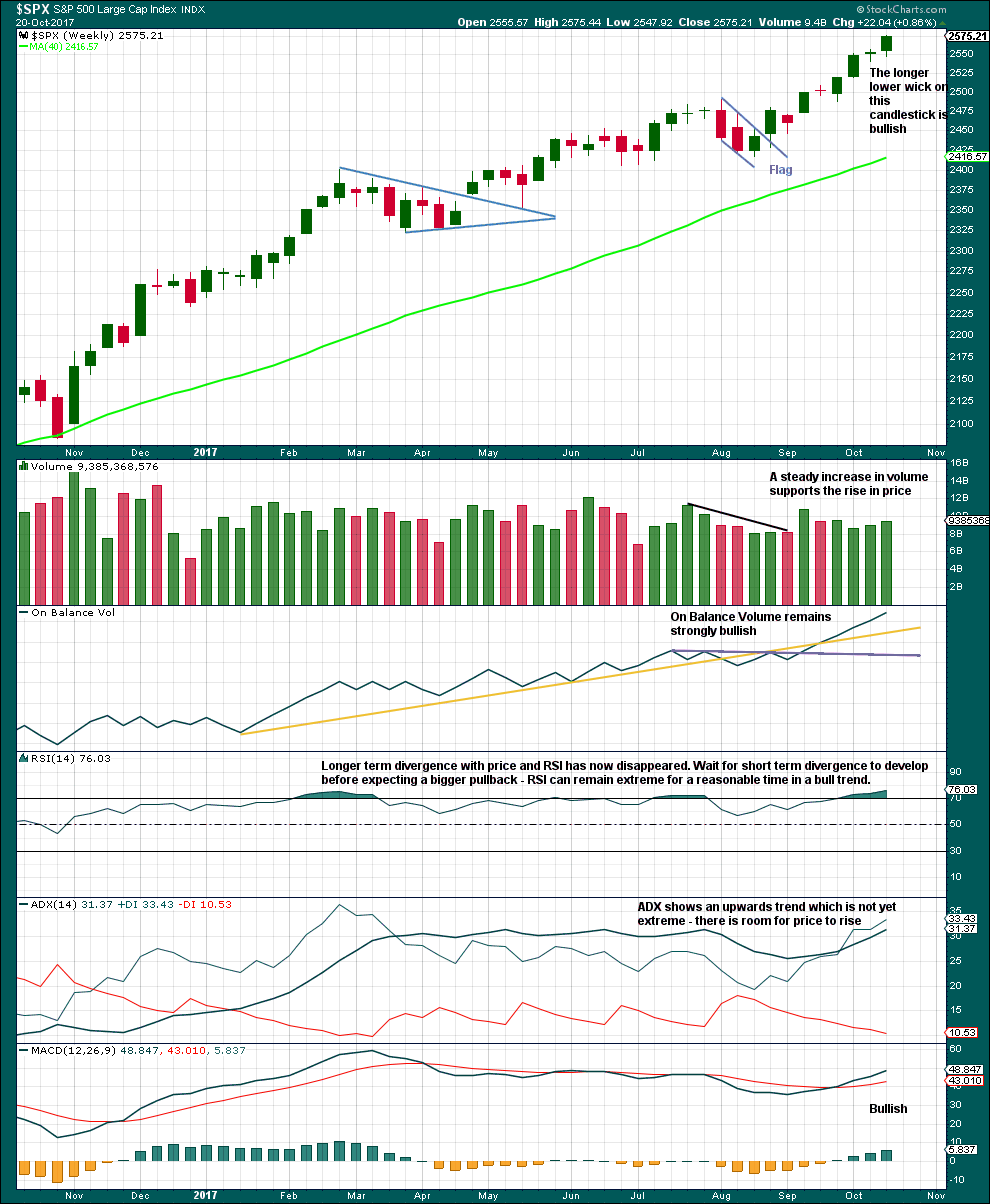
Click chart to enlarge. Chart courtesy of StockCharts.com.
At the weekly chart level, the technicals last week look even more bullish than the week prior.
Longer term divergence with price and RSI does not appear to be very reliable; it has again disappeared. Like divergence with VIX and the AD line, divergence with price and RSI appears to be more reliable for the short term when it is clear and strong.
This chart is fully bullish. There is nothing bearish yet here.
DAILY CHART
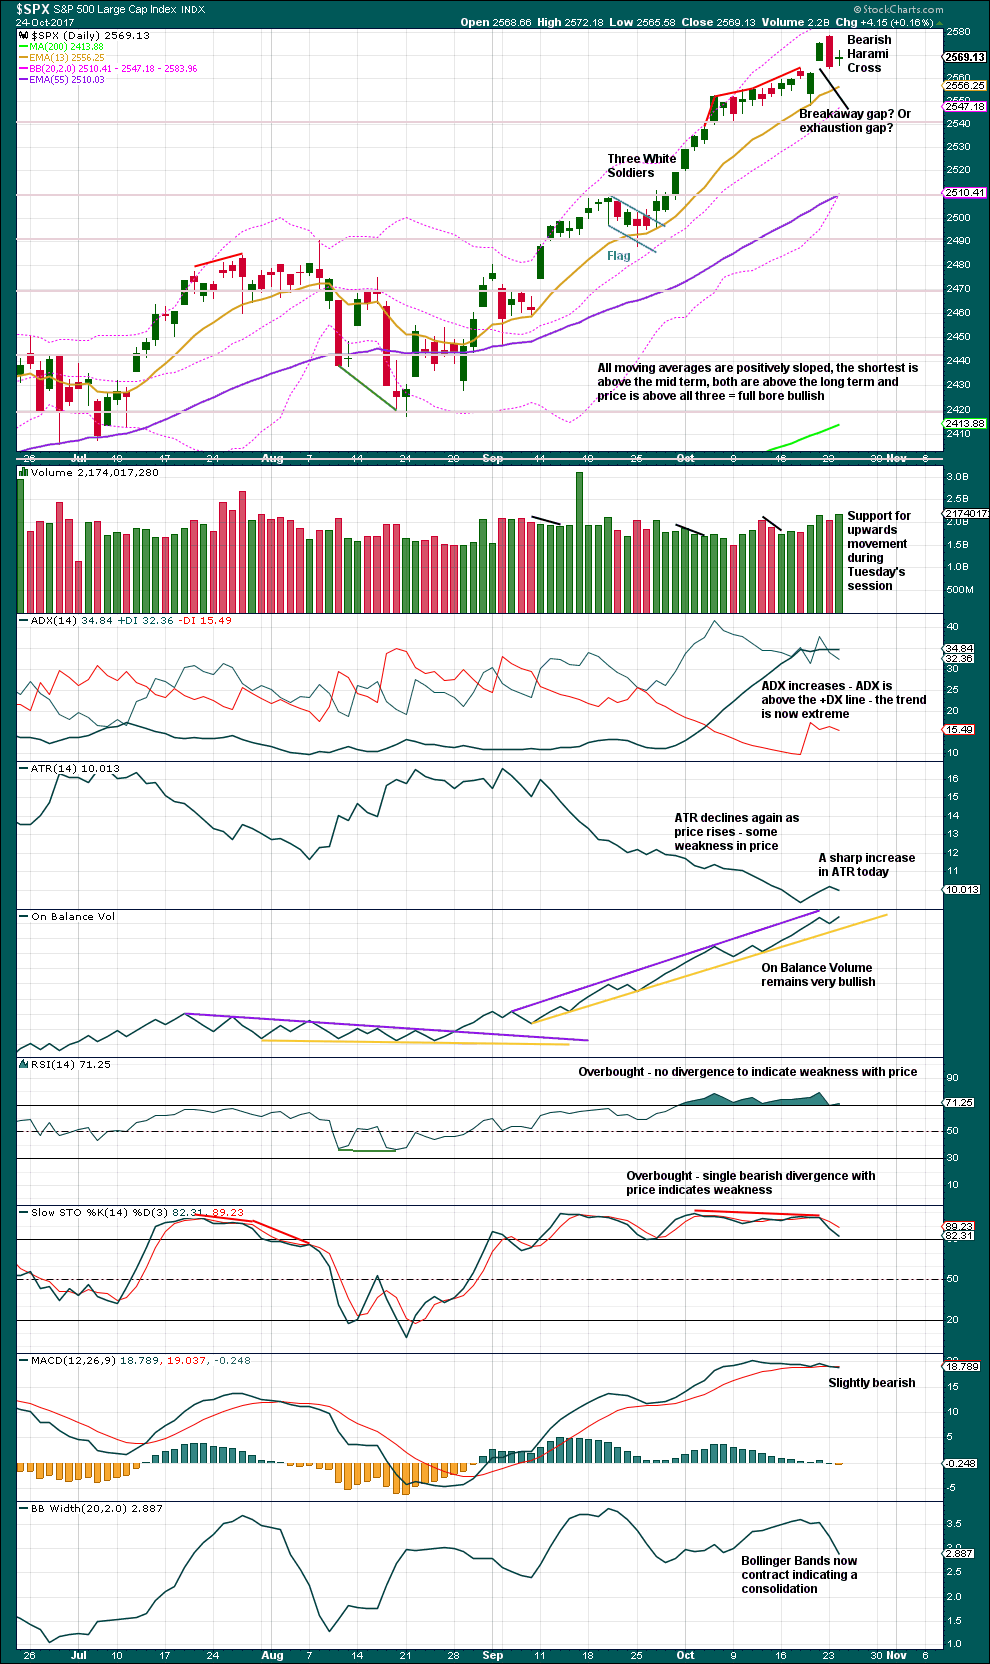
Click chart to enlarge. Chart courtesy of StockCharts.com.
While a Bearish Engulfing Candlestick pattern is the strongest bearish reversal pattern and works about 79% of the time (according to Bulkowski), when followed by an inside day closing as a doji it creates a Bearish Harami Cross pattern which does not have a very good probability of calling a trend change. In fact, it works only 43% of the time.
However, not all Bearish Harami Crosses are first comprised of a Bearish Engulfing Candlestick pattern. In this case, the bearishness of the engulfing pattern still should be given some weight.
Support for upwards movement during Tuesday’s session suggests a new all time high tomorrow.
VOLATILITY – INVERTED VIX CHART
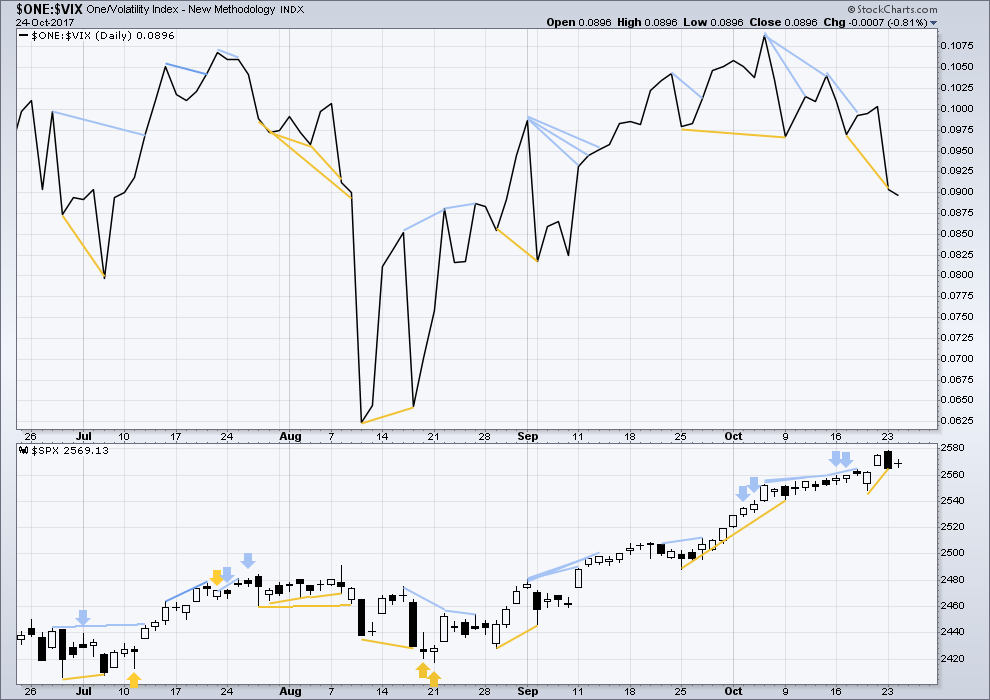
Click chart to enlarge. Chart courtesy of StockCharts.com.
Normally, volatility should decline as price moves higher and increase as price moves lower. This means that normally inverted VIX should move in the same direction as price.
While price completed an inside day, the balance of volume today was upwards. Upwards movement during this session came with an increase in volatility as inverted VIX declined. This small single day divergence may be interpreted as weakly bearish, but it is too weak to be given weight though.
BREADTH – AD LINE
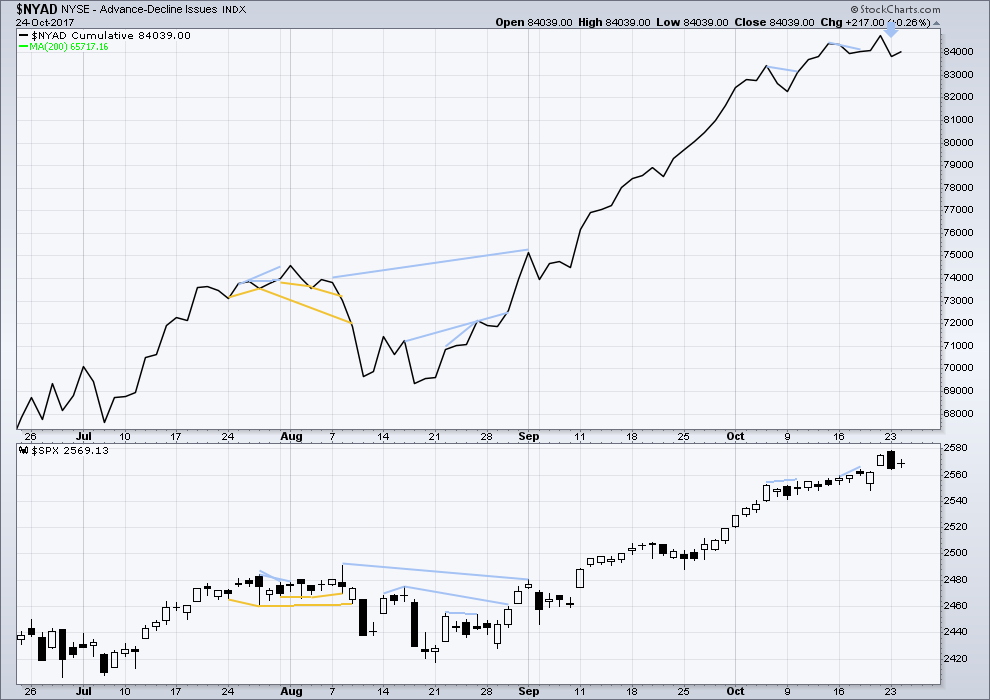
Click chart to enlarge. Chart courtesy of StockCharts.com.
With the last all time high for price, the AD line also made a new all time high. Up to the last high for price there was support from rising market breadth.
There is normally 4-6 months divergence between price and market breadth prior to a full fledged bear market. This has been so for all major bear markets within the last 90 odd years. With no divergence yet at this point, any decline in price should be expected to be a pullback within an ongoing bull market and not necessarily the start of a bear market.
Bearish divergence noted yesterday has been followed by only a small inside day. This bearish divergence may yet lead to downwards movement; it is not yet negated.
DOW THEORY
At the end of last week, only the Dow Jones Transportation Average has not made new all time highs. The continuation of the bull market has not this week been confirmed. However, the Dow Jones Transportation Average is not far off its last all time high. If it does make a new all time high, then this analysis will be totally and fully bullish.
Failure to confirm an ongoing bull market should absolutely not be read as the end of a bull market. For that, Dow Theory would have to confirm new lows.
The following lows need to be exceeded for Dow Theory to confirm the end of the bull market and a change to a bear market:
DJIA: 17,883.56.
DJT: 7,029.41.
S&P500: 2,083.79.
Nasdaq: 5,034.41.
Charts showing each prior major swing low used for Dow Theory are here.
Published @ 10:14 p.m. EST.

DJIA
15 min chart over three days… has a very clear Head & Shoulder Pattern. We shall see how that plays out.
It could be joining the other indexes tomorrow.
It includes the all time high right at the middle of the head, so it will be very interesting.
Yep. I see it. The turn down being fiercely resisted though as attested to by that long lower wick. Lots of buying power stepped in today. I remain impressed at the amount of capital being expended to keep the market from declining. I suspect that this is a minor wave and we may not have a top. I think the move down from the real top will not brook these kinds of agonizing crawls back off the day’s lows.
The fall is going to be relentless at that time imho…
I don’t believe it – are we in wave b of expanded flat?
Well, we have the first answer. It looks like a fourth wave correction is underway that is going to be deeper and more time consuming than the more recent consolidations which have been very shallow.
But we still cannot tell if it is minor or intermediate degree.
Hiya Surfer. Is that sand all over the forum you are trailing? 🙂
Not happy about the DJI gap retake.
If the bears are serious they are going to settle that particular dust-up and do it rather quickly I would hope…
Surf’s up today! Will go surfing shortly… work first.
Nice to see that gap on the S&P closed today.
Yeah…that long lower wick does warrant a bit of caution imho…we’ll see! 🙂
Yes, it does indeed. Not long enough for a hammer pattern, but it sure is bullish.
I am wondering about the possibility of an initial impulse down with now a deep second wave zig zag underway….?
Yesterday we had a sneaky romp higher by VIX into the close…..
No question we are seeing some knee-jerk bot VIX shorting going on…algos running amuck….
The short VIX cohort had better hope VIX stays below 13.00 into the close…if not…
“Farewell and Adieu, to you Spanish Ladies…!” 🙂
Ooopsie!!! 🙂 🙂 🙂
Looks like sneaky ‘ol VIX about to do it again. If it crosses 13 into the close….do you like free money???!!! 😀
Man…! A real dogfight underway as the close approaches, What’s with all this trashing around I wonder?
Right about now, the what from here on out I will be calling the “VIX Wussies” are looking concernedly at the VIX price action and wondering of they have managed to tame the beast and we will see it plunge back below 11.00 and the upper B band into the close so the party can continue. Will their anxious gaze be rewarded, and back to party time?! or…… 🙂
I just took a look at the last consolidation price action and it looks really triangular so I am starting to doubt we are going to see another one with this correction…nevermind! 🙂
It looks like the Achilles heel for the volatility shorts is the 13.00 pivot. If we close above it
you are probably looking at an easy double by tomorrow’s VIX high with the right selection of call options.
The one time regular traders have a distinct advantage over the trading bots is early at trend changes when the machines are too stupid to recognize it….
Cool turn on 50% retrace of wave 3
RUT 15 min chart in a very clear impulse down for 1 and then up for 2 with wave 3 appearing to begin now.
I was wrong about one thing. I thought the signal of an impending breakdown would come in the futures market and that did not happen. We had the downturn begin today during the regular session. I am interpreting that as the market beginning to fall under its own weight with still not that much selling pressure, and that is being confirmed by the long slow crawl back up we are seeing today as deep pockets inject tens of billions to stem the tide. You mean to tell me they STILL have more cash lying around to keep pumping? 🙂
It’s a bit early but we could be seeing the start of a triangle with a final thrust up after it is done. That would be sweet to trade as they are quite predictable…..they are typical wave forms, like diagonals, that emerge when an impending trend change is being staunchly resisted so far as wave characteristics go I am told…
I hope not. Triangles always seem to pick my pocket. (In SQQQ yesterday @ 25.53, stop currently at 25.62. We shall see…)
I should add that for lifestyle reasons, and also to reduce trading costs, I’m in the process of disciplining myself to expand my trading time horizons from 20-30 minutes to 2-3 days or more, if price action permits it.
Yeah, they are really quite tricky. I stay away until I think they are getting close to the end. The sweet spot is to nail the inevitable thrust out of it.
The key is the thrust out will be in the same direction as which the triangle initiated. For example if in a fourth wave in a down-trend the thrust out of the triangle will be to the downside for the final fifth wave, and the opposite in an uptrend. It is one of the easiest doubles an options trader can execute imho… 🙂
Yes, but… it’s almost impossible to recognize a triangle of minute degree or larger until after it has clobbered you once or twice. That’s where being a student of EW can help sometimes, especially recognizing that we might be in a 4th wave one degree higher.
Trading down-trends in this market has been very treacherous. There was a time you could comfortably make a swing trade lasting several days to several weeks but of late it seems as if every initial move down is getting immediately arrested and reversed to the upside, forcing most of us to become day traders to avoid the terrible whipsaw. I am not sure how long this is going to go on but until it changes we are going to have to assume that we are going to see the same kind of frustrating price action. I will not be entirely happy until I see a monster gap down in futures of at least a thousand DJI points that sticks during the cash session….
Watching DJI 23,343.23 as the canary in the coal mine. A real confirmation of “game on” will be to see the bears let ’em get REAL close and then take ’em out back for a royal A_ _ Whupping! Hyuk! 🙂
I’m watching this first leg of a 4 up in SPX. It’s the 5 down coming that’s going to surprise a few. I’ll be looking to reload shorts soon…after I close out my SHORT VOLATILITY trade (XIV), lol!!
Talk about nimble! Another gunslinger…he! he!
If price closes above the upper B band taking fast profits would indeed be very wise methinks! 🙂
I would not bet on it necessarily. They banksters could retake the gap. The ideal scenario would be one more spastic wave up to new highs by all the indices in keeping with my thesis that the banksters are absolutely not going to allow any downside momentum to gather if they can arrest it. When the market starts to fall precipitously with very brief bounces is the time to go all-in. Not quite there yet it seems to me.
Verne,
Don’t forget that they have been away and missed the move we have had over the summer months. They are very much attached to their bonuses and would not want anyone or anything come in the way. So I expect a sharp drop that might last few days to get them into positions that are going to guarantee a good bonus..
I did not think of that…! 🙂
Kevin,
Do you have some levels on SPX to monitor for reloading shorts? Are you using daily retracements on SPX or weekly?
I’m looking at all time frames…but I’m trading mostly around the 20, with help from the 5. I’m looking at fibo retraces in combo with synchronization on the lower time frame count (hour down to 5 minute). I just took a small short on RUT, on what the wave count tells me is the relative high of the 4 in play. Stopping above the high from 30 minutes ago, or perhaps what I think is the low of the 1 down a little higher than that. Target is to eventually get well below this mornings lows on this one.
But you asked about SPX. I have fibos all over, most particularly some higher 61.8% around 2559.5 and 2561.5. And it looks on the 5 minute like SPX is executing a very small 4 on a 5 wave move up, which is itself part of a wave 4 after this big 3 down. So I might be looking for evidence of a turn and a sell trigger after a 5 wave hitting one of those upper fibos. Entering on the extreme of the 4, looking to profit from the entire 5 is a fine strategy in my book!
This shows the two fibo zones that are like ending/turning points for what I presume is wave 5 of this overall bounce up. I’ll be watching for a turn and sell triggers after price getting to those zones.
I am a little suspicious of IYT as we are NOT seeing B band expansion and price is now touching the lower band. Either we get a bit of a bounce here or we are going to see a face ripping gap down as the B bands explode outward. No way to tell which at the moment…I bailed like a WUS! 🙂
So far very good technical price action. The bears busted the gap and it now appears we are coming back up to back test that area. Now remember folk, we have seen this move many times before. Never underestimate the banksters. Not if you value the health of your trading account. Look for them to try and re-take this gap into the close.
I am seeing some attempts to short VIX but it is not convincing so far. Let’s see if we get a close above the upper B band and that upper wick gets filled out. If this gap area is re-taken into the close we are probably looking at another short and sweet downside move, incredible as that may seem to some of us.
Here’s how I view NDX: a BIG ending diagonal in play since July, with a, b and c touches complete. Pricing coming down now, to soon perform an d touch. Then UP AGAIN to complete the E touch. Could be short of target…or it could throw over. At any rate, based on this, I don’t think this market is quite ready to collapse. A few more weeks and another push up after this sell off completes, I believe.
Letting the remaining short ride ass that is house money and got some confidence that this is just getting started.
Now THAT’s what I’m talkin’ bout!!! 🙂
Wow! SVXY puts just exploded! Yikes!
? 🙂
Sold IYT puts for 2 bucks. Will reload if contracts go back below 1.75
The banksters may be offering up a dead cat boune…
If you trade options and got pre-positioned based on VIX price action you should be able to take profits earlier than other trader, my own preferred approach. Options bought when VIX was below ten should be showing a nice premium pop. If we get a long VIX upper wick above the B band sooner rather than later we are most likely at minor degree.
RUT appears to me to be leading the charge. A very clear impulse wave down on 15 min.
Interested to see if this is Minor or Intermediate 4. Anyone got any early pointers?
I expect that doesn’t get resolved until this 4 plays out. It’s breadth and depth probably drives that call. What we’ve seen so far is merely preludeif price is indeed entering an intermediate 4.
I have no pointers on that for you. Yet.
Selling second batch of VIX calls. I would have preferred to see B band expand to contain price but not surprised. Will reload with close above 11.75 for target of 15. Nice pop on midterm SVXY puts now nicely in the green….whew!
Holding IYT puts for more downside…
Considering the historic level of complacency, I think it unlikely that we are going to see an unwind of the stunning short vol trade on this first leg down. Expect them to do what they haves always successfully done, and that is double down and attempt to short the initial spike. If we go on to new highs as per the wave count they will breathe easy for a bit. If the B bands continue to expand they will be in trouble immediately and market price may even lag VIX brfore they realize what may be happening. In this kind of environment folk sre prone to ignoring rules (of risk management). If VIX deeply retraces but makes a higher low, then they will be in trouble later. Frankly, I don”t care which.
SPX now firmly in one of the bearish wave counts. I expect a fairly strong bounce back up today. I still am looking for choppy sideways action overall for a few days, then a possible roll over and significant price decline. I note that right now, QQQ isn’t really paying ball in this small sell off. It will soon be a (short term) buyers market. But not for too long. SPX looks like it’s very close to completing a C leg down at the length of the A (at SPX = 2558.2). That might be the turn point. It’s also very close to the .618 of the last 5 wave up (Oct 19-23).
So much for the Q’s not joining the party. Now the Q’s are leading the samba line!!
Kevin,
For now holding my short on QQQs as they will work better as NDX sees a sell off.
TICK
Lara mentioned Bulkowski statistics today re: candlesticks (and he does “patterns” too). I have a major bone to pick with Bulkowski’s data, and it’s quite simple. In the world of poker, we know that while in abstract “statistical significance” comes with a small number of data points (30+ so they say), ACCURATE estimates of the actual probabilities require a MINIMUM of 20,000 hands worth of data. Minimum. No one in the poker world will even consider any claims based on less data than that, and even 20,000 is suspect; 40,000 or more is much better. Bulkowski’s data is from (typically) anywhere from 40-120 samples. The underlying (“real”) probabilities of two patterns could be identical at say, 50%…and his tiny sample sizes could show one at 28%, and the other at 65%, and those results would be perfectly reasonable…and perfectly non-informative. I would look at all his data as a very nice effort, and vaguely (VERY vaguely) indicative…at best. My opinion, but one I think all serious professional poker players would agree with, and anyone with in depth experience using real statistical sampling. You just don’t get high accuracy until you get to much bigger numbers. Hence the absurdity of US election polling (of what, 1000 people across a nation of hundreds of millions? Shock and awe, the poll results are nothing like the actual!).
That’s a fair point about Bulkowski, thanks Kevin.
I bought one textbook with me but I did not bring my big candlestick book by Nison. That’s why I referred to Bulkowski here. Normally I would just read up the appropriate bit in Nison which I do prefer.
Anyway, I do remember Nison stating that engulfing patterns are the strongest reversal patterns. So that is what we have here at this time (as well as the Harami Cross)
Over the past few months I have been high-lighting the remarkable situation in the market as regards volatility levels. I realize that I have not done a very good job trying to explain my own consternation, since judging from some of the comments I get, I sometimes find myself wondering: “Am I really missing something, or are some folk really that clueless??!!”
I will readily concede that I have been pointing this out for so long I certainly do appear to be the boy who cried “Wolf!”
Does the persistence of the situation materially affect the logic or validity of what I have been saying?
I honestly do not think it does.
When we talk about volatility suppression, I think we can identify at least two ways in which it takes place. You can have people selling naked puts (done by many traders in a low interest environment to generate income), loading up on calls, loading up on inverse VIX instruments etc, which constitute explicit shorting of volatility. Few people pay attention to the implicit ways in which it also happens. Determination of value at risk (VAR) is a direct function of volatility and constrains how much exposure risk desks will permit their traders to assume. The longer and lower that volatility persists, the bigger and more leveraged the positions that are permitted. Think about this for just one second. What we have now is the most expensive, most leveraged market in history, that is also the LEAST HEDGED market in history. Virtually no downside protection whatsoever. This is complacency never before witnessed in the recorded history of markets!
Some of you already get what I am driving at; some still won’t but that’s allright.
To stay in the game the issuers of vol instruments have had no choice but to massively short vol futures to support the unprecedented levels of current shorts which has resulted in the incredible situation we are seeing today.
When the market turns down, or even has a normal correction, leveraged longs can reduce risk in one of two ways. They can sell, or they can hedge. As to the first option, we already know there is a great big elephant in the room that under these circumstances, becomes suddenly obvious to all, and of paramount importance. What is that you ask? NO VOLUME!
That leaves hedging. You can of course hedge your long positions by, instead of trying to sell when there are no buyers, buying puts. Are you still with me?
Now imagine at the time when the market is the most expensive it has ever been, with absolutely NOBODY giving a rat’s petootie about hedging their leveraged long positions (as evidence by non-existent or steadily declining vol) ALL suddenly deciding they want to, no, HAVE to hedge their positions (few buyers, remember?) . What do you think is going to happen to volatility? It is actually worse than you are thinking but I will leave that for another discussion. It is truly incredible beyond comprehension that not only are traders positioned as if the perception of risk (implied volatility) will remain -that it is non-existent, they are positioned as if none whatsoever actually exists! From what we know about the geo-political situation and the true state of economies, is that logical? Of course it is not, but markets have never traded, certainly not recently, on the question of logic. You know the famous quote about the market remaining irrational…
What is the one emotion that is more powerful than greed?
Exactly. Fear!
Not even central bankers, considering the true state of things, can indefinitely keep fear at bay.
Will this happen tomorrow, or next week, or even next month? Obviously nobody knows.
Of one thing I am quite certain. At some point it WILL!
In other words, class, on that great and terrible day when “Buy The Dip!” gives way to “Sell! Sell! Sell!” there will be no buyers at any price. Markets will collapse of their own weight. It will be too late.
But we’ll probably have a good warning here. As Chris pointed out the other day, that moment will probably not arrive until after a big second wave bounce.
Seeing a warning is a myth… in my opinion. Especially with the number moron momentum players at this moment in time as compared to the lead up into the 1987 event which I lived through and lost money.
Hey they are all going off that cliff… I am too! That is the extent of their thought process.
I am fully short right now and staying that way. I see what I see and that is my internal warning. I have seen it 1st hand before. I have no agenda!
If you looked at Lara’s historical charts of ’87, ’00 and ’08, you’d see in every case there were indications if not outright warnings. The nimble would not have been caught (IMO), and the nimble and aggressive would have made serious coin. I’m looking forward to her extracted lessons from these charts, because they are there. And they will be “here”, as well, sooner or later. And I intend to be both nimble and aggressive.
I viewed charts and indicators back then in real time as well… when your in the middle of it all (days before) things aren’t so clear.
What you think is unfolding just looks like minor correction in a strong up trending market (Sound Familiar?) in that case with fantastic fundamentals (now no where near that). In actually your conclusion would be to buy the dip (Before actual crash day)
When it does become clear, it’s too late to act on it.
Hindsight is 20/20.
Back then you were powerless to do anything as you had a hard time getting your orders filled.
That’s exactly why we study the past. To learn what indicators we’d better take seriously re: de-risking and potentially taking advantage. If you want to consider it a lost cause, that’s fine. Me, I’m always student, and my view is more knowledge and awareness and planning with objective triggers is a good thing. It’s the subjectivity that is death, because it leads to dismissing those indications and triggers, as you’ve have suggested tends to happen. If we’ve studied 3 market crash set ups and seen the same thing happen in all cases, and it’s starts happening now…well, can’t say we weren’t prepared and aware!! Of course there are no guarantees; to conclude trying will therefore be of no value is false logic.
My main point was… the indicators just before and during may not tell you the right thing to do (what & when to buy or sell)!
Doing back research is only conclusive with hindsight. NOT while you are going through it.
We shall see on the next one if it all works like you think it does. Remember, It all works until it doesn’t work anymore!
I see your point Joseph, and I agree. It is unfortunate that we can only study past examples and not the future. The past is all we have to go on.
I think the bit missing is emotion. When we’re right in the middle of it, our fear and greed dominate our thinking and can put us on the wrong side of the market very easily.
It will be my job to remain as dispassionate and unemotional as I possibly can. And I am learning that to do that it is best if I personally do not have a trade in the market at the time. Because that position will influence my emotion. I will want to see price move in my direction, hope and greed will factor into my judgement.
That is true. But my argument, ad nauseam, is that we have never been in this position in the markets before….ever! To assume price activity will be the same as it has unfolded in the past my well be a fatal assumption. Recall that at the last high it was something of a double top so we should not be too surprised that price and indicator activity somewhat mirrored the previous top at similar levels. This, it seems to me, is what everyone is failing to take into account!
Verne, what is the breakout point on the VIX currently?
At this moment up .64 to 11.80
VIX now +1.51 to 12.67
A move above 12 if not accompanied by a long upper wick is ominous for the vol short trades in my humble opinion Joe. What that would mean all the folk that reflexively jump like lemmings on the short side after every wick spike are now starting to turn into what I will now be calling “VIX Wussies!” Just to keep it polite you understand… 🙂
So it would be ideal if the VIX closes at or near the high today of 13.20
Yep! That would be free money! Even for giddy bulls with half a brain… 🙂
Verne,
Much appreciated as I have so much to learn from all the experienced folks on this board. I suspect markets will experience a panic selloff (might just be waiting for a bit of negative news from bell weather earnings report). The window for pullback has been condensed, hence we will see major rollover in the coming days or week. I expect all this to be sorted out by second week of November as traders start to line up for the yearly performance bonus coming holiday season. Maybe Amazon will rock the boat and cause the sell off that everyone has been waiting for..
Most welcome RR. I have certainly benefited over the years from a lot of folk with more far more experience that I who were willing to share what they knew.
Clearly that is not always appreciated so I am very happy if anything I post helps even one trader to benefit from some of the things I have learned along the way. Clearly I am not always right, but every now and then I just get that “feeling”… 🙂
(BTW you can always tell when that is happening as I will start posting trades that to some look ridiculous at the time, as you probably noticed!)
Care to guess?
NOW… Very SOON!
Surfs up today! no surf for us yesterday, it was a cross shore mush
But today I’m sitting here looking at some nice lefts peeling… right outside our Fale. Still a bit cross shore… but as soon as there’s enough water over the reef for safety we’re out 🙂
Where is Everyone!!
Extended One way markets (up) are very boring.