
A new all time high in the very first hour of Friday’s session confirmed that the upwards trend remains.
The Elliott wave target has not been met yet. Members are advised that the trend remains the same until proven otherwise.
Summary: The trend remains up. The best and safest way to make money in a trending market is to keep trades with the trend.
The classic technical analysis chart is very bullish. The daily chart is also overall bullish. The next target is at 2,614 – 2,616. Thereafter, if no deep pullback eventuates there, the next target is at 2,763.
Stops on long positions may now be pulled up to just below the last gap; if it is a breakaway gap, it should remain open for a long time. This price point is at 2,562.36.
Always trade with stops and invest only 1-5% of equity on any one trade. If trading a correction against the larger trend, then reduce risk to 1-3% of equity.
Last monthly and weekly charts are here. Last historic analysis video is here.
MAIN ELLIOTT WAVE COUNT
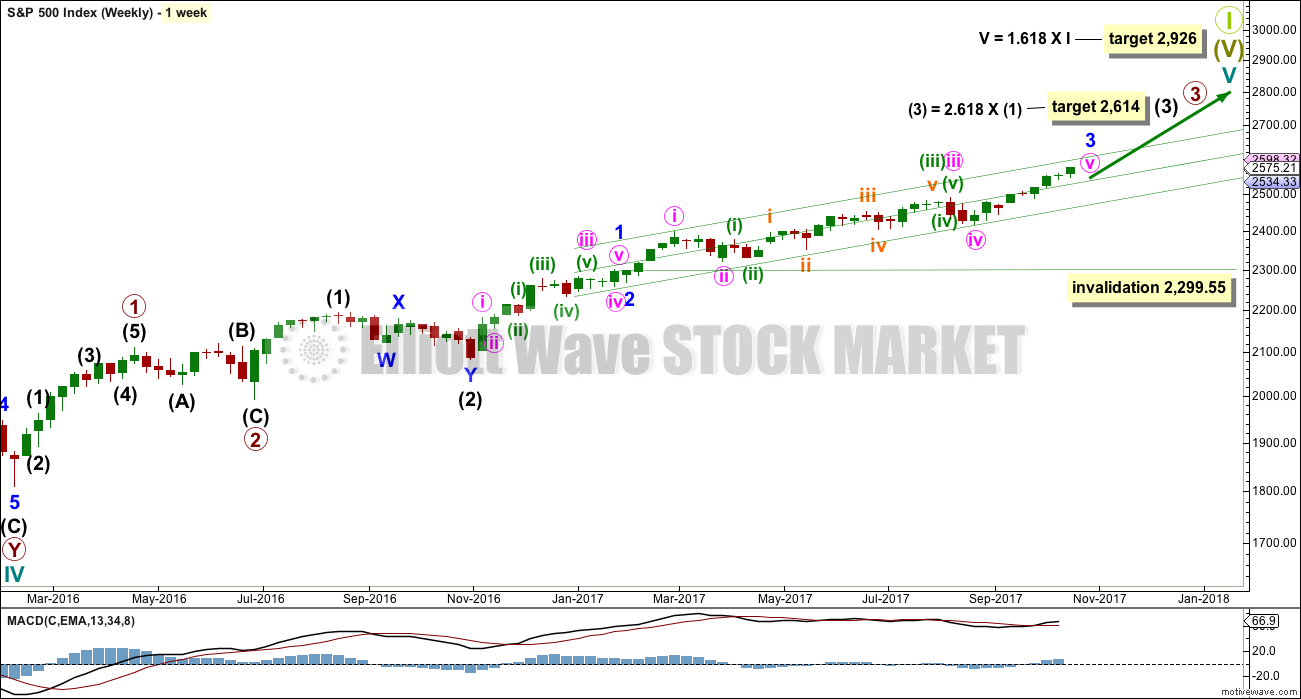
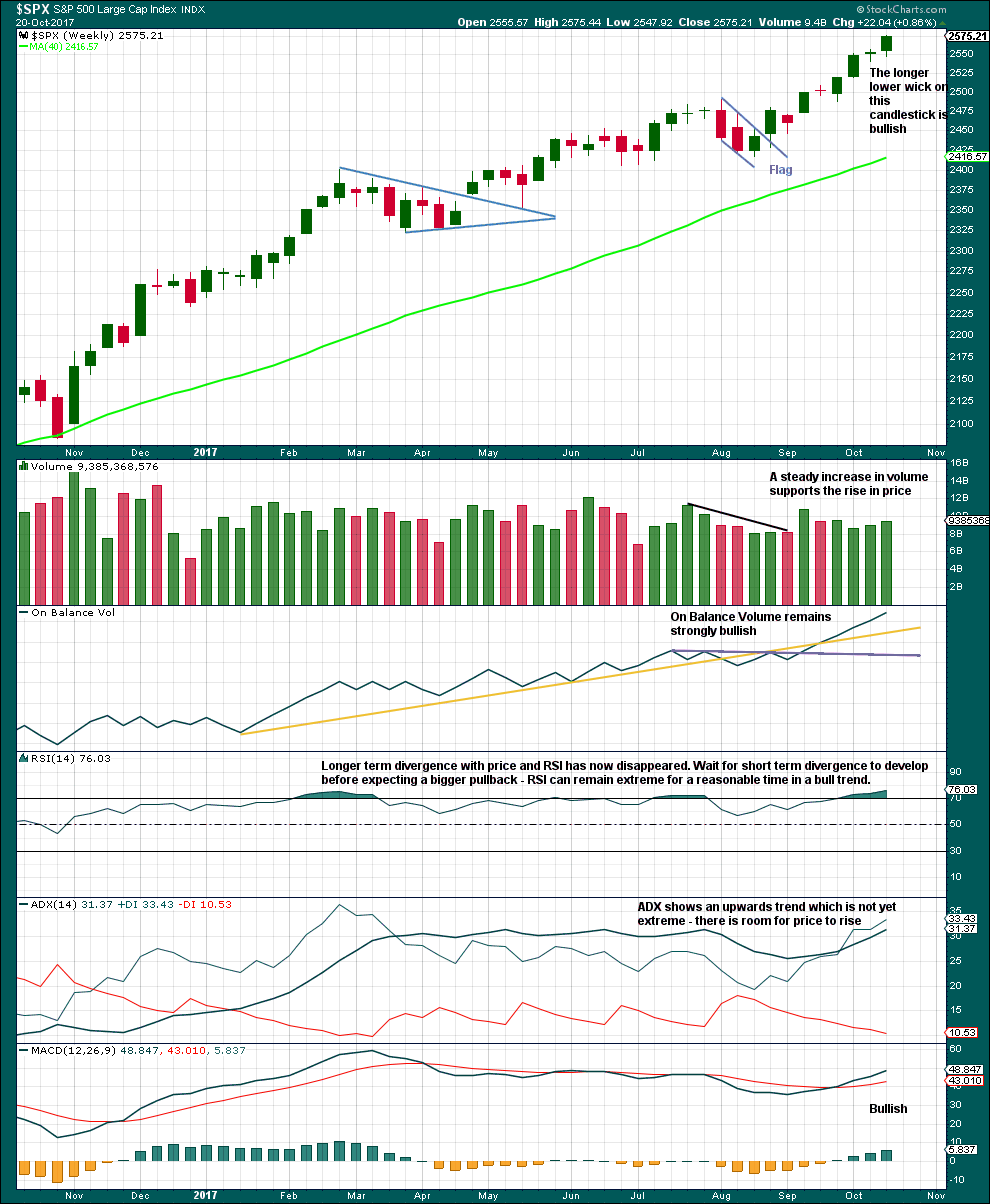
WEEKLY CHART
Click chart to enlarge.
This wave count has strong support from another bullish signal from On Balance Volume at the weekly chart level. While classic analysis is still very bullish for the short term, there will be corrections along the way up. Indicators are extreme and there is considerable risk to the downside still.
As a Grand Super Cycle wave comes to an end, weakness may develop and persist for very long periods of time (up to three years is warned as possible by Lowry’s for the end of a bull market), so weakness in volume may be viewed in that larger context.
Within minute wave v, no second wave correction may move beyond the start of its first wave below 2,417.35.
The next reasonable correction should be for intermediate wave (4). When it arrives, it should last over two months in duration, and it may find support about the lower edge of this best fit channel. The correction may be relatively shallow, a choppy overlapping consolidation, at the weekly chart level.
DAILY CHART
Click chart to enlarge.
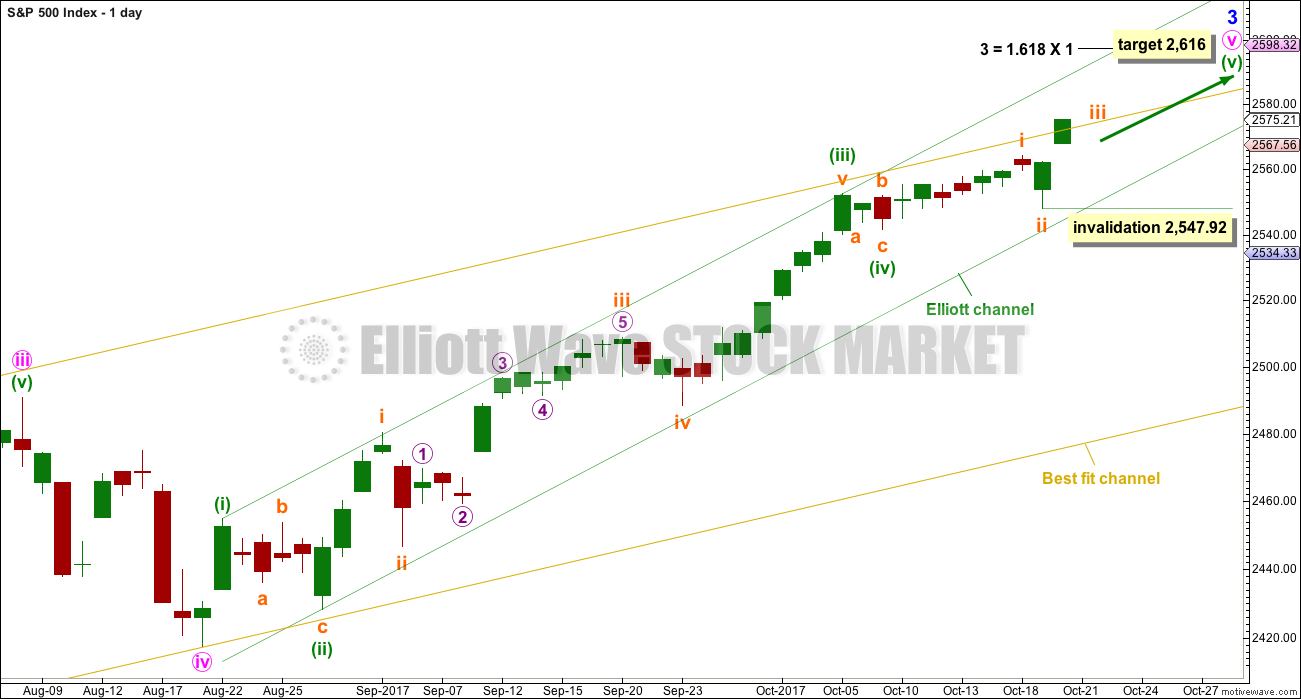
To see details of the whole of primary wave 3 so far see the analysis here.
Minor wave 3 may still be incomplete. This wave count is the main wave count because it has better proportion in terms of Elliott wave. When minor wave 4 does show up, it may last longer than just three days (minor wave 2 only lasted three days). A correction at minor degree would most likely show up at the weekly chart level.
This main wave count expects that minuette wave (v) is extending. Within minuette wave (v), so far subminuette waves i and now ii may be complete. Within subminuette wave iii, no second wave correction may move beyond the start of its first wave below 2,547.92.
Minuette wave (v) may end about the upper edge of the green Elliott channel.
When minor wave 3 is again a complete structure, then minor wave 4 may be expected to be a relatively shallow correction and last only a few days.
HOURLY CHART
Click chart to enlarge.
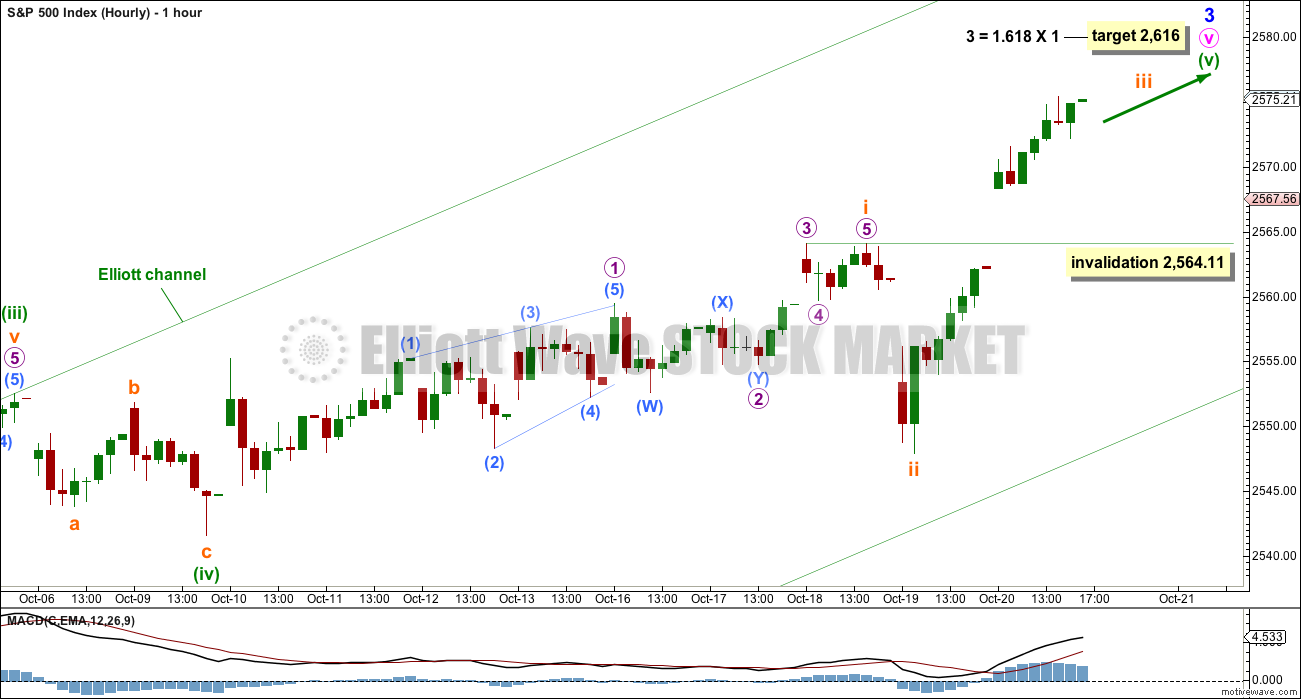
Subminuette wave i will subdivide as a five wave impulse. Subminuette wave ii may have been a very quick sharp zigzag.
Subminuette wave iii has exhibited a strong increase in momentum beyond that seen for subminuette wave i. When it is complete, then subminuette wave iv may not move back down into subminuette wave i price territory below 2,564.11.
ALTERNATE WAVE COUNT
DAILY CHART
Click chart to enlarge.
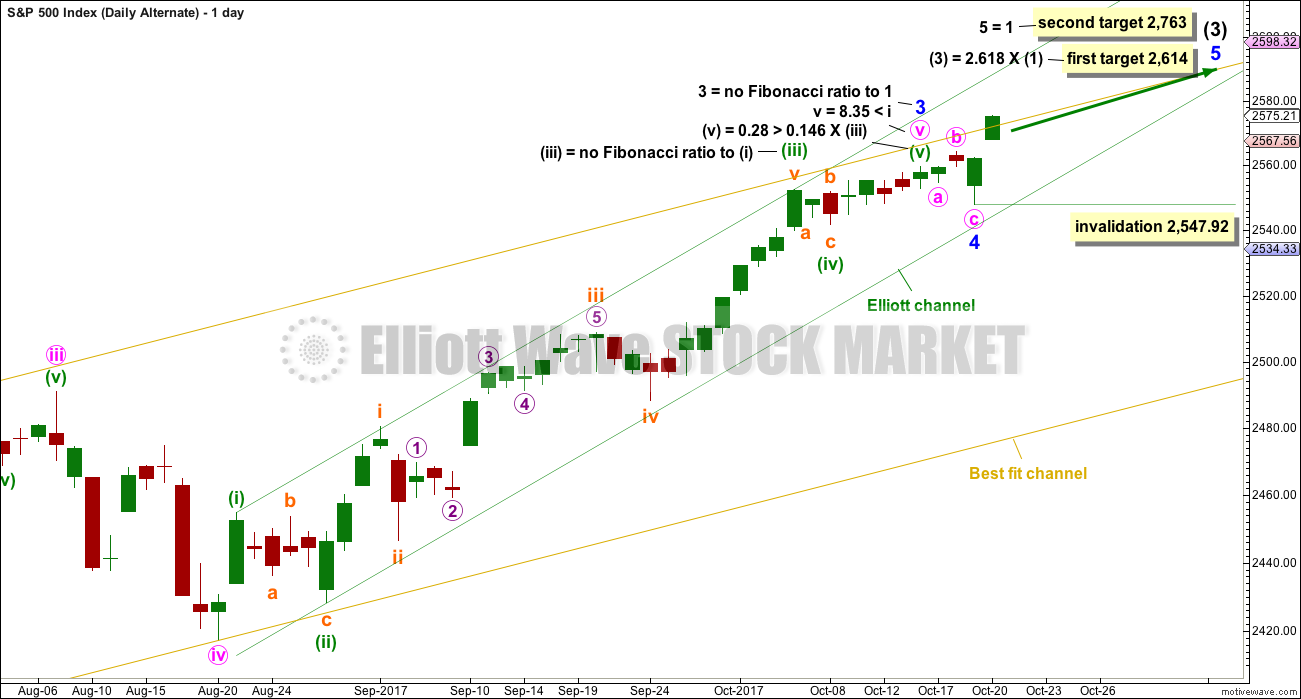
It is also possible that both minor waves 3 and 4 could be over.
My initial judgement was to label this as an alternate because of the brevity and shallowness of minor wave 4. This does not look right. However, there is still good alternation and good proportion with minor wave 2, which lasted only three days and was a zigzag. Here, minor wave 4 may have also lasted only three days and may have been a flat correction.
The first target is the same as it has been now for some time. A new second target is added at minor degree. If price reaches the first target and the structure is incomplete, or if price just keeps rising through it, then we may use the second target.
We should always assume the trend remains the same until proven otherwise. If this wave count is correct, then the low on Thursday was another opportunity to join the upwards trend.
Within minor wave 5, no second wave correction may move beyond the start of its first wave below 2,547.92.
This alternate wave count now does not differ from the main wave count in the expected direction nor much for the first target. The biggest difference will be in how deep and long lasting the next consolidation or pullback may be expected to be. This alternate expects an intermediate degree correction, which should last several weeks and may be up to about three months, whereas the main wave count only expects a small consolidation to last a few days.
HOURLY CHART
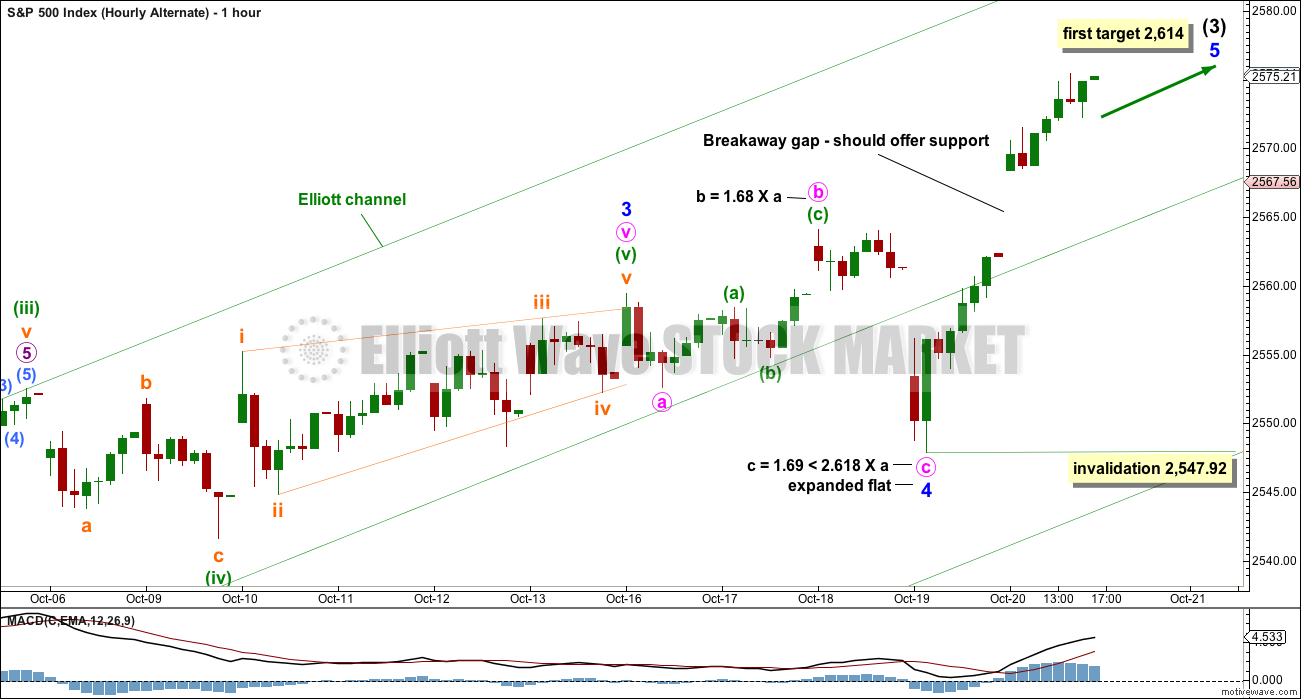
Click chart to enlarge.
Minute wave v may have been an ending contracting diagonal, which may have ended minor wave 3.
Minor wave 4, lasting only three days, may be an expanded flat correction. On the five minute chart, the downwards wave labelled minute wave c will subdivide as a five wave impulse with quick shallow fourth wave corrections at its end.
Have some confidence in this wave count if tomorrow sees another all time high. If that happens, then price is telling us that the trend remains up.
TECHNICAL ANALYSIS
WEEKLY CHART
Click chart to enlarge. Chart courtesy of StockCharts.com.
At the weekly chart level, the technicals this week look even more bullish than last week.
Longer term divergence with price and RSI does not appear to be very reliable; it has again disappeared. Like divergence with VIX and the AD line, divergence with price and RSI appears to be more reliable for the short term when it is clear and strong.
This chart is fully bullish. There is nothing bearish yet here.
DAILY CHART
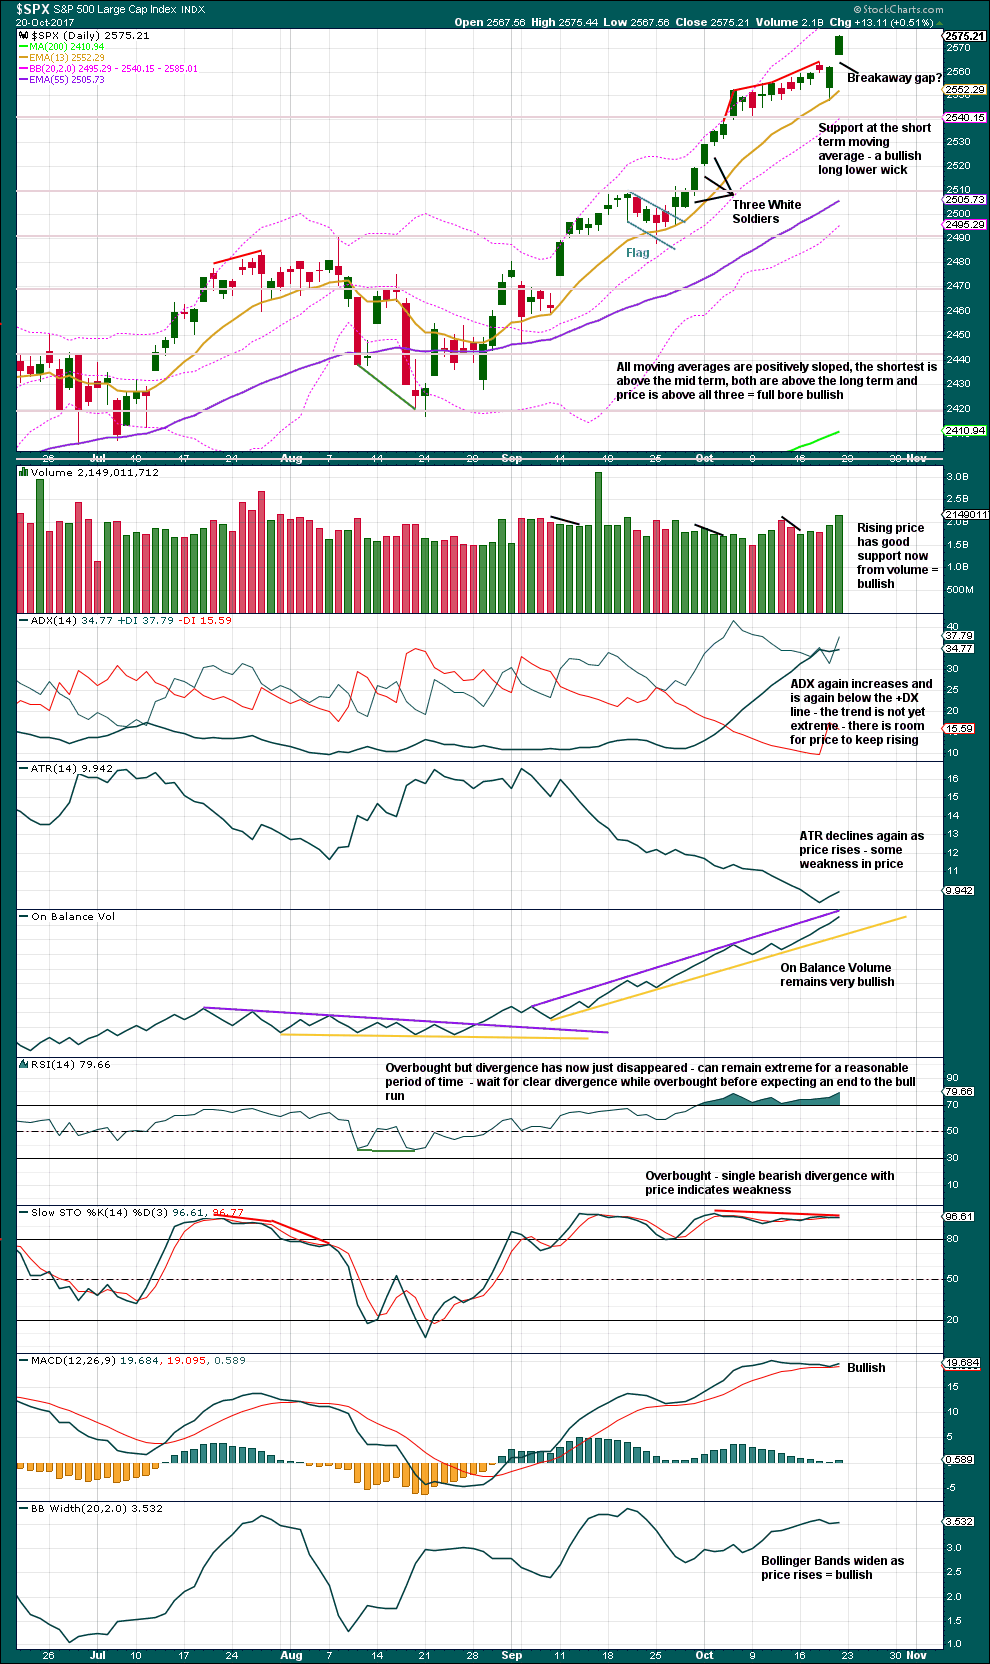
Click chart to enlarge. Chart courtesy of StockCharts.com.
Bullish: Volume, the last two daily candlesticks, ADX, On Balance Volume, MACD, and widening Bollinger Bands.
Extreme indicators: RSI and Stochastics. But these are not yet exhibiting the type of divergence that gives a strong warning of a trend change. They are not particularly good timing tools of a trend change either; they only sound warnings.
The trend is up. Use the breakaway gap for stops now.
Manage risk carefully. Invest only 1-5% of equity on any one trade.
VOLATILITY – INVERTED VIX CHART
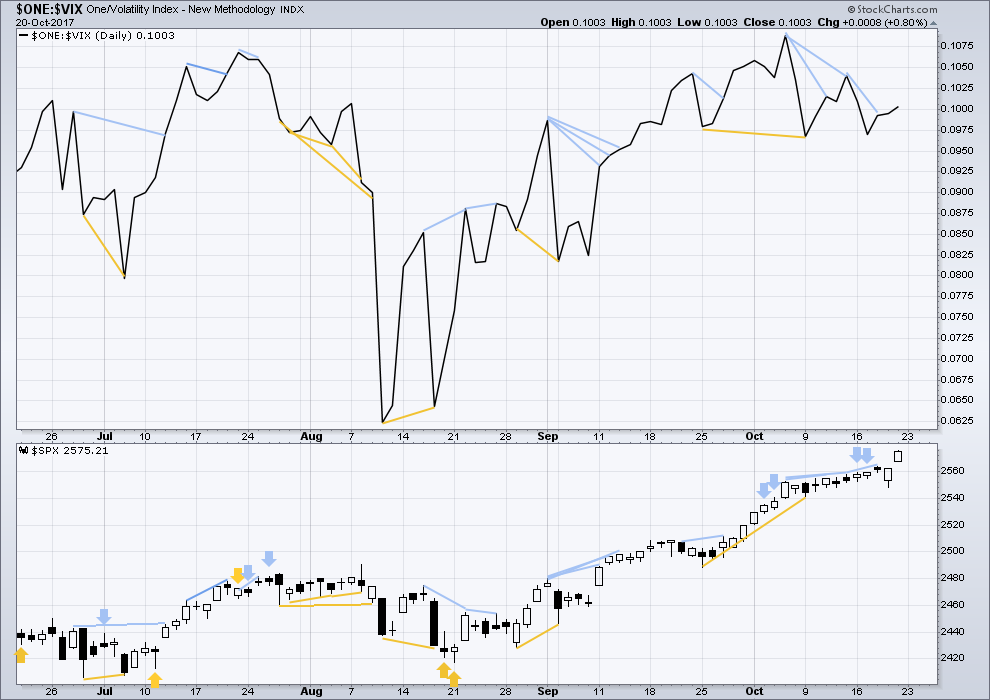
Click chart to enlarge. Chart courtesy of StockCharts.com.
Normally, volatility should decline as price moves higher and increase as price moves lower. This means that normally inverted VIX should move in the same direction as price.
Mid term divergence between price and VIX will be ignored; it is more often unreliable. For Friday price moved higher and volatility exhibited a normal decline. The rise in price has support from declining volatility.
BREADTH – AD LINE
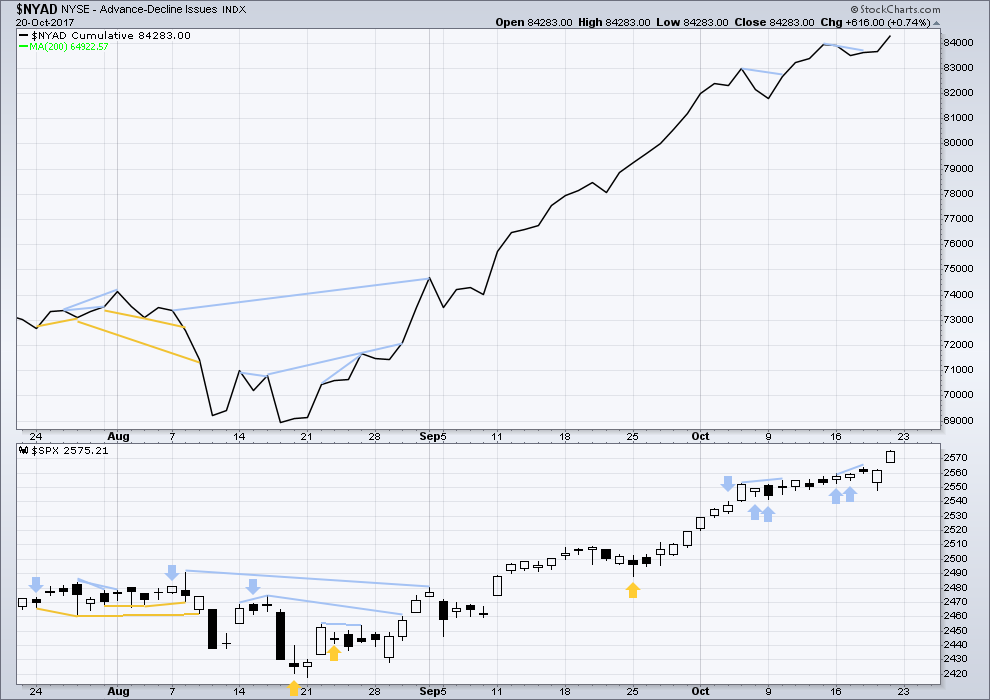
Click chart to enlarge. Chart courtesy of StockCharts.com.
With the last all time high for price, the AD line also made a new all time high. Up to the last high for price there was support from rising market breadth.
There is normally 4-6 months divergence between price and market breadth prior to a full fledged bear market. This has been so for all major bear markets within the last 90 odd years. With no divergence yet at this point, any decline in price should be expected to be a pullback within an ongoing bull market and not necessarily the start of a bear market.
Another upwards day comes with a new all time high for both price and market breadth. The rise in price has support from rising market breadth. This is bullish.
At the end of this week, small caps have failed to make a new all time high but mid caps have made a new all time high. So far small caps are issuing a small warning that there is now some weakness within market breadth.
DOW THEORY
At the end of this week, only the Dow Jones Transportation Average has not made new all time highs. The continuation of the bull market has not this week been confirmed. However, the Dow Jones Transportation Average is not far off its last all time high. If it does make a new all time high, then this analysis will be totally and fully bullish.
Failure to confirm an ongoing bull market should absolutely not be read as the end of a bull market. For that, Dow Theory would have to confirm new lows.
The following lows need to be exceeded for Dow Theory to confirm the end of the bull market and a change to a bear market:
DJIA: 17,883.56.
DJT: 7,029.41.
S&P500: 2,083.79.
Nasdaq: 5,034.41.
Charts showing each prior major swing low used for Dow Theory are here.
Published @ 07:19 p.m. EST on 21st October, 2017.
On the global political front, some interesting news coming out of China. A university professor with close ties to the defense industry is telling reporters that if Kim Jong Un launches another missile he will be “seeking his own death”.
Yikes!
Them are fighting words if ever I have heard any.
The Chinese are not bluffing either.
They are almost done building a seven lane superhighway right up to NK’s front door.
The DPRK is already in serious trouble facing mass starvation for not only the general population, but for the military as well, in addition to a harsh cold winter with nowhere near the supply of energy they will need to maintain even a minimum level of heating for their starving population. This is an incredible tragedy, and has to be laid at the feet of all the previous US leaders who foolishly appeased the deranged leaders of NK, rather than deal with the problem before it got to the point where literally millions of innocent lives are threatened by a madman. Kim is in trouble and in a no-win situation.
The Chinese have finally realized the worst possible scenario is for the US to have to deal with this problem, and that is would be infinitely better for them in the long run to take care of this lunatic. I would wager back channels to the Oval Office have been opened to inform Trump of their decision, and Kim is just that clueless that he will challenge the Chinese rather than inevitably loose face with his people if he backs down. We could also see a quiet and efficient coup engineered by Beijing and the “Rocketman” simply disappears. I think we are gong to see this thing resolved one way or the other in the next 30 days.
Have a blast Lara!
See ya on the waves! 🙂
🙂 🙂 🙂
It is entirely possible that we are gong to see some doubling down on shorting vol with a new 52 week low the next day or two. If that happens, I think it will be the buying opportunity of a generation for a long vol trade….these guys are not going gentle into that food night, I assure you.
Have a great evening all! 🙂
Verne, not to be curt but you have been declaring it the buying opportunity of a generation since March. Even if there is a new 52 week low, why would we expect a sustained jolt in volatility to follow? The 52 week low in July saw all time highs for a month after, then a brief “fire and fury” spike to VIX 15, and then downwards ever since. There is no conspiracy to keep volatility low. It’s just been a profitable trade especially when literally all the indicators are hyper-bullish. A new 52 week low is always possible but no more likely than it was last week.
I just hope you have tight stops on your “100% long” position today Jimmy.
Please go ahead and ignore me and trade what you see and I will do the same….deal? 🙂
BTW Jimmy , I don’t mean to be impolite but I go to great pains to explain why I think what I do, and even more than that, I put my money where my mouth is and make trades, many of which I post here, based on the opinions I post. Am I always right?
Of course not. No one ever is. If you fail to see, after the lengthy discussions some of us had on on the forum regarding why one might be bullish on volatility, I am afraid there is not much I can do to enlighten you, so we just have to agree to disagree, no hard feelings! All the best! 🙂
I just realized something hugely important. Leveraged short instruments are not going to start popping until people start liquidating ETFs so they very likely uncharacteristically going to lag the market. I was wondering why my TZA calls are going nowhere fast…..
Are we seeing a small fourth, with one more new high on deck? No count invalidation so far….
SPX has now joined Nasdaq and DJT in printing a bearish engulfing candle.
So interesting is it not?! What should we make of it folk?
Finally! VIX B bands starting to widen…. 🙂
loads of warring going on….. I’m a bit green on my huge IWM short, but I’m selling puts to hedge it a little.
LOL! I sold some TZA Jan 12 puts this morning against by huge short position with the same idea! 🙂
Chris, did you have a launch party this past week?
Hi Josh, no-Launch party for us last week.
Don’t underestimate candle stick patterns when the market is at a all time high or an all time low. Consider it as a developing spin on the money. But than again Mondays always start off slow.
I agree Raymond. I believe the bearish signs are indeed real.
HOWEVER, we also cannot underestimate the determination of the banking cabal to keep this market aloft. These guys have been game changers for years now and no reason to think they will stop now. If the market continues to tank in the face of their best efforts….Katy bar the door….! 🙂
I’m not going to underestimate it for sure.
That’s one clear bearish engulfing reversal pattern. Looks like another pullback or consolidation is about to begin.
Very frustrated with IYT trade. It is not doing squat so far. Really annoying! 🙁
SVXY has closed open gap and is now a short side buy. I am going to pass and focus on VIX. Tight B bands could offer a very good upside pop.
Selling half November VIX 9.00 strike calls for another 25% pop.
Will re-buy on any move back below 10.00….will roll remaining half with any move above 12.50…
Bearish call spread in the green. How deep will the move down go?
SPY 257.50 short calls down 40% but I think I will hold for break-even at 0.50 per contract…I may regret it but let’s see if they buy the dip. I will just take a small loss if they ramp it to the upside and recoup with long side of spread….
Wow! Thanks Lara. Lots of great food for thought in those charts!
You’re welcome 🙂
This market is really incredible. We now have Nasdaq today printing a bearish engulfing candle as DJT did about a week ago. These are universally agreed upon reversal candles when occurring after an uptrend as has been the case in both instances. Are we now to assume that like so many other market metrics, bearish candles are also now subject to the whim of the bankster cabal, to be negated at the mere push of a liquidity button??!!
Can somebody tell me what in tarnation is going on here??!! 🙂
And lastly, market conditions prior to the high in October 2007 prior to the GFC.
Weekly chart:
Daily chart:
AD Line:
Market conditions prior to the DotCom crash which began in 2000.
Weekly chart:
Daily chart:
AD Line:
So I finished the process of going back and looking at market conditions prior to 1987 crash, 2000 DotCom crash and the 2007 GFC. Here’s some charts.
I’ll leave commentary to what is on the charts for now.
I’ll be posting this as an article and a video on Thursday (my time). Trying to prepare some work beforehand to allow a bit more riding waves in the ocean 🙂
Lets start from the beginning. Weekly chart from 1987:
Daily chart from 1987:
StockCharts don’t have volume data for 1987.
But they do have an AD line for 1987. Here it is:
Updated hourly chart for you today:
Adding in a new smaller EW channel about minuette (v) in orange, subminuette iv now looks to be complete or may move a little lower. If it ends here then it would have nice alternation in depth with subminuette ii and there would be perfect proportion. It may find support about the mid line of the channel.
A final fifth wave up to the target. If subminuette v = subminuette i then the target would be 2,593. My target at 2,616 may be too high.
I’ll have a play with different degrees and different Fibonacci ratios to see if I can find a cluster for minor 3 to end.
If this analysis is correct then today presents another opportunity for a long position. It may not be a very long held one, as the next wave is a fifth wave, but it could still yield a profit.
I am still trying to figure out how we are going to get a normal correction with the kind of massive short vol positions now existing in the market. I think even as minor a correction as 5% is going to trigger some serious unwinding that will be demanded by risk managers because of the extremity of the explicit and implicit or so called synthetic shorts. This is somewhat beyond my pay grade but I am oh so curious….!
Yes, exactly… short gamma risk is credited with what made 1987 such a hell storm.
“Volatility is now an input for risk taking and the source of excess returns in the absence of value… the danger is that the multi-trillion dollar short volatility trade will contribute to a violent feedback loop of higher volatility resulting in a hyper crash.”
Thirty years ago, in 1987, we experienced that same moment when portfolio insurance created damaging short gamma event…. The gamma risk in covering short volatility would create a violent de-leveraging event where small correction could set up huge cascading losses.
https://static1.squarespace.com/static/5581f17ee4b01f59c2b1513a/t/59e8a9919f8dce26a3426eea/1508419991426/Artemis_Volatility+and+the+Alchemy+of+Risk_2017.pdf
Yes indeed DavidZ. Gamma risk is the farthest thing from the mind of most traders and is indeed why I completely stunned at what I am looking at….
I frankly am now starting to doubt I am ever going to get paid on my long vol trades. I just don’t see how this unwind can proceed in any kind of an orderly manner…
Here is another huge problem, it is going to be impossible to successfully cover the entire short volatility trade in the event of any kind of black swan event- there is not enough liquidity! Something, perhaps a lot of things, are going to simply implode. This is truly nuts!
Yes, the huge positions that will have to be unwound will stress everything. The explosion of volatility would go ever higher as trades fail, exactly like 1987! Even things as pedestrian as ETFs may be unable to track under the strain. With these sleepy markets, there are a lot of unseasoned options traders who do not acknowledge or respect the sting of Gamma!
This article has great insight into 1987 – and where we are today with $1.5 trillion of short volatility exposure. Holy Cow!
Artemis Capital:
Volatility and the Alchemy of Risk –
Reflexivity in the Shadows of Black Monday 1987
https://static1.squarespace.com/static/5581f17ee4b01f59c2b1513a/t/59e8a9919f8dce26a3426eea/1508419991426/Artemis_Volatility+and+the+Alchemy+of+Risk_2017.pdf
A lot of traders have been merrily selling naked puts to generate income and frankly doing so with great success for some time now. I have been looking at that and shaking my head in wonder and saying to some of them:
“Are you guys freaking nuts?!!!”
I was starting to get used to being laughed at for my consternation….
The careless ones are going to give back all those gains and then some….
will be buying back my 259.50 short SPY calls as soon as that trade is at break-even. The declines are being bought with a a kind of manic desperation I have never seen and I would be happy to get positioned at zero cost basis for the next move up. Gotta be nimble or get run over these days….!
SVXY quickly filled gap open from this morning. If it is indeed an exhaustion gap it should go on to fill the one from last Thursday as well. That may not happen though. Of late these immediate gap fills have not meant much with price powering higher after we have seen them. It is worth keeping an eye on though.
If we have a leading expanding diagonal 106.49 should fall shortly….
I am continuing to look at some details of the financial engineering of the last eight years and there are some interesting correlations. We are told that the FED’s balance sheet is comprised only of the most pristine of assets. Nonetheless I think is noteworthy that the notional value of corporate buy-backs of the last eight years is just about 3.8 T
S&P 500 is also now sporting some really spectacular numbers, viz. the forward 12-month PE ratio is 18, the 10-year average is 14. The 12-month trailing PE for Pro-forma earnings, which takes into account non-recurring items that seem to recur each quarter, is trading at 20 times earnings. On a reported earnings basis—the number you report to the SEC under penalty of the law and according to GAAP standards–the 12-month trailing PE is 25.5 times earnings ( according to Bloomberg). Market cap of equities is now a mind-boggling 140% of GDP and Bloomberg has noted that back in 1987 when we saw a better than 20% decline in the market in one trading session, that number was 66%…I could go on but I won’t bore you with numbers. After all, why bother about mean reversion? This time is different, right? 🙂
Note for caution, there is no general rule about the market pulling back because it went up too much, there is still room directly up. From my note taken, most analyst predictions for the S&P 500 this year is 2600 tops, only one analyst mentioned 2720, others are lower than 2500. The average dollar amount every year since the 2008 market crash in the S&P 500 is $231, right now we are up $322. As soon as price crystallizes clear and stops making new highs is a reason for concern considering the majority view is that this market hasn’t corrected in a while. Consider the gravity of the situation, entering the stock market half asleep can be like a nightmare. A temporary cure is the best buying opportunity that will emerge someday.
If trannies are tracing out an ABC correction, which makes sense based on the wave count in the other indices, we should get a C wave down next to finish the correction. Hopefully this would take IYT below 176.16 in the next few days and push those puts to around 1.75 for a small profit. Then again, that bearish engulfing candle could also have been one more massive head fake. This market is really full of surprises!
A move of DJI below 23,167.24 means we had an exhaustion gap and could signal a deeper correction on board…
I’ve got the RUT currently in a ii of a v, with the low a few days ago completing the iv, and last Thurs/Fri’s push up being the i of the v. Watching for a turn perhaps at the .618 around 1499.5, and I will be looking to get long as the iii of the v kicks off. Anyone see it differently?
Kevin I am no expert, but when you post a wave count, it is helpful to see whether or not other indicators support your wave labels; things like volume, RSI, MACD, and stochastics.
You are free to do a full work up if you are interested. Since in all likelihood no one here is interested, I’m not going to that level of effort, except in so far as I deem it necessary for myself. Thanks for your suggestion.
No problem. I took a quick gander and it did not look like the start of a third wave up…we have also intruded into a former gap area…I could be wrong though….it may provide support….
It’s kinda hard to see if your labelling it 1-2-3 fits without putting it into the bigger picture, one time frame upwards.
EW is really fractal.
But yeah, that looks legit in terms of subdivisions. The (iv) down looks like a double zigzag.
Selling the SPY Nov 257.50/259.50 bearish call credit spreads for credit of 0.70 per contract, 50 contracts. I am expecting a very shallow fourth wave correction as we have seen repeatedly, followed by one final wave up. We should normally see a 0.382 retracement for a fourth wave correction but the ongoing buy the dip frenzy is now at mania levels and will no likely continue into the final wave up…
For the first in a very long time I am tempted to use margin in my trading accounts…but I won’t…not yet…. 🙂
I am staying Fully Short and if I had more availability of funds, I would add any and all to my short here.
Adding to IYT November 175 puts to lower cost basis to 1.50…
Looking for SVXY move below 106.50
Lets take a vote: Yea or Nay?
Despite a record run for the markets it can adjust and price itself differently if the Tax Reform gets delayed. Unable to get taxes done this year means the administration will have to wait another year or more for tax reform after just months of routine planning of tax reduction. Saudi Arabia’s Prince Alwaleed announced today on CNBC that the market will correct if tax reform plan gets delayed. A net worth of around $20 Billion, I’ll say he knows something or two about money and politics. Every measure should be taken and to think here in America tax reform will get done in a few months is overseeing the principals of American politics. Last Thursday night the Senate passed the GOP budget proposal which struck many especially the Democrats. Republicans who vote for the tax plan also has to worry about the debt thats developing here in the USA. Obviously, there are issues with reforming the tax code and paying down the debt. Everyone is rooting for Washington to effectively get tax reform done this year, who here says it will get done this year?
Nay.
My reasoning is the Obama led Democrat resistance and obstruction to anything President Trump attempts.
I think not. Too many disparate agendas competing…
I’m not rooting for a massive tax cut for the extremely wealthy in the USofA. Not by a long shot. That said, something will probably happen, because our politics are so corrupt.
It gets done this year but is not retroactive to Jan 2017 and is already priced into the Markets.
What should be added to Tax reform is the elimination of Stepped Up Basis and the Charitable Deduction should be Capped at $25,000 for cash and appreciated assets.
If people are truly generous… they will give anyway… no reason to give a tax break for this.
These are the biggest tax shames that only benefit the rich & wealthy. If eliminated and some rich stop giving than those are the slim, fake charitable people.
Good morning!
I think we are close to completing a wave up at minor or intermediate degree so a fourth wave should be on deck. Since I trade options, I try to get positioned just a bit ahead of the wave turn to take advantage of cheaper premiums. How deep the fourth wave goes will give some clue as to what degree we are at. I have an initial batch of VIX calls and will be adding to it if we make a new low, or rolling it if we cross 12.50 to the upside. I plan to trade the fourth wave with a bearish call credit spread that gets me positioned for the final wave up when wave four completes which in addition to Lara’s guidance, should be confirmed by VIX price action. Have a great day and week trading everyone! 🙂
ps If this fourth wave turns out to be a triangle I think it would suggest we have a higher degree wave developing
Verne,
I was reading a Hurst cycle analysis over the weekend and some are predicting base don hurst we are at or close to the top with down move starting and lasting till 2019 when SPX will be around 1600. Do you follow Hurst or any other analysis besides the EW?
I do. Many of them, not only Hurst and Gann, hsve been quite erratic this year with critical turn dates showing little or no correlation with market direction so I pay less attention to them these days.
Hurst analysis is really quite epic in my opinion. It is nice to use in combination with EWT, and DOW Theory.
I don’t see any count by Lara that indicates price is about to start a minor 4 or an intermediate 4. Can you show what count you are using that indicates that?
Both counts indicate either minor three or intermediate three waves completing. If that is correct the next corrective wave would be a fourth wave. I am planning my trades based on the weekly chart so you may be looking at a smaller time frame is all I can surmise from your question.
I got it, yes on the weekly “the next” new wave is a minor wave 4. Might be a week or even several away. Thanks.
If I needed anything to bolster my confidence in Lara’s count, and not that I did, I just got it!
Hochberg and company over at EWI are calling a top in this market. They are adamant that the bull market is over, and they are making that call based on what I think is an erroneous wave count and a reliance on the present extreme sentiment to do so. While I think we are probably on the thresh-hold of some kind of fourth wave correction that could end up being quite deep, especially if we are tracing out an ED, the fact that EWI is calling a top is in my humble opinion prima facie evidence that we DO NOT have a top in this market. I was a subscriber for many years and believe me when I tell you, the way I eventually made money was trading the opposite of what their counts called for. I mean them no dis-respect, but I think they are probably going to cost their readers who do not do their own due diligence a lot of money with another bone-headed call.
I for one am sticking with Lara’s analysis!
Hi Chris:
I had a quick question about how your risk desk plans on handling the contingency of possible failure of your fund’s custodian during the melt-down. I know you cannot reply on the forum but I can send you my e-mail address if you some ideas you can share. While I think we are right about the risk exposure, I doubt those of us who see it will be able to fully capitalize as some of those trades are never going to get paid!
You probably have already read this Artemis discussion of the volatility situation but I am putting up the link for others that might be interested in what we often discuss in this regard. The PDF is called Volatility and the Alchemy of Risk.
https://static1.squarespace.com/static/5581f17ee4b01f59c2b1513a/t/59e8a9919f8dce26a3426eea/1508419991426/Artemis_Volatility+and+the+Alchemy+of+Risk_2017.pdf
Good morning Verne, please have Lara provide my email or vice versa. That piece was fantastic, but ironically or sadly, that’s just the tip of the iceberg. Also, we have 4 custodian’s, our own DMA’s and APIs so I can pull the positions away from the exchanges. Your concern is why I will be positioned prior to the beginning. During the 3rd of 3 down is where would have trouble exiting gains IMHO.
Thank you for posting this, Verne! A detailed read, but most enlightening as to why we haven’t seen the big washout yet. And how disasterous it will be for many when it comes.
Yowza!
The above chart displays a historic extreme in the short vol trade. Everyone is literally on the same side of the ship. When that happens, the ship usually capsizes….!!! 🙂
Am I missing something here??!!
Holy cow! Thanks for that chart Verne. It displays well what you have been telling us for the last year or more. Wow.
You’re not wrong there are you Verne.
That’s pretty compelling.
My question would be… how long can these extremes persist for before a turn?
To be honest, as a fairly keen watcher of vol I never thought they would persist as long as they have….yet, here we are!
I guess this could go an awhile, but I am guessing the longer it does, the more spectacular will be the denouement…you see? I am so confused I am now starting to think in French! 🙂
First!
I know, I know, that’s not exactly fair is it. But.. I do have an announcement for those members who don’t watch the video.
I’ll be travelling again next week, this time to Tonga. After the first analysis for the Monday session is published I’ll fly out. The time zone is the same as NZ and we should have a reliable internet connection (we also have a back up) so there should be no interruption to your analysis. I’ll still be able to post a chart update before each NY session closes.
I’m staying in a surf resort with a bunch of other surfers from Managahwai, we’re invading Tonga! My plan is to surf my little heart out 🙂
The surfing Grandma! Awesome.
Have fun and be safe.
(Note: this will be the last grandma joke. I promise.)
I’m jealous as heck; surf until noodled, and beyond!! With lots of sunscreen.
LOL Rodney 🙂
Yep. Noodle arms here we come! Some warm water after a NZ winter will be really nice.
And a group of 9 of us local surfers… all together… good times will be had.
I have some Stream 2 Sea sunscreen that has been tested to be non toxic to marine life. Looking after the planet one surf at a time.
Surf’s up! 🙂
Hiya Doc! Did I miss anything?!
Dude!!!! Such good waves clustered right offshore the village!! Water has a slight chill so bring a shortie. You’ll get barreled for sure!! Have a blast, I’m jealous!!
🙂 The Pacific thinks it’s a lake again here in Mangawhai, so I’m stoked to get some actual waves 🙂