
Bearishness between price and market breadth, VIX and RSI was the harbinger of a pullback that occurred during Thursday’s session.
Two Elliott wave counts illustrate now two possibilities for next movement, and classic analysis is used to determine the probability of each scenario.
Summary: The trend remains up and would be confirmed if price makes a new high tomorrow above 2,564.07. If that happens, then use the first target at 2,614, with a second target at 2,763 now.
A new low below 2,547.92 would now indicate a deeper and longer lasting pullback has arrived. Use the new best fit channel on the main daily chart to show where price may find support.
Always trade with stops and invest only 1-5% of equity on any one trade. If trading a correction against the larger trend, then reduce risk to 1-3% of equity.
Last monthly and weekly charts are here. Last historic analysis video is here.
MAIN ELLIOTT WAVE COUNT
WEEKLY CHART
Click chart to enlarge.
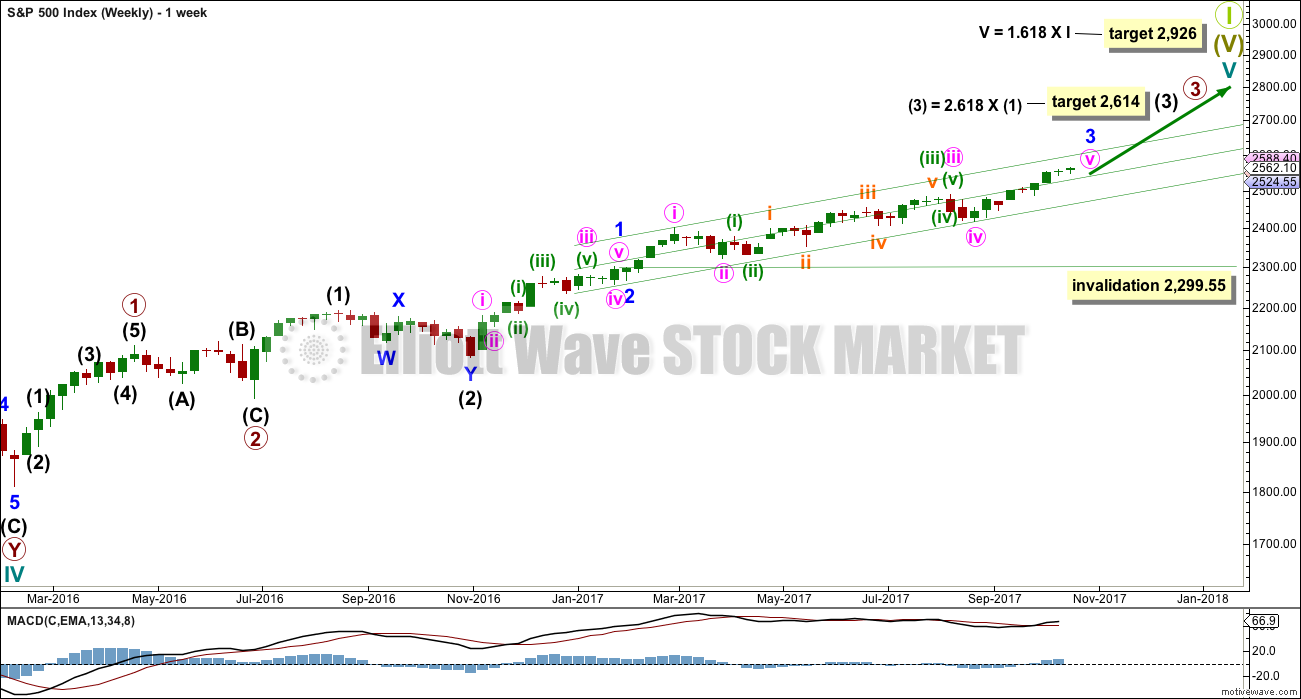
This wave count has strong support from another bullish signal from On Balance Volume at the weekly chart level. While classic analysis is still very bullish for the short term, there will be corrections along the way up. Indicators are extreme and there is considerable risk to the downside still.
As a Grand Super Cycle wave comes to an end, weakness may develop and persist for very long periods of time (up to three years is warned as possible by Lowry’s for the end of a bull market), so weakness in volume may be viewed in that larger context.
Within minute wave v, no second wave correction may move beyond the start of its first wave below 2,417.35.
The next reasonable correction should be for intermediate wave (4). When it arrives, it should last over two months in duration, and it may find support about the lower edge of this best fit channel. The correction may be relatively shallow, a choppy overlapping consolidation, at the weekly chart level.
DAILY CHART
Click chart to enlarge.
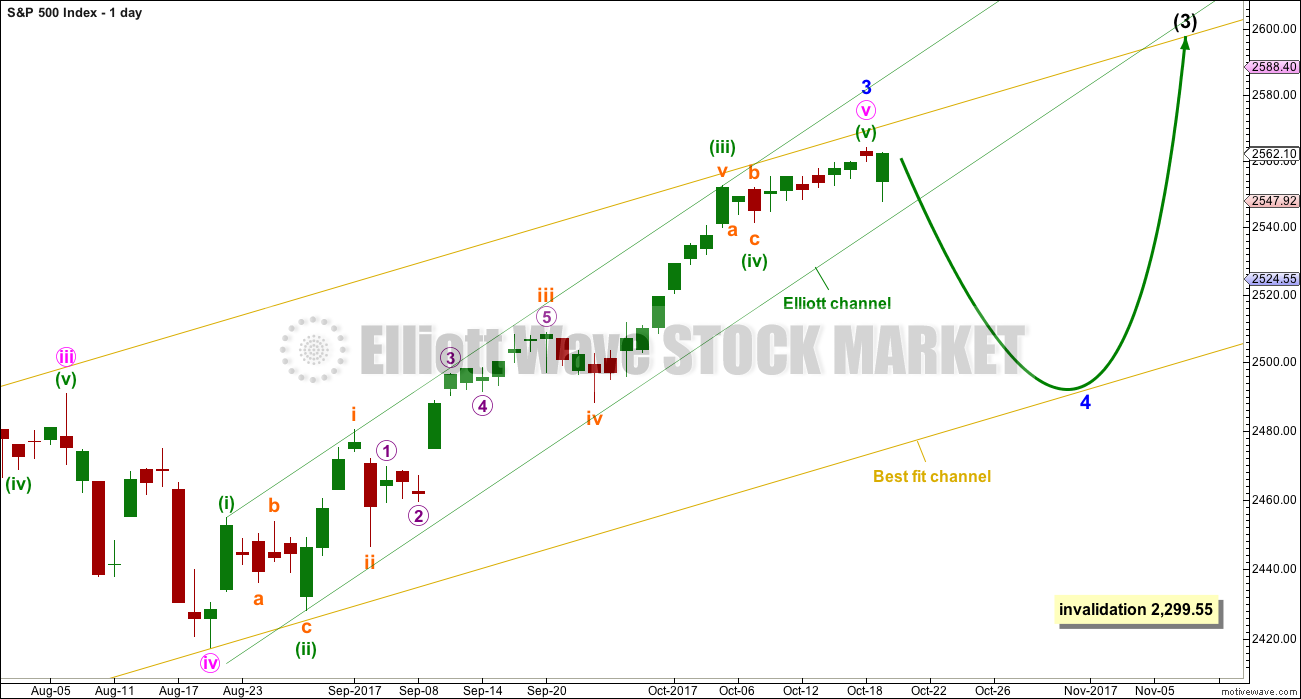
To see details of the whole of primary wave 3 so far see the analysis here.
Minor wave 3 may possibly be over and minor wave 4 may have begun today. If price breaks below the lower edge of the green Elliott channel, that would add substantial confidence to this wave count.
A yellow best fit channel is drawn about all of minor wave 3. Minor wave 4 may find support about the lower edge.
Minor wave 2 was a very shallow 0.15 zigzag lasting only three days. Given the guideline of alternation, it should be expected that minor wave 4 would most likely be a flat, combination or triangle. It should also be shallow; if it were to be deep, it would move too far below channels and the wave count at the weekly time frame may not then have the right look.
Minor wave 2 was remarkably brief at only three days; it was more brief than minute waves ii and iv one degree lower. Sometimes this is how impulses in the S&P unfold. Minor wave 4 would still be likely to be longer lasting than just three days for the right look overall.
While this is labelled the main wave count today, it may actually have a lower probability than the alternate. Also, we should always assume the trend remains the same until proven otherwise. A new low now below 2,547.92 would add confidence to this wave count.
HOURLY CHART
Click chart to enlarge.
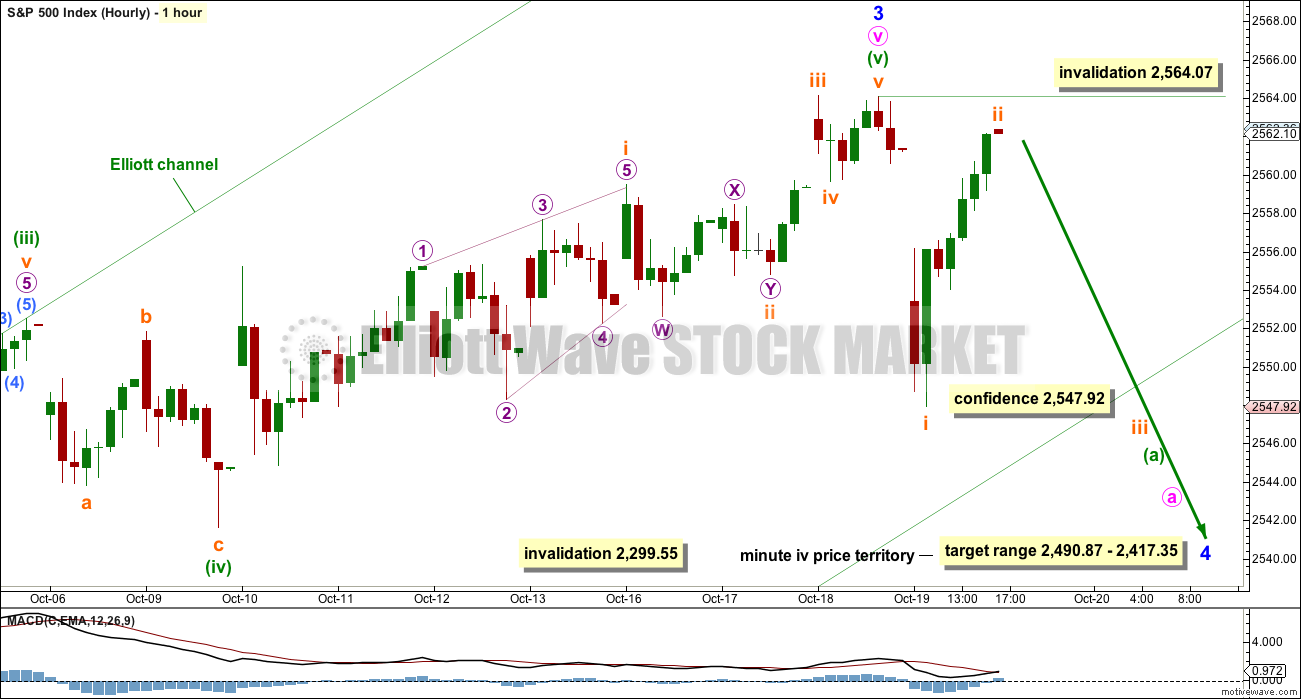
It is possible just to see the structure of minute wave v to end minor wave 3 as complete.
If minor wave 4 has begun, then it should first unfold with a five down at the hourly chart level. That would be incomplete. While that is incomplete, subminuette wave ii may not move beyond the start of subminuette wave i above 2,564.07.
Minor wave 4 may end within the price territory of the fourth wave of one lesser degree, minute wave iv.
ALTERNATE WAVE COUNT
DAILY CHART
Click chart to enlarge.
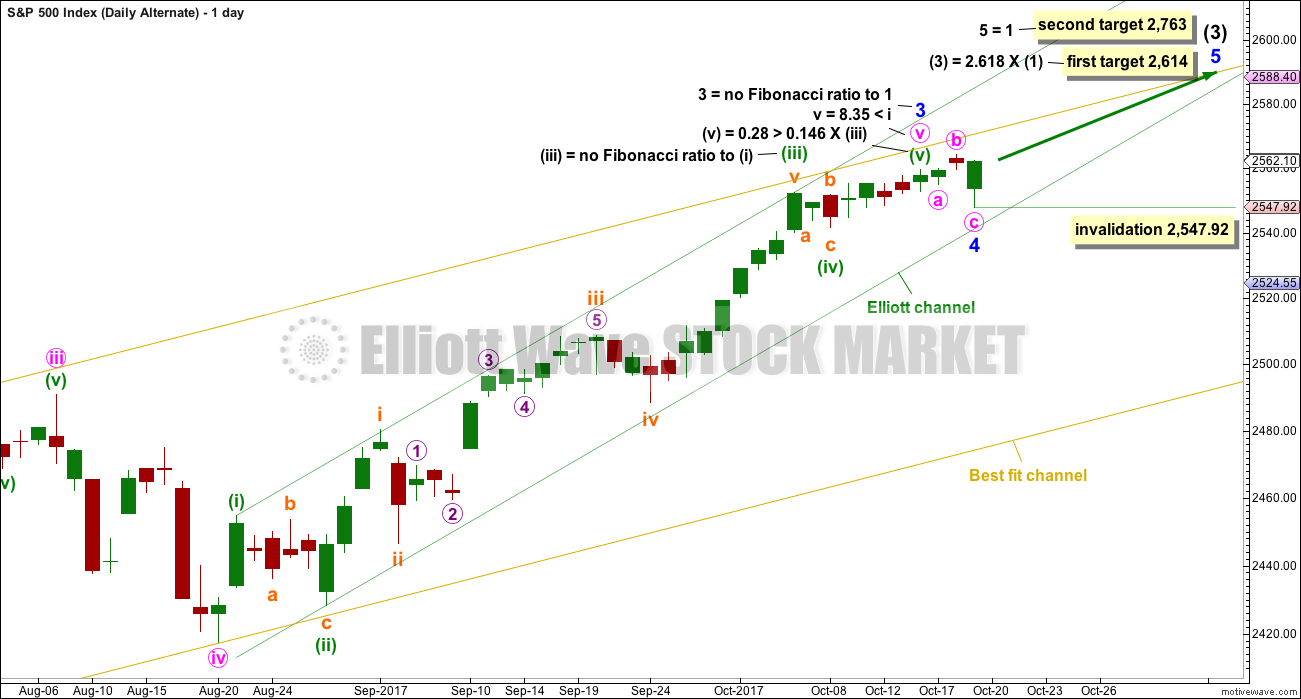
It is also possible that both minor waves 3 and 4 could be over.
My initial judgement was to label this as an alternate because of the brevity and shallowness of minor wave 4. This does not look right. However, there is still good alternation and good proportion with minor wave 2, which lasted only three days and was a zigzag. Here, minor wave 4 may have also lasted only three days and may have been a flat correction.
The first target is the same as it has been now for some time. A new second target is added at minor degree. If price reaches the first target and the structure is incomplete, or if price just keeps rising through it, then we may use the second target.
We should always assume the trend remains the same until proven otherwise. If this wave count is correct, then the low today was another opportunity to join the upwards trend.
Within minor wave 5, no second wave correction may move beyond the start of its first wave below 2,547.92.
HOURLY CHART

Click chart to enlarge.
Minute wave v may have been an ending contracting diagonal, which may have ended minor wave 3.
Minor wave 4, lasting only three days, may be an expanded flat correction. On the five minute chart, the downwards wave labelled minute wave c will subdivide as a five wave impulse with quick shallow fourth wave corrections at its end.
Have some confidence in this wave count if tomorrow sees another all time high. If that happens, then price is telling us that the trend remains up.
TECHNICAL ANALYSIS
WEEKLY CHART
Click chart to enlarge. Chart courtesy of StockCharts.com.
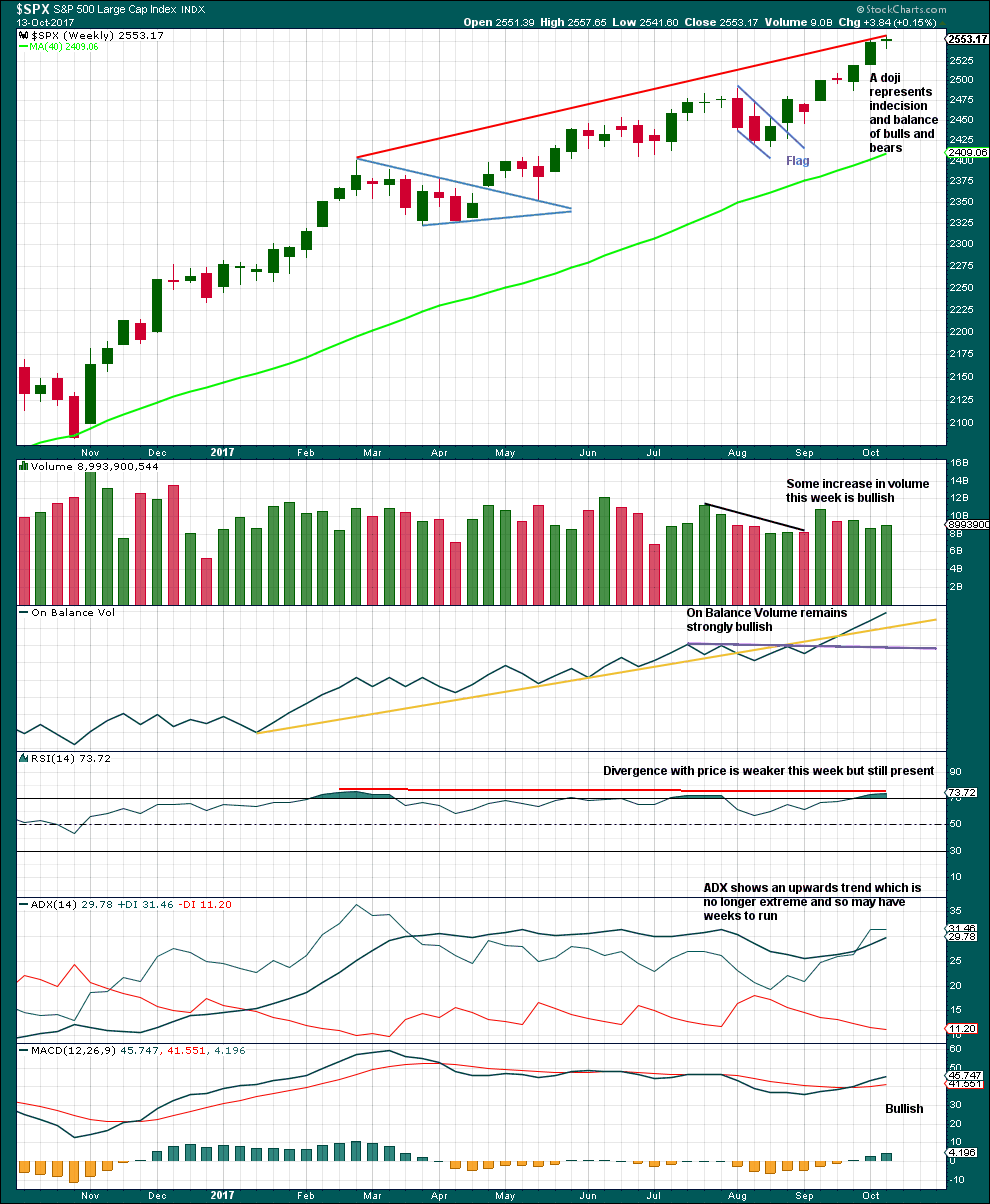
Again, this week this chart remains very bullish. A doji on its own is not a reversal signal, and doji may appear as small pauses within upwards trends.
RSI is overbought and exhibits longer term divergence with price, but not short term. If short term divergence develops, then a pullback would be more likely. RSI may move higher to further overbought and may remain there for a reasonable period of time during a strong bull trend in the S&P500. On its own, it does not mean a pullback must happen here and now; it is just a warning at this stage for traders to be cautious and manage risk. Overbought conditions mean the risk of a pullback is increasing.
DAILY CHART
Click chart to enlarge. Chart courtesy of StockCharts.com.
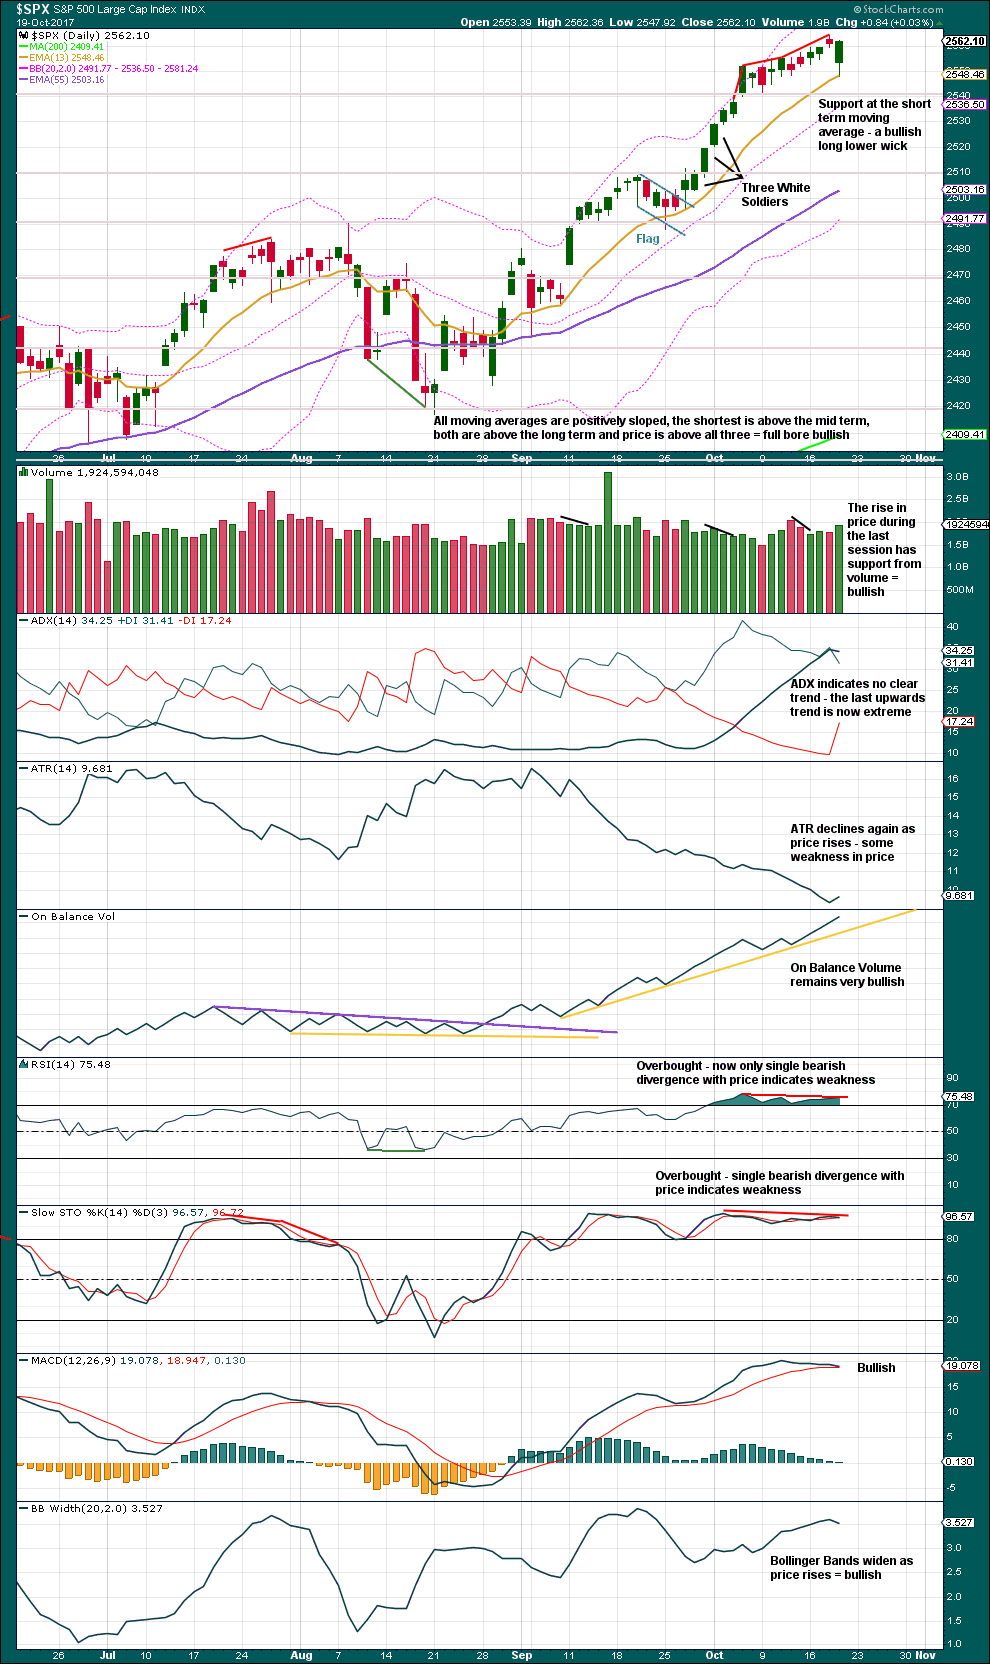
There is no candlestick reversal pattern here on the daily chart.
Bullish: Moving averages, volume, today’s candlestick, On Balance Volume, MACD and Bollinger Bands.
Extreme indicators giving warning signs: ADX, ATR, divergence with RSI and divergence with Stochastics.
The safest approach to this market may be to assume the trend remains the same, which is upwards. But manage risk and be aware this market is susceptible to violent pullbacks as indicators are now extreme.
Pullbacks should be used as an opportunity to join the upwards trend.
VOLATILITY – INVERTED VIX CHART
Click chart to enlarge. Chart courtesy of StockCharts.com.
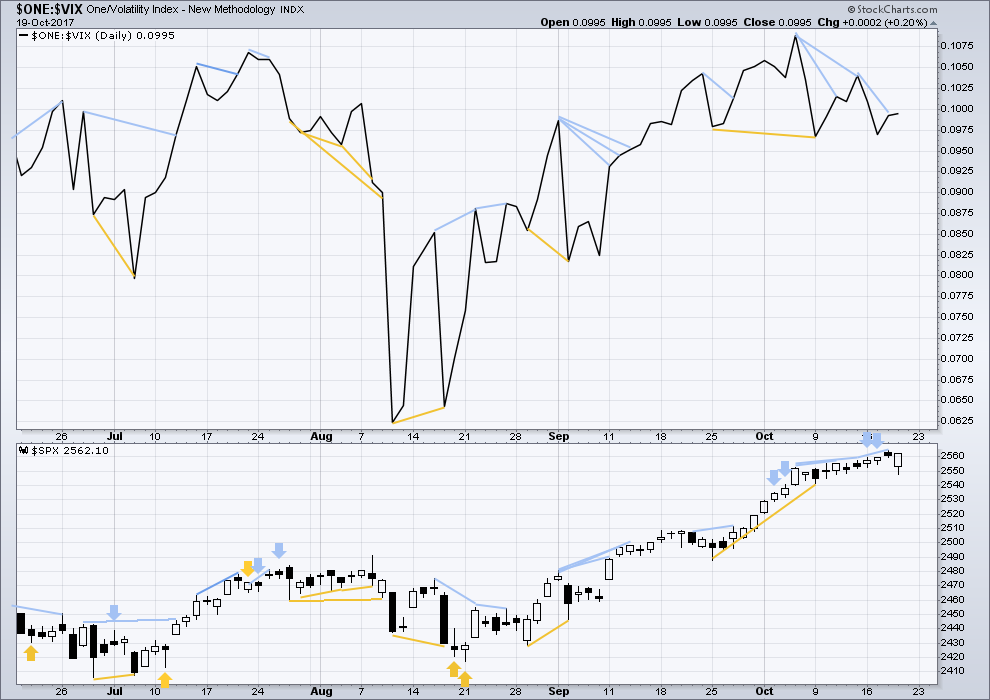
Normally, volatility should decline as price moves higher and increase as price moves lower. This means that normally inverted VIX should move in the same direction as price.
A downwards day may have resolved prior bearish signals from VIX, or it may need one more day to be resolved.
The balance of volume today was upwards and the candlestick was green. Upwards movement during this session came with a normal corresponding decline in volatility to support it.
BREADTH – AD LINE
Click chart to enlarge. Chart courtesy of StockCharts.com.
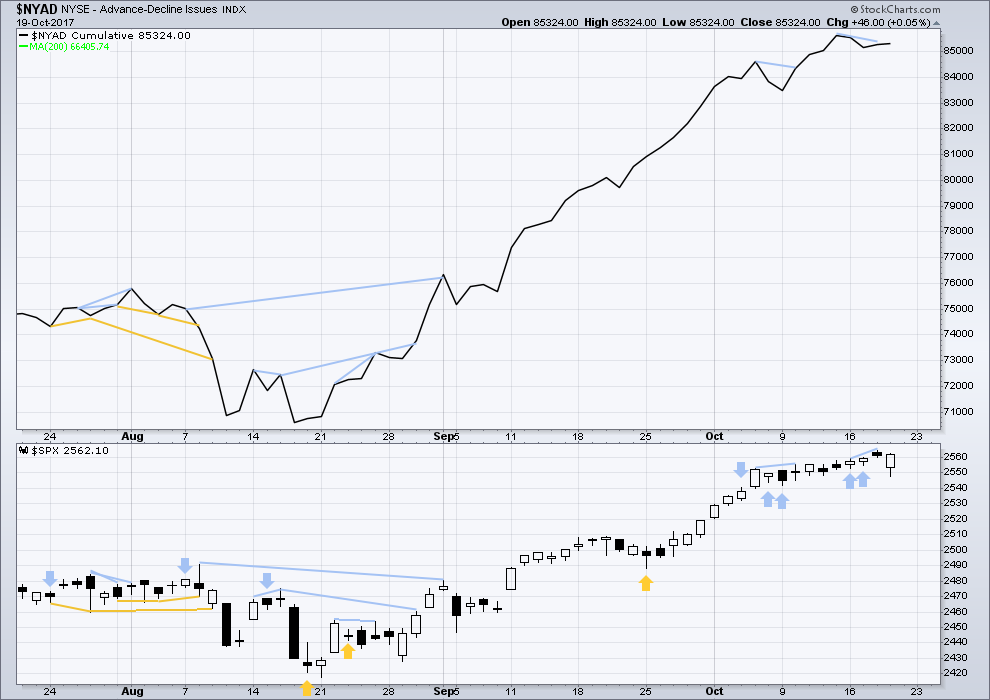
With the last all time high for price, the AD line also made a new all time high. Up to the last high for price there was support from rising market breadth.
There is normally 4-6 months divergence between price and market breadth prior to a full fledged bear market. This has been so for all major bear markets within the last 90 odd years. With no divergence yet at this point, any decline in price should be expected to be a pullback within an ongoing bull market and not necessarily the start of a bear market.
A downwards day may have now resolved prior bearish signals from the AD line, or one more downwards day may be needed to resolve this.
The balance of volume today was upwards and the candlestick closed green. The AD line shows a very slight increase which supports upwards movement during this session. This is bullish, but only very slightly so.
Small, mid and large caps have all made new all time highs. The rise in price is supported in all sectors of the market.
Go with the trend. Manage risk.
DOW THEORY
All the indices are making new all time highs. The continuation of the bull market is confirmed.
The following lows need to be exceeded for Dow Theory to confirm the end of the bull market and a change to a bear market:
DJIA: 17,883.56.
DJT: 7,029.41.
S&P500: 2,083.79.
Nasdaq: 5,034.41.
Charts showing each prior major swing low used for Dow Theory are here.
Published @ 11:05 p.m. EST.
I do believe following technicals only 90% of the time is a great way to trade the markets both short and medium term… but it’s not a 100% certainty or infallible!
Especially when equity valuations (by any long-time proven metric) are so far removed from any sense of reality. With Fixed Income markets sending completely different signals + other in previous posts.
I am as of Friday and will remain fully short.
You’re right of course. There is absolutely nothing in technical analysis which is 100% certain. Nothing.
I wish there was. It would make my job so much easier, and we’d all be multi-millionaires. If not billionaires.
I’m going 100% long on Monday morning. There is nothing to stop this market in the near term. Attempting to time swings or go long on VIX is pointless when there is only one direction: up. Unless you can time a random overnight downturn 10 point downturn that disappears in the first hour of trading there is no point in doing anything but going long.
On the other hand, now that I’ve decided to be 100% long, perhaps I will singlehandedly end the insanity and the break the bull market.
I got a chuckle out of this. Trailing stops are your friend.
Cheers!
This is really too funny. I actually sold my final long position at the close today as I assumed Lara was right and I was wrong about being bearish. All 30 222 strike
DIA calls expiring tomorrow which I opened six weeks ago just in case. I am now quite content to stand aside and continue to slowly accumulate long vol positions 90 days out, and scalp short term volatility. Buying VIX under 10.00 and selling on upswings has been a great trade, your own pessimism notwithstanding about the benefits of trading near term vol. Here’s hoping your 100% long trade returns a good profit going forward Jimmy. The trend is still up.
The alt is the one. The trend remains up.
I’ll have another wave count as per Kevin’s idea below. Moving everything within minute v down one degree, minor wave 3 may not be over.
Let us see how extreme indicators become at the end of this weeks candlestick. If everything is looking very extreme, then the next pullback may be a multi week pullback for intermediate (4).
If not so extreme, then the next pullback may only be another shallow consolidation for minor wave 4 to last only a few days.
The first target remains the same.
If this session has support from volume then it would be a classic upwards breakout with a breakaway gap. Breakaway gaps are rarely filled (go back to see a nice example on 11th September, it’s on the TA chart) and so can be used nicely in trading to pull stops up.
Long positions may now have stops moved up to just below the lower edge of the breakaway gap, which is well above the EW invalidation point so should reduce risk nicely.
A gentle and polite warning to members:
And just in case Joseph misses my comment below:
We are all adults here, and I encourage discussion of all topics. Nothing is out of bounds, because my expectation is as adults we can discuss topics of interest in a mature, rational and respectful way.
While I really do love to see the passion some here have for market behaviour and analysis, I do note that at times it may verge into strong statements that people who have a different POV may read as a personal insult.
This is how I want us all to speak here:
Treat everyone else here like the beloved Grandmother you respect. Be very polite and courteous. Exhibit grace and decency.
This reminder is not just for Joseph, I see some other comments that could verge on being considered impolite. Disagree with respect please.
Thank you all for continuing to exhibit exemplary behaviour online. It makes us all better people IMO to do that.
Thanks for the reminder Lara. Your site is one of the few places online where civility still prevails…
Well, you asked for it, Lara, err I mean Grandma!
Now, I am a grandpa and love it. Perhaps you are not quite ready for that though as I think I remember you mentioning that you had a teen aged son.
Hey Grandma, have a wonderful weekend and I look forward to your weekend analysis and commentary.
ROTFL
I certainly do hope I’m not going to be a Grandma any time soon. My son is only just 16!
Working on the weekend analysis now… and it’s looking VERY bullish.
I have an idea also for an extra… I saw Chris Ciovacco do something similar to this a while ago. I’m going to take a look at highs for October 1987, March 2000 and October 2007. I’m going to look at what the moving averages, On Balance Volume, ADX, volume and RSI looked like at weekly and monthly chart levels.
Lets see if there was any warning prior to the subsequent falls. What did the technicals look like back then? Then compare it to what we have today.
Now… I know that next time will be different. We won’t see exactly the same situation again. But if each prior end to a bull run had warning signs, then it seems logical to expect at least some warning signs as most likely next time too.
If there was an example of the end of a big bull run that had absolutely no warning signs in those indicators, that’ll tell us something too.
Great idea Lara
Ditto. Brilliant idea. Looking forward to it.
………….. I just doubled it all again!
Out of powder now!
Joseph, what have you doubled and doubled and doubled again? A bearish play?
I don’t know, but he tripled earlier, then doubled and doubled here. I need some of this monopoly money!
Yep… Yep… Yep and YEP!
Come ON!!!!
Being a moderately (in)experienced SPY-QQQ-IWM directional option player, I do very much appreciate all the excellent and various takes you guys share. It’s as priceless to me as Lara’s charts and analysis. I’ve learned a lot from you. Now it’s time to $$$$!
I just doubled it all again!
That pop above 2574 spx/257 spy felt like a little dagger in shorts hearts. This grind up since that 256.40 retest at 10:40am has been relentless.
The savvy short traders are not loosing any sleep I wager. The option traders are out six months to a year and happily lowering cost basis the higher she runs… 🙂
True. I am scalping, so I generally look intraday.
This is the wave count I prefer at the moment. Lara has a full (v) playing out and completing where I have just the i of the (v) completing. This was the main count from a few days ago, when a sharp ii down was expected. It came, after a slight throw-over of the leading diagonal i. The problem I have with (v) where I have a i of the (v) completing is then a minor 4 is expected, and the tiny little two hour pullback that came doesn’t come close to an acceptable minor 4 (IMO). Also, the resulting (v) while technically acceptable, is extremely truncated given the size of the (iii). I believe the minor 4 is still waiting for us, after this iii completes, and we get a following iv and v. THEN a minor 4 that should take at least a week, perhaps several. Something to consider, anyway. As positioned on the daily alternate, the minor 4 won’t even appear as a blip on the weekly. That doesn’t seem right.
Minor 2 doesn’t appear on the weekly either tough. It lasted only 3 days.
So if minor 4 is over it too would have lasted 3 days.
I agree with your wave count however Kevin, and I think this will be one I’ll also publish. Not sure how to label it, alternate? main? and I don’t think classic TA is going to tell me that there.
Buying back the last of my SVXY short calls. New all time high today on very low volume.
I am opening a contingent order to buy Jan 2018 110 puts at the market on any SVXY move below 106.35, which would fill gap from yesterday’s close. I still would like to see a move above the upper B band but an exhaustion gap would be fine.
I am outta here folk. Hope you all have an awesome week-end with friends and family!
IYT blew past my mental stop. this morning so I am underwater on the trade.
I am going to let it ride. I think this move up is corrective.
An extreme market that goes higher does not become any less extreme, but rather more so. It would be truly remarkable if we demolish another seasonally bearish tradition by exiting the month of October without a correction of 5% or better. If that happens I will be expecting quite a blow-off move into year end. I don’t expect it but absent a correction this month that is exactly what I think will unfold.
Verne, IMHO, the blow off is occurring right now. It is extremely unlikely to have a intermediate or primary 4th wave at this juncture. Just like 2012 highs, 2015 highs, and 2016 break downs were negated as terminal structures, so too will bullish EWs here. Institutional accounts have been handing over securities to retail for almost 12 consecutive months, and this move has all the markings of an extended 5th that is running out of buyers. The fun part here is everyone can be right. Lara is right to recommend trading with the trend with tight stops due to a plethora of risk factors. Joseph is right that the central banks must and will cease to support the markets, and Kevin is right that buying dips should be preferred to front running shorts. you and i will be right in making 100s of percent of well accumulated contrarian trades. I was very fortunate to trade 2000 bear as an 18 year old, 2008 at 26, see how wall st and the gov’t practice grand larceny, and now I’m preparing for what will be much much worse. By the time it starts it will be too late. Apologies for the diatribe.
Amen brother. Folk not familiar with how those previous markets unfolded don’t have quite the same perspective. I fully agree that this wave up is terminal and have said as much. What I am starting to wonder is just how high it will go.
I too continue to prepare for the inevitable! 🙂
Trading the market successfully requires (in my opinion) an ability to divorce ourselves from our culturally imposed need to always “be right”. Most of what is stated on this forum are claims about “being right”. Which is nothing more than entertainment as far as I’m concerned. As traders, we’d better be darn aware that bull AND bear markets happen, etc. etc. We’d better use risk management, etc etc. We’d better be reasonably nimble, per our written trading plan, etc. etc. What you guys state, or imply, frequently, is that anyone who doesn’t share your view of what “right” is, must by definition be less aware, less nimble, less capable, and (sorry, the word’s been thrown out there) ignorant.
Nonsense.
I hear ya. Sure would be nice to see a few posted trades- the good, the bad, and yes, even the ugly
Then again, I guess you and I are more put-your-money-where-your-mouth-is kinda guys! 🙂
Verne,
You are one savvy options trader and I use trades you mention on this discussion board to learn the approach and rationale behind. Have limited capital so just taking nimble positions. I am hoping that I will be on the right side of the trade as the market gets some reality check.
No nonsense and no critique or offense or implication intended. Speaking directly to someone, ie Verne and I has no innuendo or slight regarding any other posts on this forum. Clearly, all here value guidance and expertise and love the capital markets, and the desire to be empowered with there hard earned capital. The only people who are successful in trading are those who are not and recognize that they can not be right all the time. Good for me that PNL is all that matters…………..!
Good point, Chris! I expect to trade to the top — wherever that is — and then all the way down. My (slight) fear going down, however, is that if it gets bad enough, the leveraged/inverse ETF’s which I’m accustomed to using could go away. Then I might be wishing I had learned to short sell or trade options like you and Verne. Not there yet.
Thank you Curtis. Shorting is no different than buying. Determine the appropriate level of capital, locate shares, sell-short, place 5-15% trailing stop. Trailing stops are all traders best friends. The QQQs, and DIA would be the best etf candidates today to short. For what is worth, my DOW level was 23,242 that I calculated.
I fully expect some instruments to see a halt of trading during the most violent phase of the decline. If fact I expect some brokerage houses to close their doors. The leveraged instruments are certainly going to see reverse splits and some of them will probably go away. While it is nice to see a position explode ten or even 100 fold in a serious bear market decline, especially if you are fortunate enough to get pre-positioned, for this one I am going to opt to take profits out of my accounts early and often…I have a feeling that what is coming is going to be a bit different….
Chris,
I agree as few other investment advisory services are all stating ramp up is due to the Momentum buyers not the smart money. The only question remains now is how long before the true market show its face.
In a strange sort of way I think it already has. While it is true that price trumps all, there are lots of other things going on in this market that are calling attention to the need to be careful. I know some scoff and the fact that I have been saying that for six months (actually longer…lol!) but considering the magnitude of this top, a multi year topping process is not a very long time for these divergences to develop and manifest.
It will only happen when the central banks pull the rug out, as they’ve done throughout the last few bubbles. I’m actually greatly comforted by the invincibility others feel right now; means we are closer than we might want to be. What’s coming will make 08′ look like a walk in the park.
I am literally shaking my head in disbelief at the complacency…what was the quote about people who forget their history?
I’m going to put a lot of weight in what Lowry’s data and history tell us.
In their 92 year history every market crash, every bear market, has been preceded by minimum 4-6 months of divergence between their AD lines (they use operating companies only AD lines) and price.
Every single bear market has also been preceded by up to 3 years of expanding selling pressure and contracting buying power.
What we have right here right now is expanding buying power and contracting selling pressure, and AD lines moving to new highs with price.
At this time right now there is zero evidence from Lowrys of the beginning of the end. And so my conclusion has to be that if the last 92 years behaviour continues, then right now the high is absolute minimum 4 months away (and I think that is being too optimistic for bears) and quite likely 1-3 years away.
It will come. And there will be warning signs.
Apart from declining volume and some divergence with RSI (monthly chart level) there is not enough bearishness right now to be calling an end to this bull.
What led you to believe a “huge bear market” was coming 2nd quarter 2016?
AD line highs with AD ratio lows is not a good or healthy combination. Nonetheless, price could certainly move higher, but my position, which I’ve shared directly with Lowry’s, is that the ETFs have skewed the last 92 years of data on all sides.
In 2016 I was not using breadth in the same way.
And in early 2016 these things I noted on the monthly chart:
1. Declining volume for the prior rise in price, followed by increasing volume as price fell in the two big falls in 2015 / 2016, particularly high volume for the downwards month of January 2016.
2. Strong multi month divergence with price and RSI on the monthly chart, ending in a failure swing. That failure swing mirrored another that occurred in March 2000, just before a crash.
3. The last signal from On Balance Volume on the monthly chart was a bearish reaction from resistance in November 2015.
And so at that time with the data I had in hand, yes, the analysis was very bearish.
I did have an alternate bullish wave count, and as soon as a new ATH happened in July 2016 the analysis switched from very bearish, to very bullish.
RR-Yes the wonderful thing is data and mathematics never lie….the great arbiters!
VIX should be making a new 52 week low ahead of a protracted run higher. Bid on the Nov 10.00 strike calls now up to 0.90, ask 1.05
Market makers are not always right, but I like to know what they are thinking….
Series gaps also are generally seen at the beginning, and at the end of extended bull runs. While it is not impossible, it hardly seems likely that we are at the threshold of many years of a continued bull run; of course, not that anything is impossible in the era of central banks…. 🙂
The trend remains up, but I suspect this could be a final wave up, and that for any number of reasons. If VIX makes a new 52 week low I will certainly revisit that idea but its failure to do so despite the relentless series of new all time highs makes me think this wave up might be terminal. Another thing that would change my mind about this is if DJT makes a new all time high but as of now it is sure looking like a corrective second wave in DJT.
Waiting for a fill on my second batch of cheap vol calls.
Bought to open VIX Nov 10.00 strike calls for 0.70, one half full order…
Well, Lara’s alternate daily which puts us in Minor 5 of Intermediate (3) is now the main count. The first target of 2614 is far too low in my assessment. If Minor 4 was over at 2547 that leaves only 67 SPX points for Minor 5. The Minor 5 = Minor 1 target of 2763 seems to me to be much more likely.
If all this is correct, it means we are headed to 2926 as per Lara’s weekly count / chart. It is hard to fathom. But most if not all of us said that in August of 2016 when we broke through 2200 and the projected target was 2500+. But here we are at 2500+ looking for 2900+. It is time to start positioning my intermediate term and long term accounts for the next 300+ points of this bull market.
The question I have for you Lara is it possible that Minor 3 is not yet over?
I hope all of you have a great day and great weekend.
Where is the EW count that shows move is about to end and turn down!
I will make anyone here a $50 Bet… that this count will materialize soon! Just like they have since 2012 to the upside on three occasions that I can recall.
Yikes.
It will most certainly materialize when price action dictates that it must.
Thankfully Lara reasons out the wave counts according to EW rules and guidelines, not Fed balance sheets, Trump tweets or “vibes” in her soul.
Wow… nobody wants to a $50 bet???
That says a lot!
I just might be your huckleberry. Define your bet parameters precisely and I’ll consider it. If it’s not precisely measurable and objective (crystal clear to all observers in time who wins and loses), I have no interest.
A count that shows this move up is finally concluded earlier than currently described.
I would suspect… that the only way this count will be published is following a major move down from here starting soon… within next 30 or 60 days.
We will know it when we see it. I guess another way to describe is all the counts above are not valid.
All proper EW counts are valid until they are invalidated by price action. But you know that.
That’s more than a little vague. It’s completely non-descript.
I’ll pass, thank you. Best of luck with your short.
As I said before… No Takers, That says a lot!
Just laid on another short trade, here!
Look none of the counts terminate right here! I say it terminates here…. and new count will be produced showing that termination.
Quite right. She is the best around. It is also true that the market will sometimes do things that completely changes what had previously looked like a very plausible EW count, and which becomes obvious only after it has happened. This is also one of Lara’s great strengths in my opinion. She is very quick to pivot when price action dictates. I am supremely confident that she will catch the trend change very quickly after it arrives. I don’t mind being a tad early under the circumstances! 🙂
LOL! The only “vibes” I want in my soul Curtis are good vibes from surfing 🙂
Joseph, that’s actually pretty rude.
Please review the comments guidelines.
I enjoy your comments, your banter and your passion for market analysis. So I really don’t want to curtail your comment privileges. But if you are going to be rude to anyone else here I will have to do that. (I’m not offended, I’m a big girl. But I do note the rudeness).
Please be more respectful.
What comment is specifically rude?
and was that in response to a rude comment?
“Where is the EW count that shows move is about to end and turn down!
I will make anyone here a $50 Bet… that this count will materialize soon! Just like they have since 2012 to the upside on three occasions that I can recall.”
This makes me wonder if you have any confidence in my analysis?
You are literally asking for bets to be placed that I’m currently wrong.
Okay… I can see that now. But that was not my intent. Your analysis is sound. But you say often that you can be wrong.
I do have an issue with counts at times… that morph into counts that only extend in one direction. Up!
That is from EWI and your service looking back to 2012. When high probability bear counts… extend back to Bull counts who is to say that it won’t somehow change again back into a bear count?
I am bored with this one way market! Especially when it goes against everything else I know. I need some excitement!
I am currently fully short as of today. Isn’t this what is suppose to make a market?
Rodney thanks for your analysis.
I find symmetric projections to be extremely telling in SPX. Looking at the weekly, and using the recent bull runs as my measuring tools, I find 3 symmetric projection targets. One is close by at 2580. The next is way up at 2666, and the third is 2717. I’ll be watching closely when price gets to the 2580 range, looking initiation of some kind of REAL 4 there.
Separate from all that: I have real trouble with a minor 4 just happening, per the alternate daily; it doesn’t even show up as a blip on the weekly, and that just doesn’t seem right to me.
I found one more symmetric price projection using the SPX weekly, to 2616.50. Highly overlapped with Lara’s 2614. This is going to be a significant one to watch.
I still prefer the EW model from a few days ago, that didn’t label the tiny recent pullback a minor 4. It called the long overlapped section in early October a leading diagonal 1 (yes it has a touch of throwover…), then a sharp 2 down yesterday, and now we have a pretty clear impulsive 3 up. I suspect the pullback so far today is the 4 of that impulse, and we’ll see a 5 play out today/Monday.
I agree the targets are all starting to look too low. And when you consider that we are in a Cycle V of Super Cycle V a blow off top of the S&P 500 to 3300 suddenly doesn’t sound crazy anymore.
2.618 x the length of Cycle I would equal 3295 for Cycle V of Super Cycle V.
And so far in Super Cycle V we have gone (approximately):
Cycle I 666 to around 1370 (a double)
Cycle III 1100 to 2100 (a double)
Cycle V 1810 to ???
Get your popcorn out!
Short—Short—Short
ARRIVEDERCI Baby to DJIA & S&P!
Tripled Down right here!
Joseph,
I know the rationale behind shorting but Mr. Market has different agenda and it is getting might insane. Maybe it will surprise everyone from the momentum crowd when they least expect. I wonder if the news about senate approving the tax reform becomes a non event and that will be the sign.
Whatever… No Pain NO Gain! Sometimes you have to make a bet when you see it and feel it in every part of your body!
That’s where I am right now!
So Whatever!
The Trump agenda has been factored into market prices since election day!
There will be an adjustment period… just like from Reagan’s election day… through August 1982 when this Bull Move all started!
Trump’s adjustment period starts TODAY!
The Year 1987 had 7.00%+ of GDP growth!
Stock Prices do NOT parallel with GDP Growth. They Never have!
Stock prices go UP and Stock Prices go Down!
The Foundation for the Trump GDP growth will require a massive investment in Plant, Equipment and Infrastructure… and yes real quality paying JOBS!
Cash will be spent and with 100% expensing will shrink Earnings Per Share. Investment will NOT go into paper assets for a couple of years… Shares of Stock are paper assets. The last 8 years all available investment when into paper assets (There was very low real investment in the USA)… That is over for the next couple of years while the foundation for the next bull market is being built!
This is economic reality… this will build the middle class back up in the USA and bring many low income part time workers into the middle class with full time well paying jobs!
WHAT is going to build the middle class and new quality jobs in the US? Something Trump is doing? That’s both hilarious and absurd. Trump is giving giant cash giveaways to already filthy profitable corps, and to already filthy rich individuals. That money will NOT be spent on jobs! NOT be spent on higher wages! That is BOTTOM LINE PROFITS that will go to higher executive salaries and bonuses, and be used for more share buybacks. No company in their right mind would use such an unnatural windfall to expand their business; only EXPANDING BUSINESS drives significant spending expansion. The US history of tax cuts demonstrates this with crystal clear clarity. If you are listening to the Mouths of Sauron in DC, you are being deceived by nonsensical BS, designed to build support for the the massive theft of $$$ from the US government, needed for investment in the US on the commons. That money will instead hugely grow the wealth gap, and the US will continue to sink to a 3rd world nation status. My $0.02. Worth less.
Only the US Government Steals from people…
They have… over the last 20 years… stolen from the middle class, seniors and the next generation… their jobs and their money though taxes, debt, Globalization and from seniors, the ability to earn interest on their hard earned assets! All this at the hands of the US Government (Through BIG Government) and the Federal Reserve.
Yes… a reinvigoration of investment into real assets in the USA (Declining dramatically since the year 2000) into Plant, Equipment and Infrastructure will create real quality paying middle class JOBS in the USA!
On the Commons???? WTF does that mean???
Sounds like… well I am not going to go any further with that comment! Just to say the Government’s don’t create jobs… not real lasting jobs. Only Real economic growth does… Paper Asset appreciation is NOT real economic growth!
Capital will flow to where it is taxed favorably and to where it is NOT strangled by unnecessary regulation… time delaying regulation and red tape and where everyone in the execution process does not need to be paid off before it’s built and becomes a producing asset.
Dude, the commons means:
– education for the people (not a Republican agenda: intelligent/objective people don’t vote against their interests!)
– physical infrastructure for the nation: roads, power generation, electrical grid, network
– healthcare for the people
– civil rights for the people
– protection against corporate theft for the people
– protection against corporate environmental degration for the people
Are you aware the America was AWESOME in most (not all!) of these areas in the 40’s, 50’s, and 60’s? And since the Reagan years, our country has fallen and fallen and fallen? What’s the core difference? In the 40’s, 50’s and 60’s we had corporate tax rates at 70-90%. The COUNTRY as a result was rich, and we spent well. We became the most powerful nation on earth. Now, we are falling behind in every category…but oh my, aren’t our corporations tremendously wealthy? And the few who run and own them, obscenely wealthy? While the country festers? ‘nuf said. I won’t engage on this anymore, this is all I have to say, because I’m aware I’m just blowing wind at a tree here.
Sorry, I think you have your history wrong on when all this started or ended… or who is responsible for it all.
None of that is given by government! Government just sucks the life out of everything!
Individuals… made all of it happen! Not government!
You sound like a socialist and/or communist!
You could be right!! After 8.8 years, you just might have called the end of the bull market to within a day. If so, many of us will join you on the short side…as soon as there is confirmation. But frankly, I doubt this market is going down real soon. That feeling in your body might change to a new feeling soon. Best of luck in that trade.
I don’t distress about bets in the market… never have… never will!
I do however distress when I see market manipulation! 2012 to late 2016 was all pure market manipulation! I believe that is all over now… with the Fed Balance sheet being run off which began on October 1st 2017.
Nov 8th to Today… was the hope of change trade. Now that hope becomes reality… the investment in Plant, Equipment and Infrastructure… and yes real quality paying JOBS is to start with real dollars and those real dollars can only come from extremely inflated paper assets!
With tax reform and cuts about to be realized… so will be the reality of all the gains from the manipulated extremely over valued PAPER market assets looking to lock in those gains at favorable tax rates.
That freed up cash will then be invested into Plant, Equipment and Infrastructure… and yes real quality paying JOBS! NOT different paper assets!
I have to say if by “all over now” you mean central banks are no longer injecting liquidity into global markets I strongly disagree. The evidence is the virtually non-existent volume that has characterized the market for the longest time now, and which continues to decline as the market heads higher. I hear all the bullish projections and of course anything is possible. I personally am becoming more cautious the higher we go under the circumstances.
This does not surprise me in the least as I opined several weeks ago when the announcement of balance sheet reduction came out that it was a ridiculous and bald-face lie. I think price action has proven that to be exactly right.
Futures already on fire. ATH open tomorrow.
Yep! I have moved the expiration for my VIX calls to December. Price will open below 10
futures awful frisky,, Rodney got dat wabbit? Wabbit stew?
I shot that darn wabbit!
dat gun needs a bit of viagra
ROFL
Got it. #1 with a bullet! Take that you crazy rabbit.