
A bullish signal yesterday has now been followed by another upwards day. Support from volume means a more bullish wave count is considered.
Summary: The bigger picture sees the S&P now in a primary degree pullback to last a minimum of 8 weeks and find support at the maroon channel on the weekly chart.
This consolidation may be choppy and overlapping. If it is a running triangle or combination, it may include a new all time high. A new alternate looks at these possibilities. It expects more upwards movement and has support from classic analysis.
Last monthly and weekly charts are here. Last historic analysis video is here.
ELLIOTT WAVE COUNT
WEEKLY CHART
Click chart to enlarge.
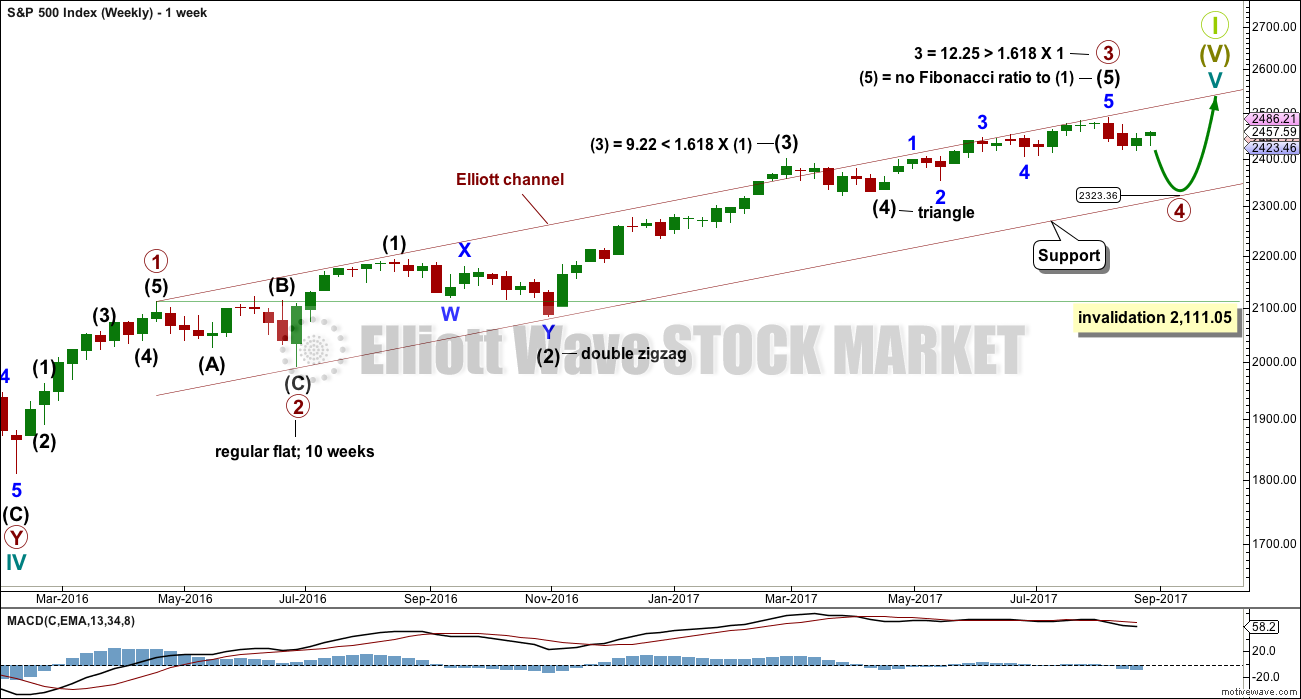
Primary wave 3 now looks complete. Further and substantial confidence may be had if price makes a new low below 2,405.70, which is the start of minor wave 5 within intermediate wave (5). A new low below 2,405.70 may not be a second wave correction within an extending fifth wave, so at that stage the final fifth wave must be over. Fibonacci ratios are calculated at primary and intermediate degree. If primary wave 3 is complete, then it still exhibits the most common Fibonacci ratio to primary wave 1.
Primary wave 4 may not move into primary wave 1 price territory below 2,111.05.
Primary wave 4 should last about 8 weeks minimum for it to have reasonable proportion with primary wave 2. It is the proportion between corrective waves which give a wave count the right look. Primary wave 4 may last 13 or even 21 weeks if it is a triangle or combination. So far it has lasted only two weeks.
If primary wave 4 reaches down to the lower edge of the Elliott channel, it may end about 2,325. This is within the range of intermediate wave (4); fourth waves often end within the price territory of the fourth wave of one lesser degree, or very close to it.
The final target for Grand Super Cycle wave I to end is at 2,500 where cycle wave V would reach equality in length with cycle wave I. If price reaches the target at 2,500 and either the structure is incomplete or price keeps rising, then the next target would be the next Fibonacci ratio in the sequence between cycle waves I and V. At 2,926 cycle wave V would reach 1.618 the length of cycle wave I.
DAILY CHART
Click chart to enlarge.
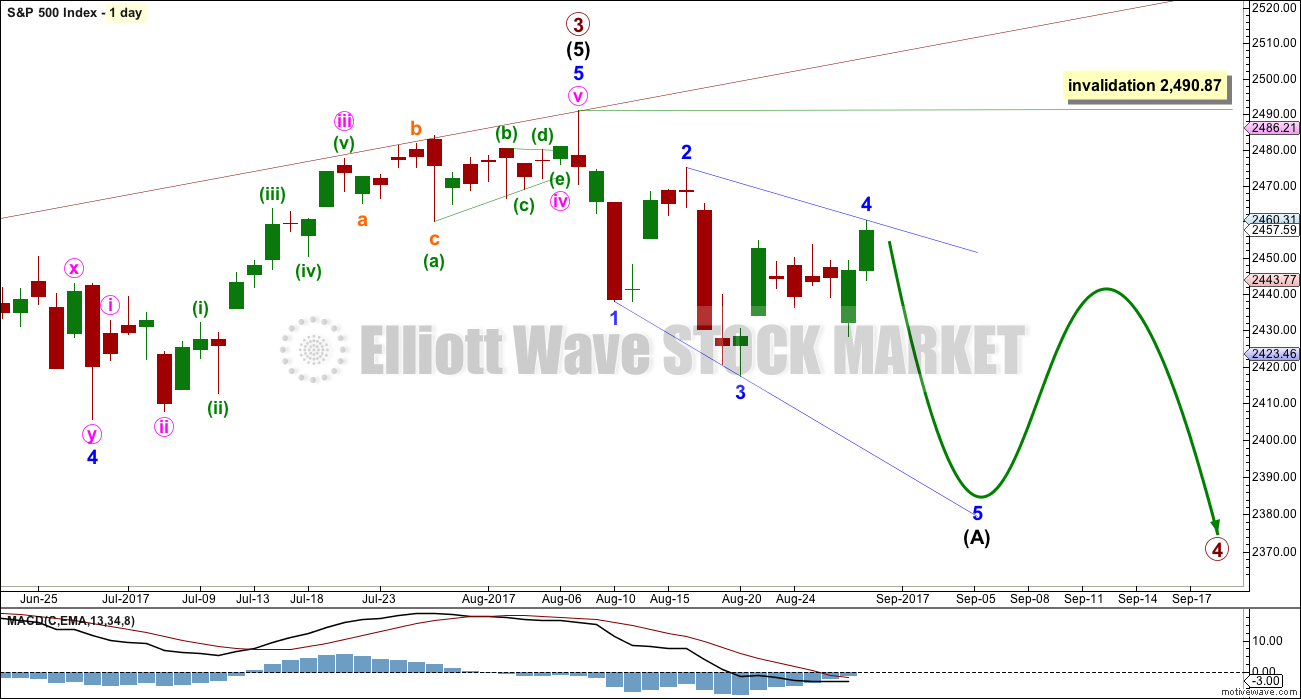
The daily chart will now focus in on the unfolding structure of primary wave 4.
Primary wave 2 was a regular flat correction lasting 10 weeks. Given the guideline of alternation, primary wave 4 may most likely be a single or double zigzag. Within both of those structures, a five down at the daily chart level should unfold. At this stage, that looks incomplete.
While primary wave 4 would most likely be a single or double zigzag, it does not have to be. It may be a combination or triangle and still exhibit structural alternation with primary wave 2. There are multiple structural options available for primary wave 4, so it is impossible for me to tell you with any confidence which one it will be. It will be essential that flexibility is applied to the wave count while it unfolds. Multiple alternates will be required at times, and members must be ready to switch from bear to bull and back again for short term swings within this correction. A new alternate is published today which perfectly illustrates the flexibility required when price is consolidating.
Intermediate wave (A) is labelled as an unfolding leading expanding diagonal today. The impulse has been invalidated by today’s upwards movement.
MAIN HOURLY CHART
Click chart to enlarge.
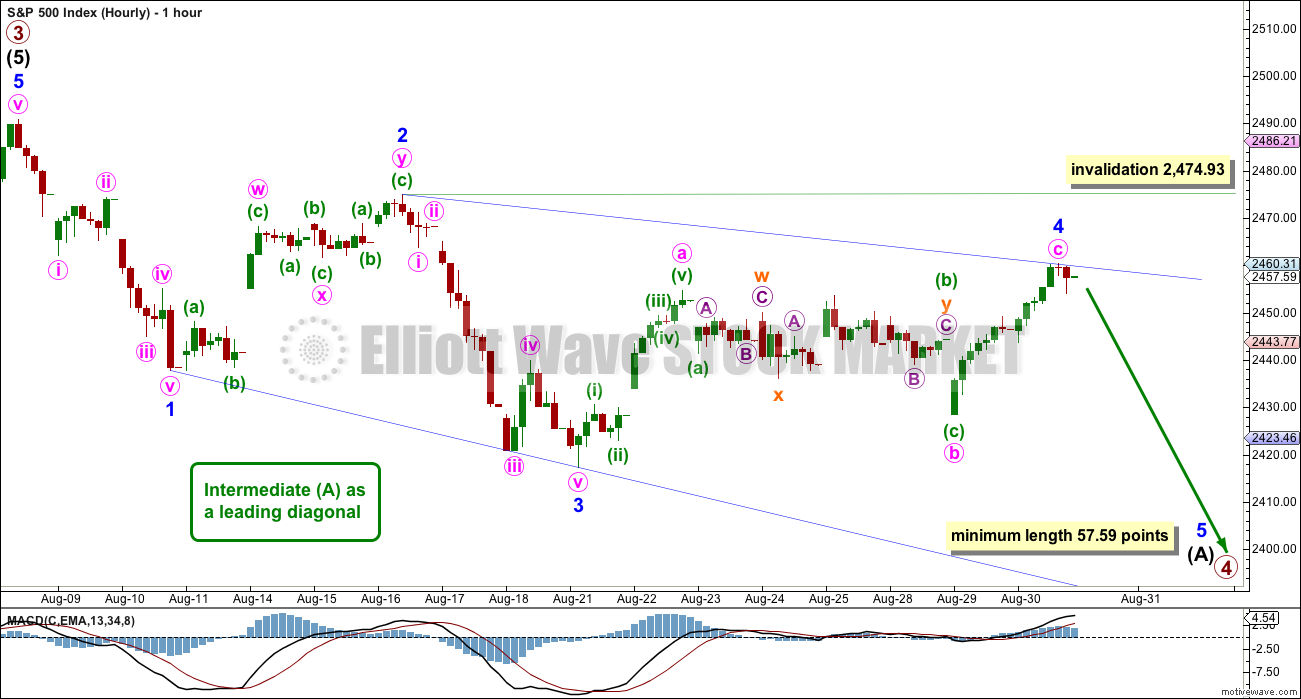
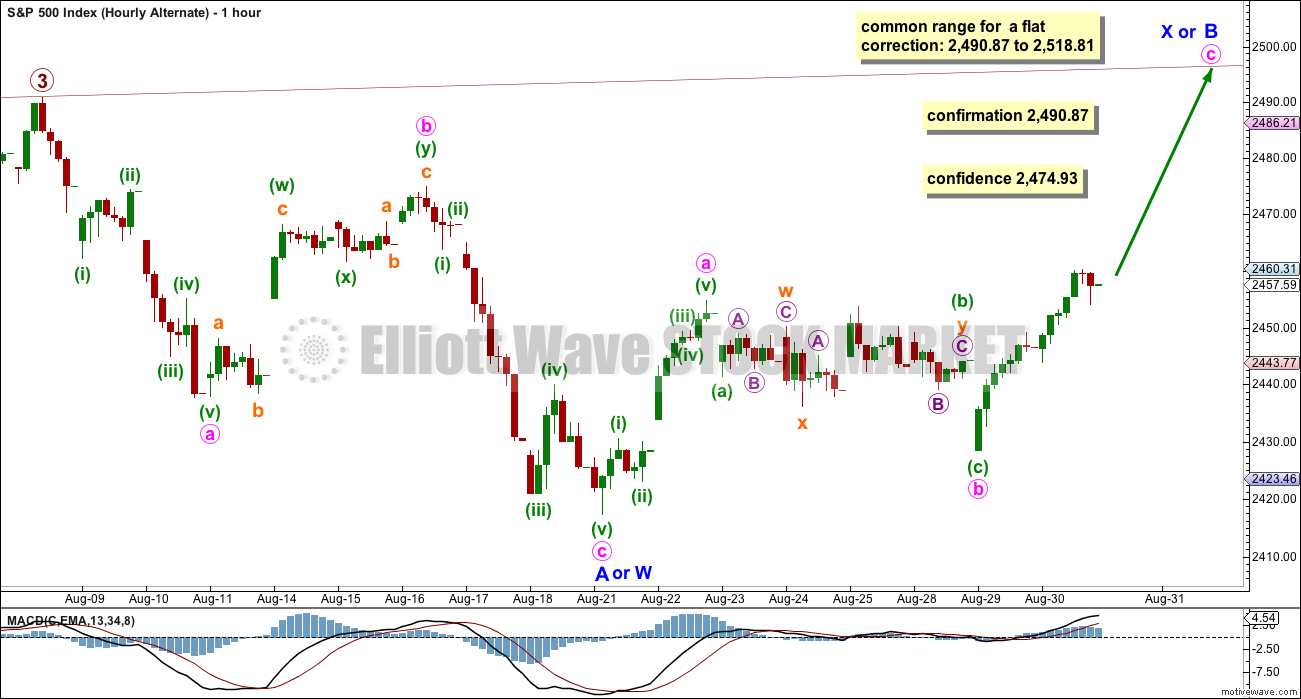
The leading diagonal is changed today to see all of minor waves 1 through to 3 complete, and possibly minor wave 4 also complete.
Minor wave 2 is 0.70 the depth of minor wave 1 and so far minor wave 4 is 0.75 the depth of minor wave 3. Both are within the common range of 0.66 to 0.81.
Within leading diagonals, the first and third and fifth waves are most commonly zigzags but may also appear to be impulses. Both minor waves 1 and 3 may be impulses.
Minor wave 2 may be a double zigzag instead of a single; doubles may take the place of singles.
This wave count meets all Elliott wave rules.
Minor wave 4 may not move beyond the end of minor wave 2 above 2,474.93. If this price point is passed, then I will again consider the diagonal as labelled up until today, in yesterday’s alternate.
Minor wave 5 must be longer than minor wave 3, which was 57.58 points.
ALTERNATE WAVE COUNT
DAILY CHART
Click chart to enlarge.
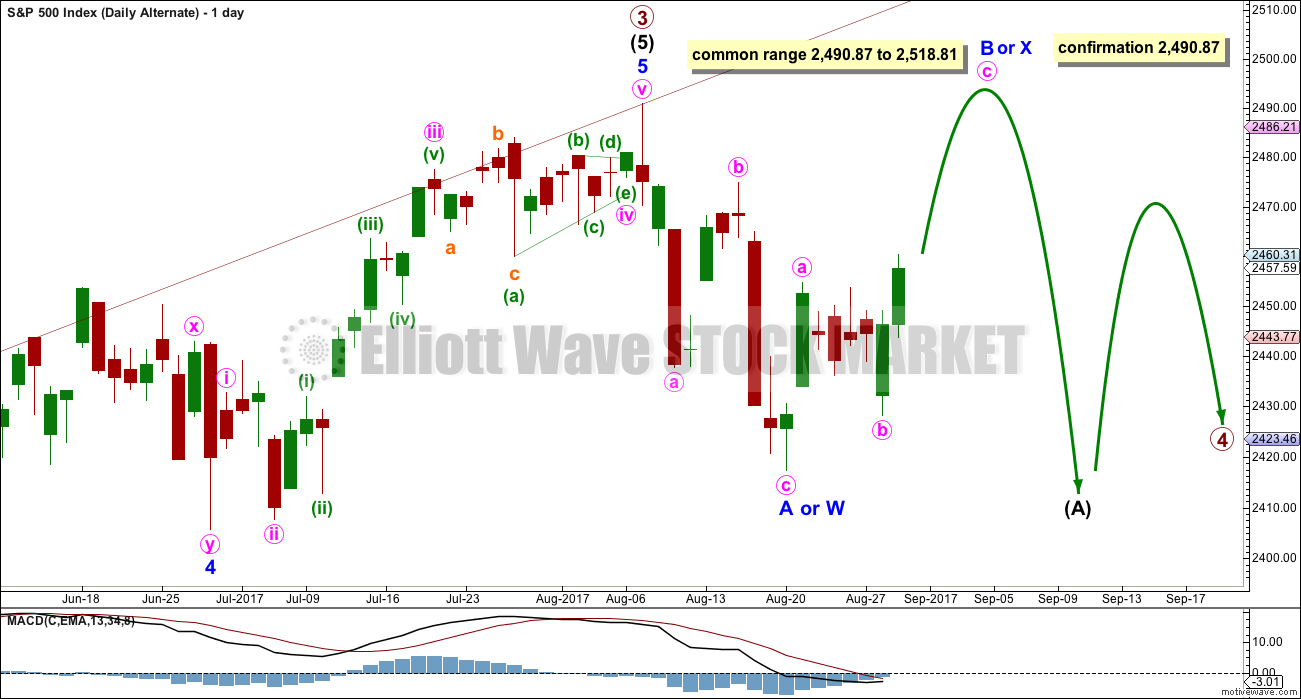
Primary wave 4 may be any one of more than 23 possible corrective structures. With what looks clearly like a three down complete and now a bounce unfolding, minor wave 4 may be beginning as a triangle or combination. Both those structures would still offer alternation with the flat of minor wave 2.
Intermediate wave (A) would be too brief if it was over at the low labelled minor wave A. Intermediate wave (A) may be unfolding as a three wave structure, either a combination, flat or double zigzag.
If intermediate wave (A) is to be a flat correction, then within it minor wave B must retrace a minimum 0.9 length of minor wave A at 2,483.52. The most common type of flat is an expanded flat, which would see minor wave B make a new all time high.
If intermediate wave (A) is to be a combination, then there is no minimum requirement for minor wave X, nor is there a maximum. It may make a new all time high.
If intermediate wave (A) is to be a double zigzag, then minor wave X should be relatively shallow. It may end here or very soon indeed. Minor wave Y should deepen the correction with a new low.
If intermediate wave (A) is a three, then that indicates a flat or triangle for primary wave 4.
There is no upper invalidation point for this wave count.
HOURLY CHART
Click chart to enlarge.
This chart tries to illustrate multiple structures for intermediate wave (A).
How high the current bounce goes may begin to tell us which structure intermediate wave (A) may be. If the minimum requirement for a flat correction is met at 2,483.52, then intermediate wave (A) may be a flat correction and a new all time high would be very likely. An expanded flat would require minor wave B to reach to 2,494.55 or above to be 1.05 the length of minor wave A.
If the minimum requirement for a flat is not met, then intermediate wave (A) may be a double combination or a double zigzag.
A combination is a sideways movement. A double zigzag should have a strong slope.
TECHNICAL ANALYSIS
WEEKLY CHART
Click chart to enlarge. Chart courtesy of StockCharts.com.
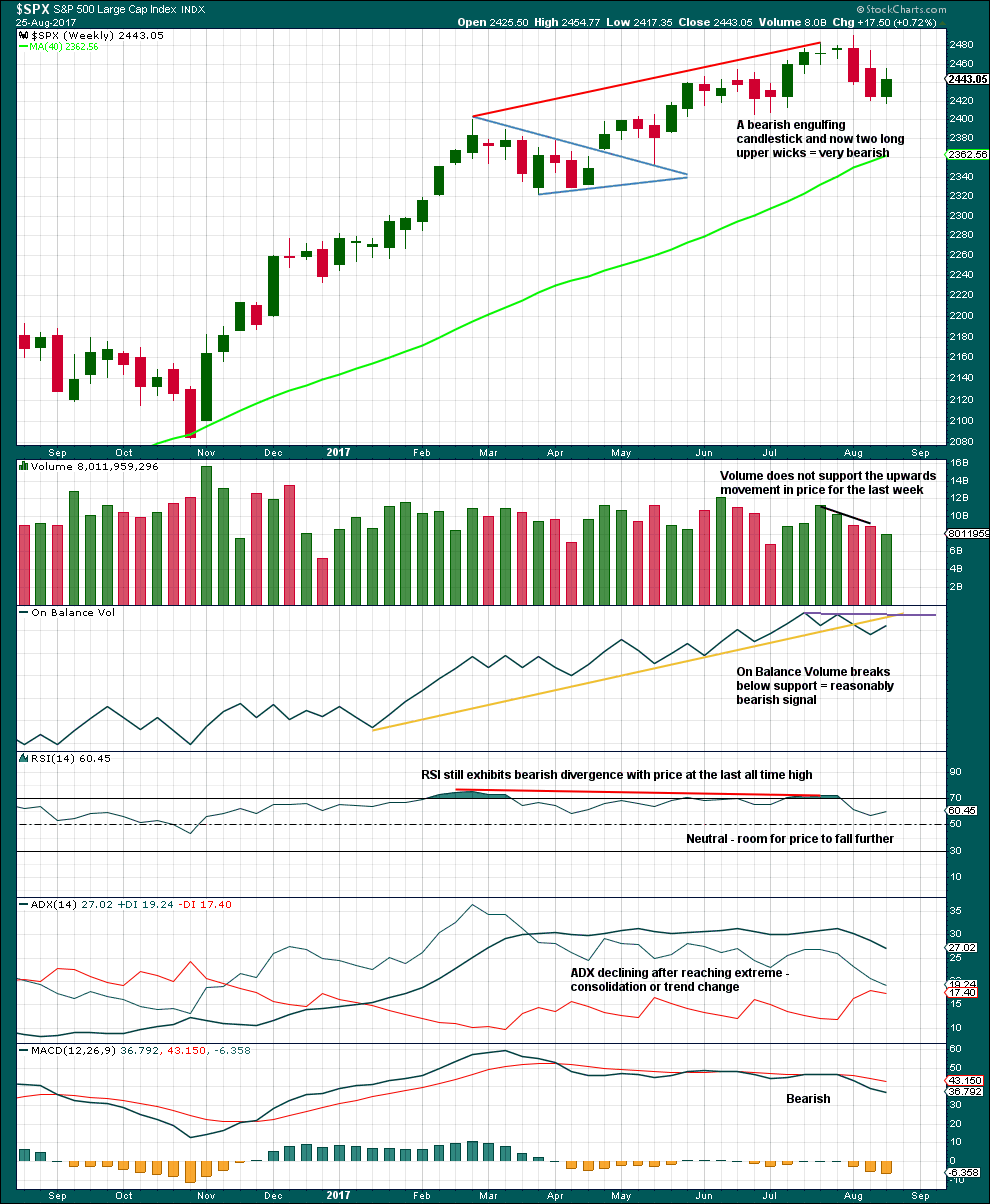
Last week has made a lower low and lower high, but the candlestick closed green and the balance of volume was upwards. Lighter volume does not support the rise in price during the week.
ADX had been extreme for a long time and is now declining. The black ADX line is now declining but has not yet been pulled down below both directional lines, so the consolidation or pullback may be expected to continue.
DAILY CHART
Click chart to enlarge. Chart courtesy of StockCharts.com.
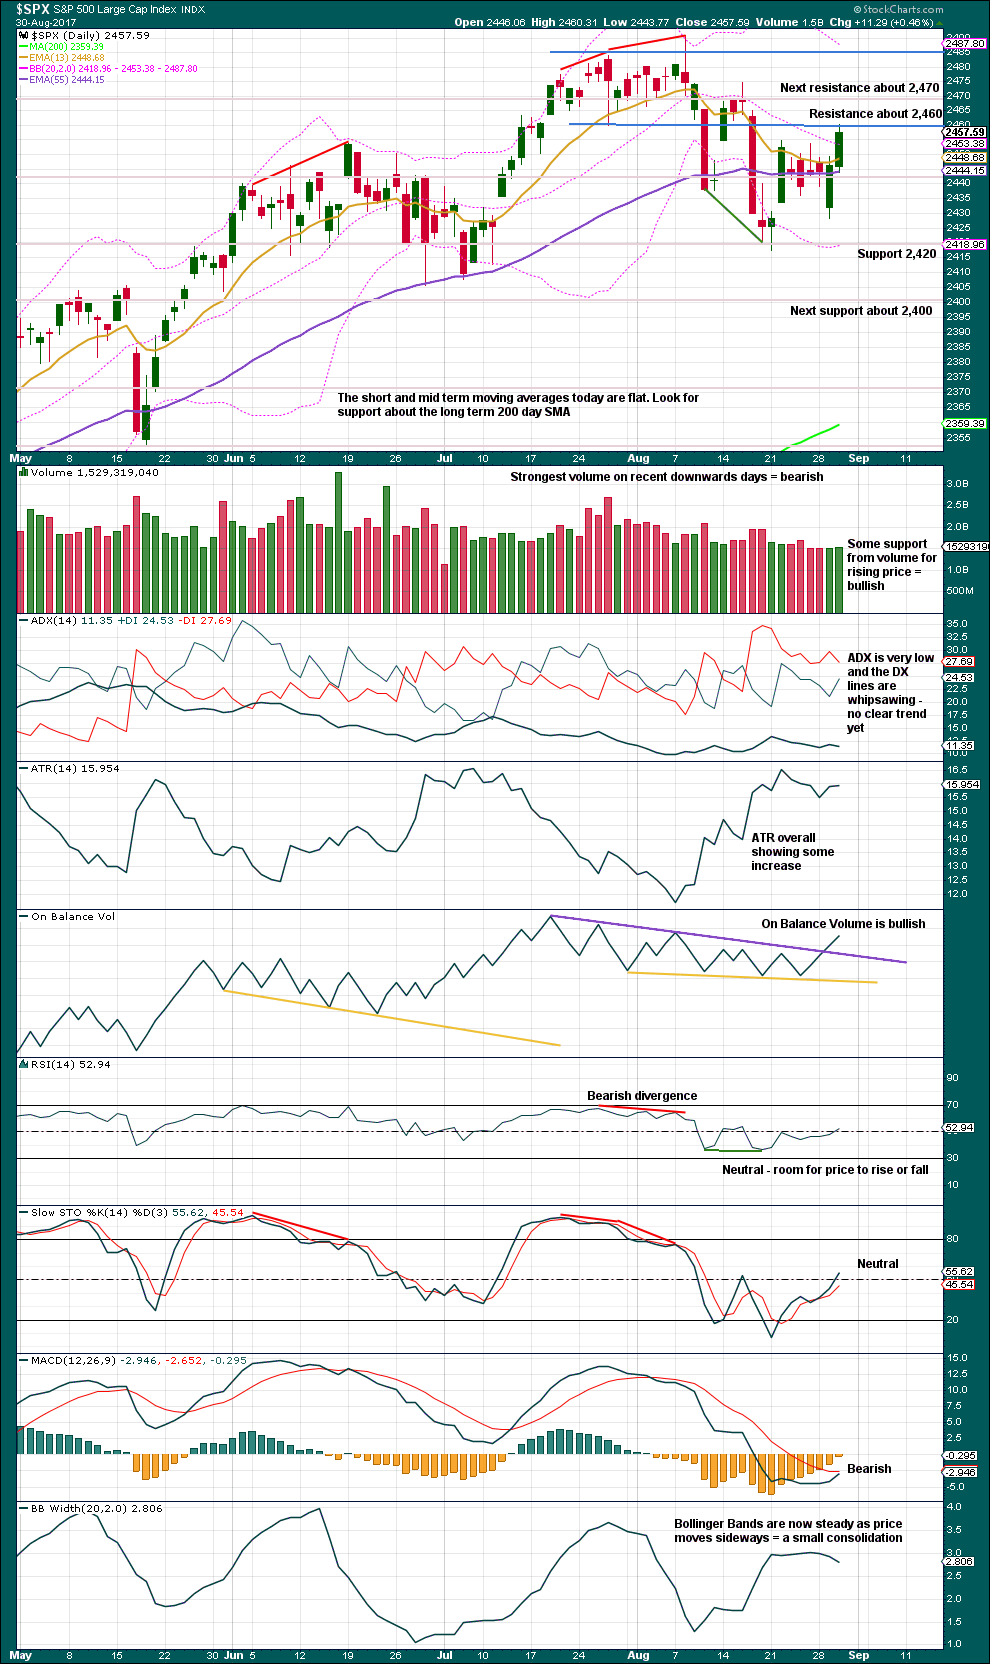
Resistance today halted the price rise about 2,460. Look for next resistance about 2,470.
Volume and On Balance Volume support the alternate Elliott wave count. MACD is still bearish, but looks like it may be about to offer a bullish crossover. Neither RSI and Stochastics are yet extreme, so there is room for more upwards movement.
ATR and Bollinger Bands indicate the trend is weak.
VOLATILITY – INVERTED VIX CHART
Click chart to enlarge. Chart courtesy of StockCharts.com.
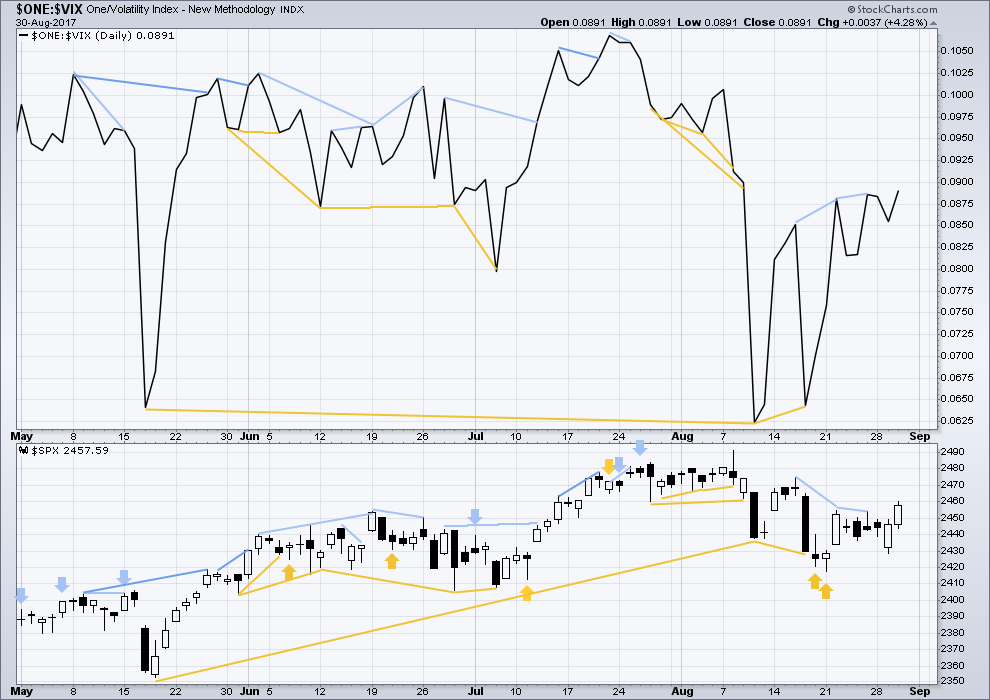
Normally, volatility should decline as price moves higher and increase as price moves lower. This means that normally inverted VIX should move in the same direction as price.
There is no new divergence today. Rising price comes with a normal decline in volatility.
BREADTH – AD LINE
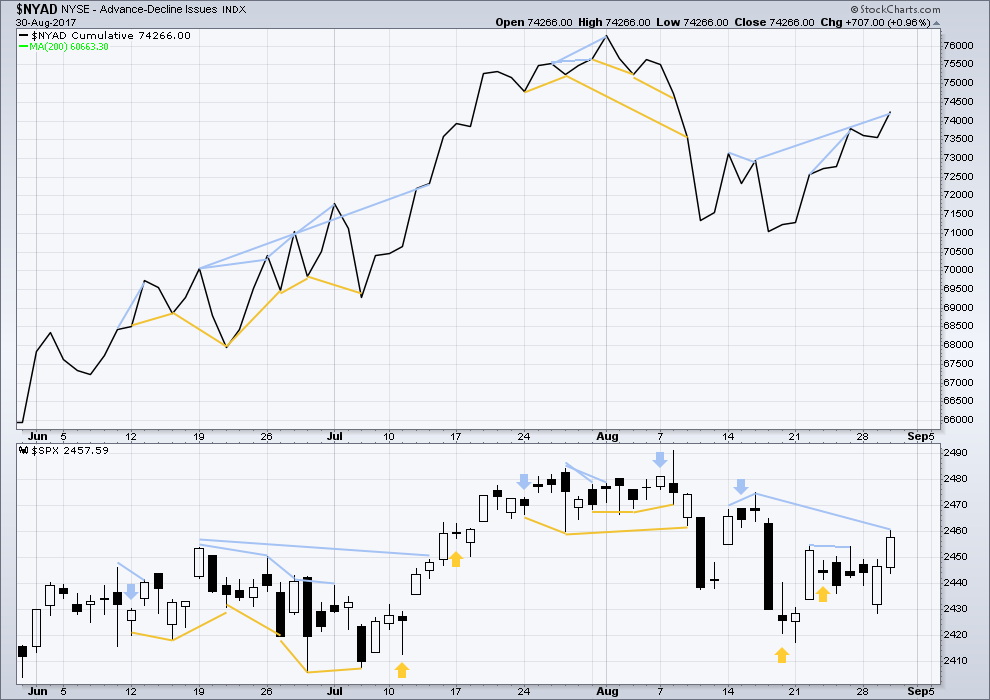
Click chart to enlarge. Chart courtesy of StockCharts.com.
With the last all time high for price, the AD line also made a new all time high. Up to the last high for price there was support from rising market breadth.
There is normally 4-6 months divergence between price and market breadth prior to a full fledged bear market. This has been so for all major bear markets within the last 90 odd years. With no divergence yet at this point, any decline in price should be expected to be a pullback within an ongoing bull market and not necessarily the start of a bear market.
There is new divergence today between breadth and the highs in price from the 16th of August to today: the AD line has made new highs, but price has not. This indicates weakness in price. It is hidden bearish divergence.
However, mid term divergence such as this does not seem to be as reliable as shorter term, so it will be given no weight in this analysis.
DOW THEORY
The S&P500, DJIA, DJT and Nasdaq have all made new all time highs recently.
Modified Dow Theory (adding in technology as a barometer of our modern economy) sees all indices confirming the ongoing bull market.
The following lows need to be exceeded for Dow Theory to confirm the end of the bull market and a change to a bear market:
DJIA: 17,883.56.
DJT: 7,029.41.
S&P500: 2,083.79.
Nasdaq: 5,034.41.
Charts showing each prior major swing low used for Dow Theory are here.
Published @ 08:31 p.m. EST.
some more labels on the leading diagonal idea, and fixed the invalidation point
minor 2 is now 0.92 X minor 1, this is deeper than the normal range for second waves within diagonals of up to 0.81
and so I think I need now to swap the wave counts over, the alternate becomes more likely
because expanded flats are VERY common structures, let us expect that may be what is happening
and it may only be minor wave A within intermediate (A), hoping I’m getting the degree right here early enough
expanded flats have B waves that are minimum 1.05 X A waves.
I’ll find a good example on the S&P for you all and post it at the end of todays analysis with a look at the technicals of the B wave so newer members can get a handle on how they behave
but as I noted to someone below (Jimmy?) the problem here is that the prior bull run showed weakness anyway, so to distinguish between a weak B wave now and a possible continuation of the bull run…. not easy
it would help if I uploaded the chart, wouldn’t it 🙂
Alternate hourly updated:
A new ATH would indicate this idea may be possible.
This also results in the blow-off toppy/bull trap look once the B wave completes. I just think it better do it Tuesday/Wednesday as T-bill spreads are blowing out, suggesting trouble ahead. On a fun note, Lara look at the swell forecast for FL the next 10 days!!! Multiple swells with good winds, and a potential 10@15 swell next Thurs/Fri!!! Much, much more important than trading 🙂
whoah! 10 to 15 ft? I didn’t know Florida did huge waves 🙂
I surfed yesterday in 3-4ft and got smacked on the nose by my board
I really feel like a massive doofus
but the surf was nice and clean so I got straight back out and got waves
Large Hurricane with great fetch produces deepwater swells of that magnitude every so often. Only a couple spots can handle that size though.
Look at what the bears are dong regarding that 2470 pivot. We have a dogfight underway. Interesting that they waited until the last minute but the message is quite clear – “Not so fast…!” 🙂
looking at volume on the hourly chart, the downwards hours are huge, the upwards hours light
Sorry I’m running late everybody.
Main hourly updated:
reverting to only minor 1 and now 2 within a possible diagonal complete.
So nice to see you my dear!!! Welcome! 🙂
good morning 🙂
Lara, SPX hit 2,475 20 minutes ago. So, I am wondering if your above updated hourly chart is still valid. Thanks.
sorry David, in my haste to get charts up for you I didn’t update the number on the invalidation point
it’s the last ATH at 2,490.87
I am wondering about this too. Especially since the alternate from last week and earlier this week entailed a range of 2466-2477.
My guess is that the wave structure from the previous alternate was invalidated somehow, and the wave structure for the new one necessitates that C not go above 2474.93. Granted, we only went 0.08 points above it…
EDIT: Scratch that. Lara’s response seems to indicate the alternate from last week (now the main wave count) is not invalidated by 2474.93, but rather by the ATH.
Best thing is to be patient and wait for breach of channel containing this C wave up.
2474.93 just invalidated. Hello alternate!
(and now an instant drop…. thats a bit scary)
It looks as if the bulls will indeed reclaim the 2470 pivot.
Buying SPY 247.50 calls expiring tomorrow for 0.47 as a hedge…
Pretty unreal, all things considered, but par for the course as well. Just re-bought the Unicorn.
Buying September 15, AN 45 strike puts for 0.90 per contract.
Somebody is giving away free money! 🙂
Buying September 15 Triple Q 145 strike puts for 1.06. Additional open order at limit price of 0.75 per contract.
Opened STC order for 1.50 GTC….
One of the biggest challenges we face as traders is being right about the trend and being disciplined in trading it. Lara had a number of bullish counts that were all systematically eliminated by price action. While it is entirely possible that some un-foreseen count is developing, I trust her analysis that we have indeed had a significant trend change and will trade accordingly until price tells me I am wrong. This is really hard when near term market gyrations conspire to dislodge us from positions taken based on careful and thorough analysis, and it is very counter-intuitive to use counter-trend rallies to add to short positions in a down-trend. There will be a price that says I am wrong, but until then my assumption is that the trend is down. If we close above 2470 I will be adding additional hedging trades….
hedges really are the best approach to a big consolidation
So is the 2466-2477 region still relevant? seemed like all y’all were in favor of that particular alternate a few days ago, but recent price action has caused everyone to abandon that idea in favor of a surge to new all time highs.
Does anyone have any idea what is happening or have we given up on charting this market? Every single count seems to be insufficient in charting this move. This is not a criticism. Just an observation on the challenges of charting.
Seems like Lara’s alternate may be gaining the upper hand.
I’d say we all know what’s happening: we’re in a big 4 down, it’s a jumbled mess, right now we are in a strong reversal, but overall, it’ll be going down again, very strongly. Meanwhile, trade the swings using whatever techniques work best for you, or stand aside, a very reasonable approach at the moment in this uncertain period. My personal view: the higher the market goes here, the more certain downward price action to come is, and the more I plan on making as it falls to the W4 target, so so far below price now. ps: no surprise, SPX topped right at the high from the last major spike up. Might even hold longer term.
I agree whole heartedly with your comment, right up to the personal view bit
I’d rather not have any view nor emotion whatsoever on this market ATM
I’ll look at the classic TA to guide me
Buying September 20 10.00 strike VIX calls for 2.65; 1/4 full cache….opened order to by another quarter at 2.35 to lower cost basis…
Trading ahead of a holiday week-end is generally positive. Many traders are aware of this and so odds are will see a market move higher tomorrow. I will be hedging my short position with a bullish diamond put spread until we get some clearer idea of what this wave is doing. We may also get a doji today so nothing is assured.
between the QQQ’s exactly hitting it’s ATH, and SPX hitting and turning on a intra-day double top…I’ve taken a small short, with a redicuously tight stop. A “high leverage” point is how I view it. Low probability of success, but still significantly positive EV.
Q’s penetrating upper B band today so that is definitely a heads-up. It could be a lot of traders are front-running the anticipated holiday ramp and getting positioned to distribute to the crowd during tomorrow’s session.
The high-low late yesterday defines the bullish symmetry (largest pullback) for this move, and the most recent pullback (another 4?) didn’t get there. My definition of “probably over” is that this largest pullback must be exceeded, with a full 5 minute bar below it. Therefore, to quote one of the greats, it’s: “Onward!….to…INFINITY!!”
Don’t quite get how we can have a corrective wave above P3 without it actually being P3.
We can if it is an expanded flat. I myself did not understand this until I started reading Lara’a analysis and it is a techinical point that resulted in so many disastrous wave counts by the folk at EWI as they consistently ignored this possibility. The fact is that in an expanded flat that b wave can extend beyond the start of the a wave and therefore print a new high despite the fact that you have indeed had a trend change with the expanded flat being a corrective wave against the new trend, new high notwithstanding. This is something that is really critical to recognize imo.
Yes indeed. I cannot tell you how many losses I’ve suffered in the past by not understanding this — entering a trade when price exceeds the beginning of an A wave, only to be crushed by a powerful C wave. Over and over again. Yikes!
And where did I learn that brilliant move? None other than EWI.
The thing I found remarkable is how repeatedly Steve Hochberg would commit this egregious error. It was truly stunning how he would consistently get this wrong. I truly believe despite his many talents, this simple fact regarding expanded flats is something that does not factor into his analysis. It is the only way I can account for his failure to correct this repeated mistake over so many years of analysis. Very strange!
And Jeffrey Kennedy too, in his trading videos.
Considering their boss over there is the man who literally “wrote the book”, it remains a huge puzzle why Bob has not called them into his office in front of a chalk board and said to them:
Gentlemen…. THIS….is what an expanded flat looks like…! 🙂
and they’re really common too
the key is to look at strength / weakness in the possible B wave
in the book, Prechter writes: “B waves are suckers”
lets avoid them and not be suckers
SPX 2470 is my line in the sand. A close above that pivot would negate an important techincal sell signal since the August 8 high and imply new all time highs were on the way. Hard to say if this is a concerted effort to dislodge short positions ahead of a steep September decline or a continuation of this remarkably resilient bull run. Either way I exit all short trades with a close above 2470 today. Not yet convinced long trades warranted by the overall big picture scenario- a short term upside scalp for certain, but I would not want to get too comfortable on the long side here….it does look to me like we have a series of zig zags unfolding and a possible LD still in play to the downside….
You’ve been mentioning 2470 as significant for days now and sure enough it stalls and turns right there (for the moment). Could you give a thumbnail of how you compute or project your “pivots”? Is this the pivot calculations that are given in Carter’s book, or something different? Thanks.
It is actually quite simple. I have noticed the last few years that there are some pivots that the bears and bulls furiously contest on the way up and on the way down. By that I mean an incredible amount of capital is expended by both sides around these price points.The strange thing is that they are not price points that one would naturally pin point due to moving averages or fib relationships but seemed to be critical to the market’s near to mid term direction. So while I cannot point to any technical basis for why I pay attention to them, I can tell you that doing so more often than not has kept me on the right side of the trade, and kept me from bailing too early, or hanging on too long. If 2470 is not reclaimed by the bulls, I think we can safely ride prices down to at least 2420.
TY!! An area that has shown lots of support and resistance in the past, generally. I can see that for 2470 for sure.
the method I have learned to identify support and resistance points is to “look left”
draw horizontal lines which have as many highs and lows touching and extend the line right, there’s your area of S&R
for blank space above, it’s just round numbers
2,500 being a big round number as in a hundred not just a ten should offer strong resistance
I know a guy, a professional trader, who almost exclusively uses support and resistance to make his living
If the jobs report is good or very good tomorrow, will that be considered bullish or will it be considered bearish since the economy is heating up and the fed will increase rates. I’m guessing that it will be considered bearish good or bad.
I don’t know, but I can guarantee the media will run with whatever story fits the narrative: the market went up because the jobs report was good! the market went down because the jobs report was good which means the fed will raise rates!
If prices turn substantially back down now that it’s in this 2666-2677 zone, I believe the most likely scenario is YESTERDAYS hourly alternate.
I believe the late day pullback was a “final” wave 4. It penetrated bullish symmetry but didn’t truly bust it, and now off to the races again. I’m looking at today’s move as a final 5 on top of this run up. Then we should get back to sideways/down movement, I expect. Though nothing is certain, that’s for sure.
On the other hand…after looking at symmetry projections that extend at least as far as this over all move from the reasonably recent past (6 months)…yikes! They are all FAR LARGER than this current move so far. Pointing up to 2500 to 2505 as the ultimate top. Obviously this move doesn’t have to reach those lengths, but I just note that once having gone THIS FAR, all the moves in the last 6 months have gone much further. Something to be aware of.
XIV has hardly gone up since Aug 22. Yet the market has zoomed. Quite bearish as I see it, but it could rectify quickly too. And if it does, XIV would be a nice place to have some money parked.
The SPX daily MACD now has the bullish crossover I spoke of yesterday. I will be taking long positions today with the expectation of a move over 2500.
I know we don’t post a lot about fundamentals here, but yesterday’s +3% second quarter GDP report was a very positive surprise for the US economy. It is the best in over 2 years. I think it may be just the start of the Trump recovery. If that is true, Lara’s previous comments about SPX ~2900 may be in the cards.
Have a great day all.
This buying frenzy has reached such a crescendo that it looks like SPX will gap above the upper bollinger band on the hourly chart. I am now in favor of the main wave count and anticipating a precipitous drop after this morning’s gap open. We shall see.
so it is 50-50 to go 50 points up to 2518 or down to 2400 , hence untradable..
Yep… and that’s the beauty of EW analysis and having a real pro like Lara. Sometimes, when things are this unclear, we can know to either stand aside for a while or adjust our approach until we have more clarity.
Other times — once in a rare while — we can know with almost perfect certainty what must surely happen next. That’s not now, for sure!
as i have mentioned before if EW does not provide paper trading then all this is just vague theory. no trader can play a 4 correction shorting and not know where to place a stop loss because this zig zag could make ATH. its the most irrational thing of taking under consideration 10 alternate scenarios while trading, even in a casino.
EW analysis is not a magic bullet for trading. There is often a lot of uncertainty. That’s why Lara, being a wise analyst, posts good plausible alternates.
My way of adjusting to EW uncertainty is to trade really tight timeframes with really tight stops, relying on good chart templates. Some here call it scalping.
I use an Ichimoku Cloud indicator with slightly hacked parameters, a 34-period EMA, and Parabolic SAR with slightly hacked parameters. I use Lara’s daily analysis to help anticipate the most likely direction of the day’s price action and whether it’s most likely to be choppy or trending. I also use my own seat-of-the-pants EW knowledge to try and discern the difference between small intra-day trends and corrections.
Analysis is often hard. Trading is even harder. Risk management is the key.
If you are going to create a casino analogy for trading, it’s definitely poker, the “game of partial information”!! SPX has broken up again to new highs today (“raise!”)…do I call (hold my short?)…do I fold (take my loss?)…or do I RAISE (double down on my short)?!!! Yup, poker, with the market. And I suppose the analogy for EW information is knowing the playing style of your opponents. It’s not definitive, but it is valuable additional information!
good answer
no matter what analytical methods you use, trading a correction or a range bound piece of movement, is going to be very difficult and risky
only the most experienced pros should attempt to do it
the rest of us should stand aside and exercise patience
which is why I keep harping on about risk management, and how incredibly important it is
Every day since August 17 it just feels less and less like like we are dealing with a correction here and more and more like this is a push to new ATHs. I suppose the alternate makes those two options not mutually exclusive?
that right there is the problem with 4th waves and B waves in particular
running triangles and especially expanded flats are very common structures
expanded flats include wave B that is 1.05 X wave A or longer, up to 2 X wave A (can even be longer)
they convince us there’s been no trend change, that the old trend is continuing, right before wave C moves fast in the opposite direction
B waves (and 4th waves) are suckers. they have inherent weakness in them.
but the problem now here for me is the whole upwards trend shows a fair amount of weakness, particularly declining and very low ATR
on a roll