
Price is moving sideways in a small range for the last two sessions. The short term direction expected by the Elliott wave count remains the same.
Summary: The bigger picture sees the S&P now in a primary degree pullback to last a minimum of 8 weeks and find support at the maroon channel on the weekly chart.
For the short term, a bounce may continue slightly higher to find strong resistance at the upper edge of the base channel on the main hourly chart.
The short term target for a third wave down is still at 2,389.
If price moves above 2,474.93, then use the alternate hourly chart.
New updates to this analysis are in bold.
Last monthly and weekly charts are here. Last historic analysis video is here.
ELLIOTT WAVE COUNT
WEEKLY CHART
Click chart to enlarge.
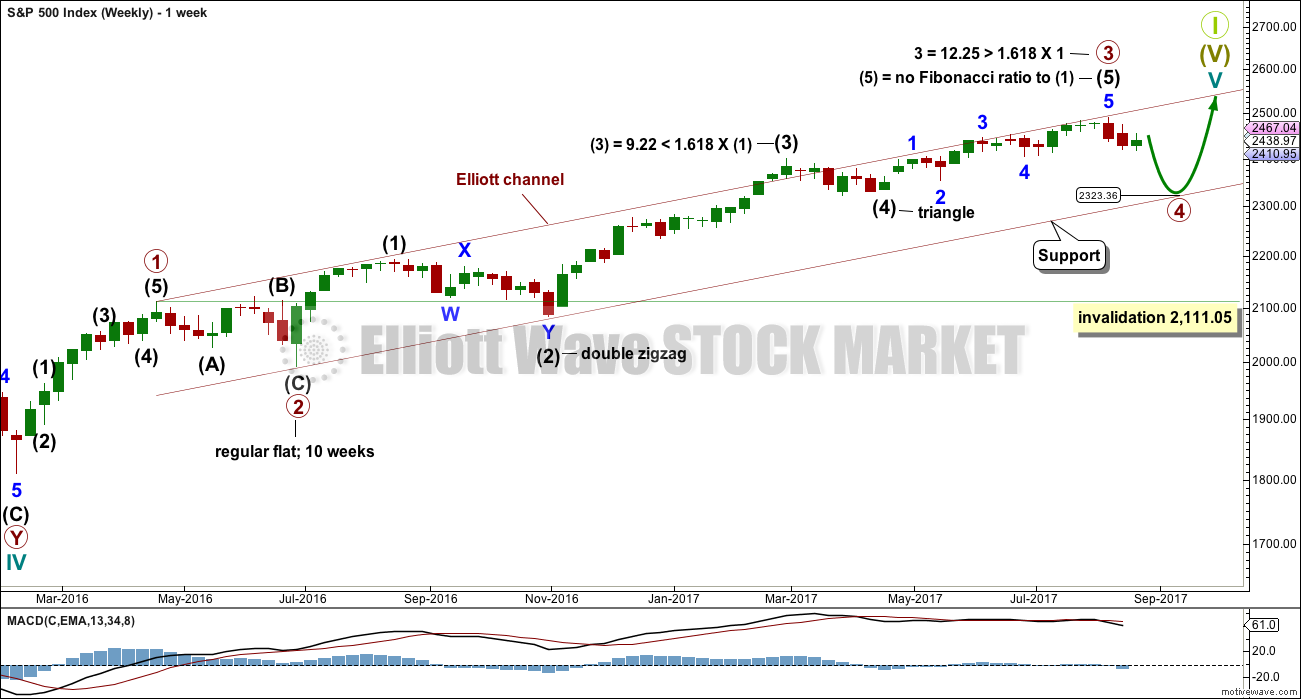
Primary wave 3 now looks complete. Further and substantial confidence may be had if price makes a new low below 2,405.70. Fibonacci ratios are calculated at primary and intermediate degree. If primary wave 3 is complete, then it still exhibits the most common Fibonacci ratio to primary wave 1.
Primary wave 4 may not move into primary wave 1 price territory below 2,111.05.
Primary wave 4 should last about 8 weeks minimum for it to have reasonable proportion with primary wave 2. It is the proportion between corrective waves which give a wave count the right look. Primary wave 4 may last 13 or even 21 weeks if it is a triangle or combination. So far it has lasted only one full week and is completing its second.
If primary wave 4 reaches down to the lower edge of the Elliott channel, it may end about 2,325. This is within the range of intermediate wave (4); fourth waves often end within the price territory of the fourth wave of one lesser degree, or very close to it.
The final target for Grand Super Cycle wave I to end is at 2,500 where cycle wave V would reach equality in length with cycle wave I. If price reaches the target at 2,500 and either the structure is incomplete or price keeps rising, then the next target would be the next Fibonacci ratio in the sequence between cycle waves I and V. At 2,926 cycle wave V would reach 1.618 the length of cycle wave I.
DAILY CHART
Click chart to enlarge.
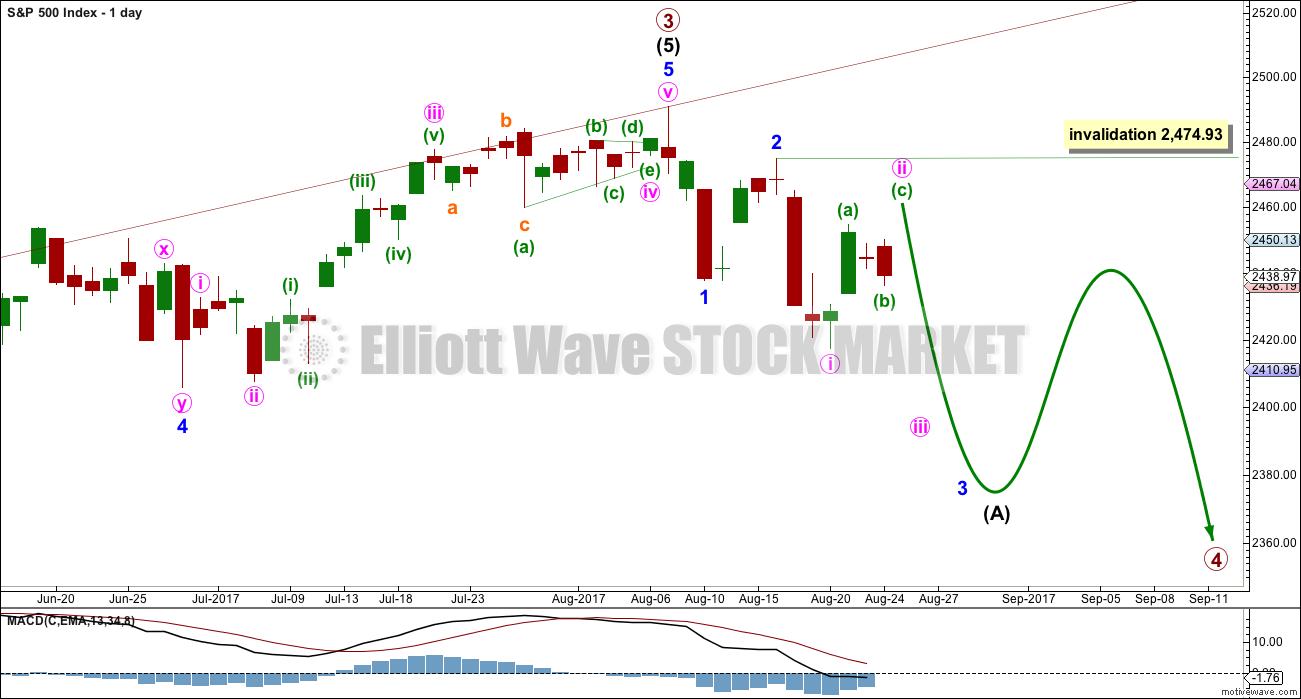
The daily chart will now focus in on the unfolding structure of primary wave 4.
Primary wave 2 was a regular flat correction lasting 10 weeks. Given the guideline of alternation, primary wave 4 may most likely be a single or double zigzag. Within both of those structures, a five down at the daily chart level should unfold. At this stage, that looks incomplete.
While primary wave 4 would most likely be a single or double zigzag, it does not have to be. It may be a combination or triangle and still exhibit structural alternation with primary wave 2. There are multiple structural options available for primary wave 4, so it is impossible for me to tell you with any confidence which one it will be. It will be essential that flexibility is applied to the wave count while it unfolds. Multiple alternates will be required at times, and members must be ready to switch from bear to bull and back again for short term swings within this correction.
Members with a longer term horizon for their trading may wait for primary wave 4 to be complete to purchase stocks or enter the index long.
While intermediate wave (A) is labelled as an unfolding impulse, it may also be a diagonal. Both structures are considered at the hourly chart level.
Intermediate wave (A) may also be a zigzag if primary wave 4 is to be a triangle. So far it is possible a zigzag downwards could be complete, but it is not deep enough for wave A of a triangle when it is viewed on the weekly chart. And so that possibility will not be considered at this time.
MAIN HOURLY CHART
Click chart to enlarge.
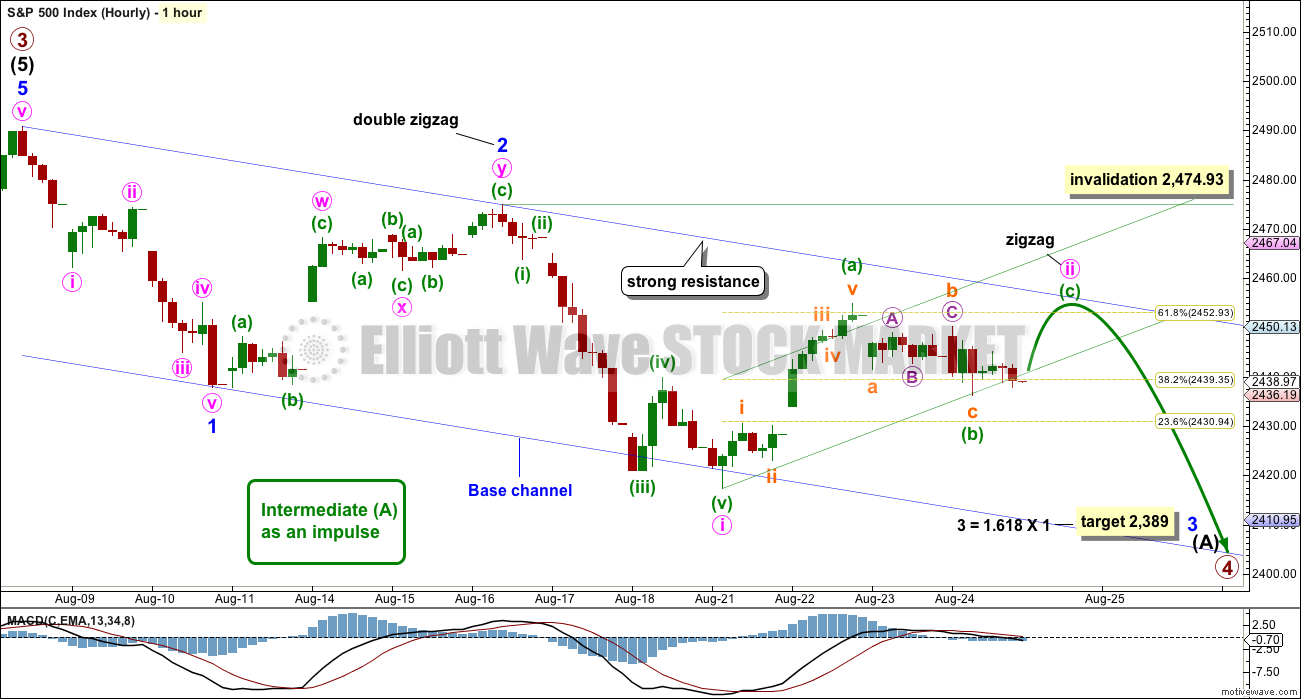
Minor wave 1 downwards looks very clear as a five wave structure.
Minor wave 2 upwards ended just above the 0.618 Fibonacci ratio. Minor wave 3 downwards has now made a new low below the end of minor wave 1, meeting the Elliott wave rule.
Minor wave 3 now exhibits slightly stronger momentum than minor wave 1. A further increase in downwards momentum would be expected.
Within minor wave 3, minute wave ii now shows up on the daily chart as a three candlesticks so far. It has reached just above the 0.618 Fibonacci ratio. It may move a little higher to test the upper edge of the base channel.
Minor wave 2 lasted four sessions. If minute wave ii ends in one more session, they would be even in duration, which is entirely acceptable for proportion. If minute wave ii lasts a little longer, that may also be reasonably acceptable. When the duration of minute wave ii is comfortably longer than minor wave 2 though, the proportion would not have the right look at higher time frames.
A small channel is drawn about minute wave ii. Minuette wave (b) has continued during Thursday’s session as a zigzag. It is still possible that it may continue further as a double zigzag, combination, or even a triangle.
After a little upwards movement, which may be considered minuette wave (c), then the green channel may have some purpose. At that stage, a breach of the lower edge of the channel would provide earliest indication that minute wave ii may be over and a third wave down may be underway.
In the first instance expect very strong resistance at the upper edge of the blue base channel.
If price moves higher above the upper edge of the base channel, then the alternate below should be preferred as soon as that trend line is breached and before the invalidation point is passed.
The target expects minor wave 3 to be an extension. When third waves extend, they do so both in price and time. They often show their subdivisions at higher time frames, which is why minute waves ii and iv may show up on the daily chart.
Use bounces as an opportunity to enter the downwards trend. Always use a stop and invest only 1-5% of equity on any one trade.
ALTERNATE HOURLY CHART
Click chart to enlarge.
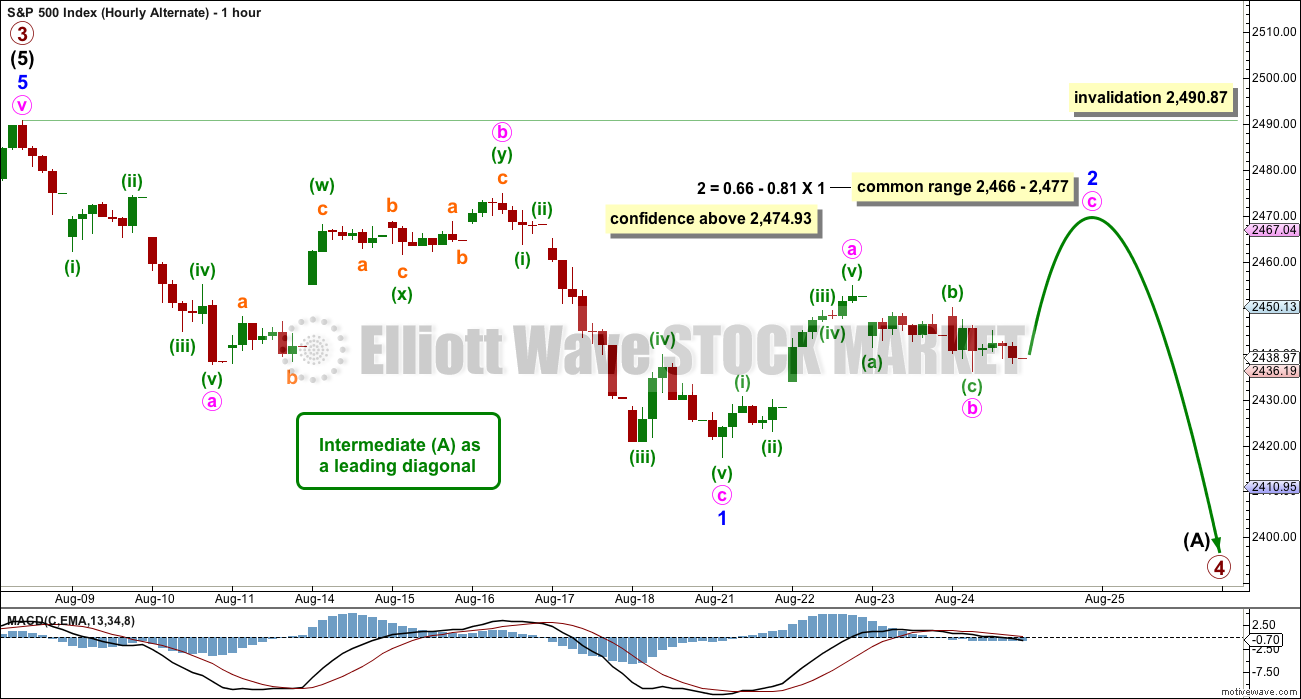
The other possible structure for intermediate wave (A), if it is to be a five, would be a leading diagonal. These are not as common as impulses, so this must be an alternate wave count judged to have a lower probability than the main wave count. However, low probability does not mean no probability. All possibilities should be considered.
Within leading diagonals, the first, third and fifth waves are most commonly zigzags. They may also appear to be impulses. Here, minor wave 1 will fit as a zigzag.
Second and fourth waves must be zigzags. Minor wave 2 may not move beyond the start of minor wave 1 above 2,490.87.
Second and fourth waves within diagonals are usually very deep; a range is given for the common depth.
Minor wave 3 would have to move below the end of minor wave 1 at 2,417.35. Minor wave 3 downwards of a leading diagonal should still exhibit an increase in downwards momentum and should still have support from volume.
TECHNICAL ANALYSIS
WEEKLY CHART
Click chart to enlarge. Chart courtesy of StockCharts.com.
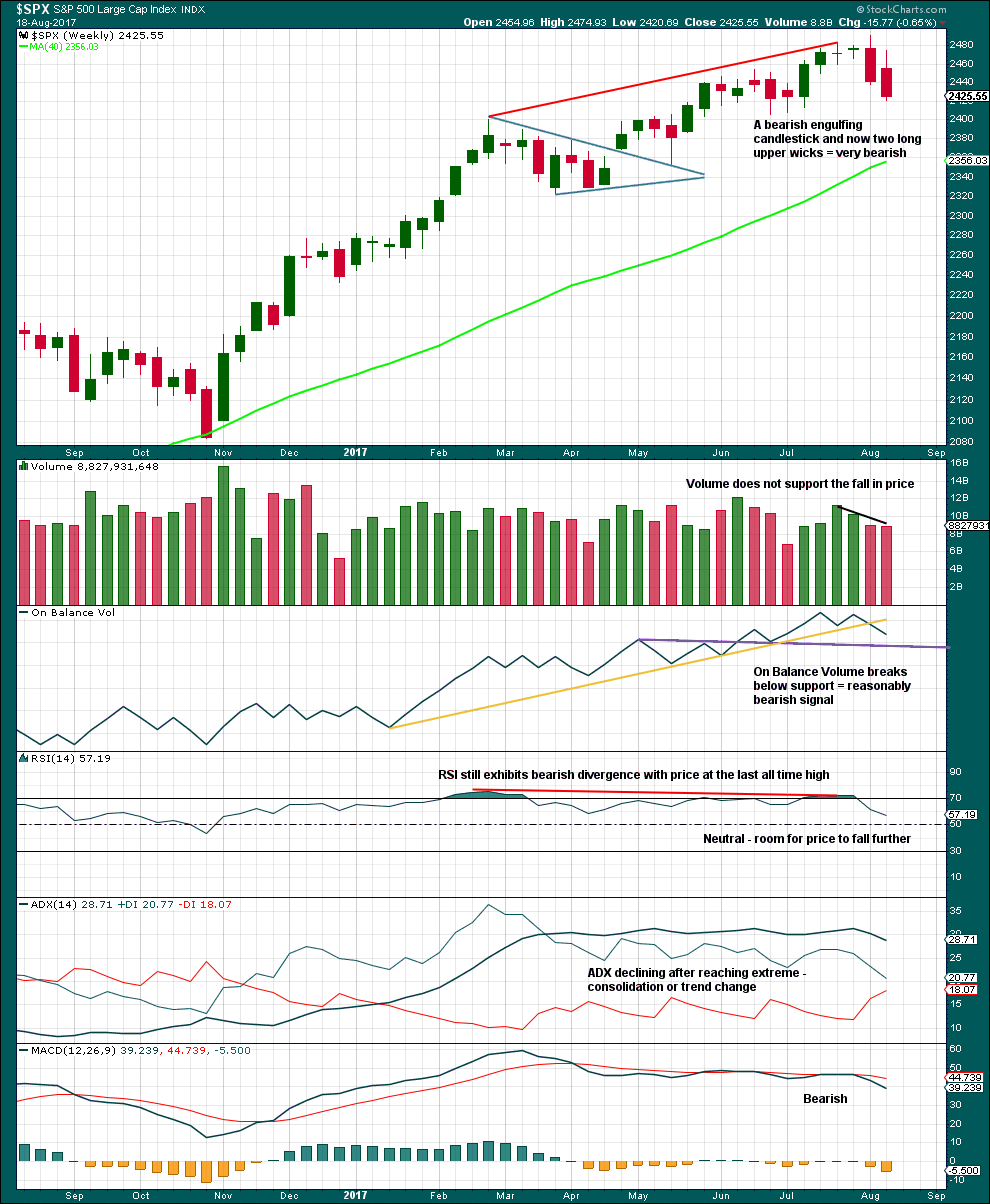
Another red weekly candlestick is very bearish. Long upper wicks now on two weekly red candlesticks are bearish. A Bearish Engulfing pattern is the strongest reversal pattern.
On Balance Volume has given an important bearish signal with a break below the yellow support line. This line has been tested five times before and is long held, but it has a reasonable slope. This is a reasonable bearish signal, not a very strong one.
RSI, ADX and MACD all remain bearish.
This weekly chart offers stronger support to the Elliott wave count.
DAILY CHART
Click chart to enlarge. Chart courtesy of StockCharts.com.
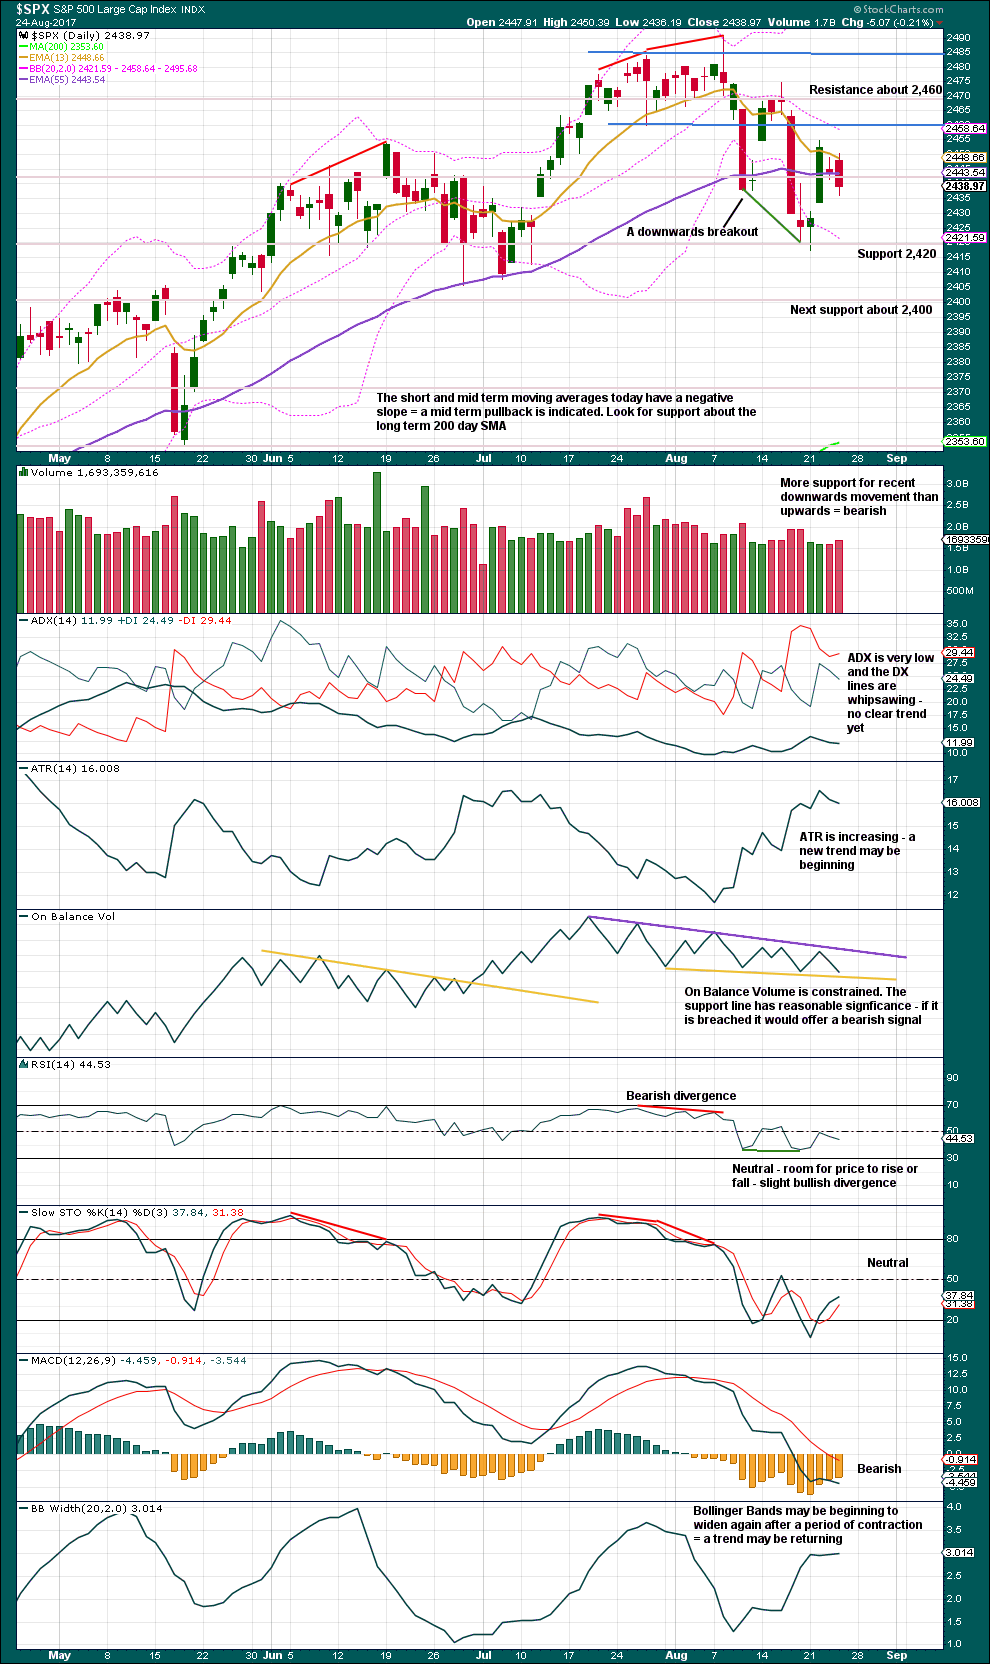
Again, StockCharts has retrospectively changed volume data. After yesterday’s session, it was noted that volume was slightly lower than the prior session but today shows a slight increase.
Today printed another red daily candlestick with the balance of volume down. A further increase in volume is bearish.
The volume profile short term remains bearish.
On Balance Volume will be watched carefully in the next one to few days. It is at support today and this may initiate a small bounce for price. But if not, then it would give a reasonable bearish signal. A signal here would be given reasonable weight because the support line is almost horizontal.
VOLATILITY – INVERTED VIX CHART
Click chart to enlarge. Chart courtesy of StockCharts.com.
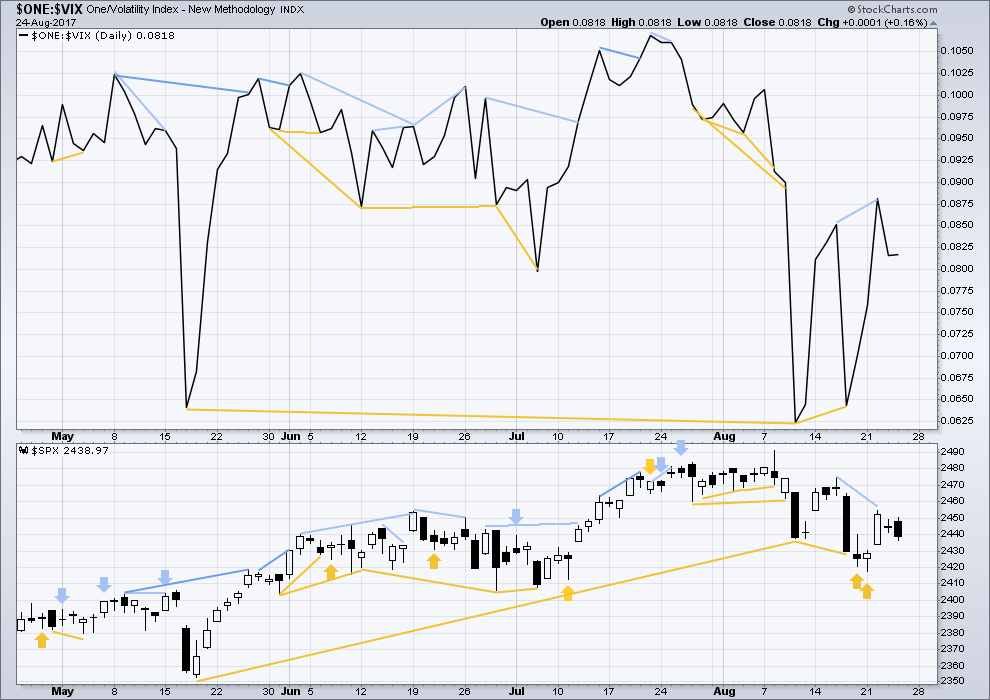
Normally, volatility should decline as price moves higher and increase as price moves lower. This means that normally inverted VIX should move in the same direction as price.
Last bearish divergence noted has now been followed by two red daily candlesticks, so it is now considered to be resolved. No new divergence is noted today.
BREADTH – AD LINE
Click chart to enlarge. Chart courtesy of StockCharts.com.
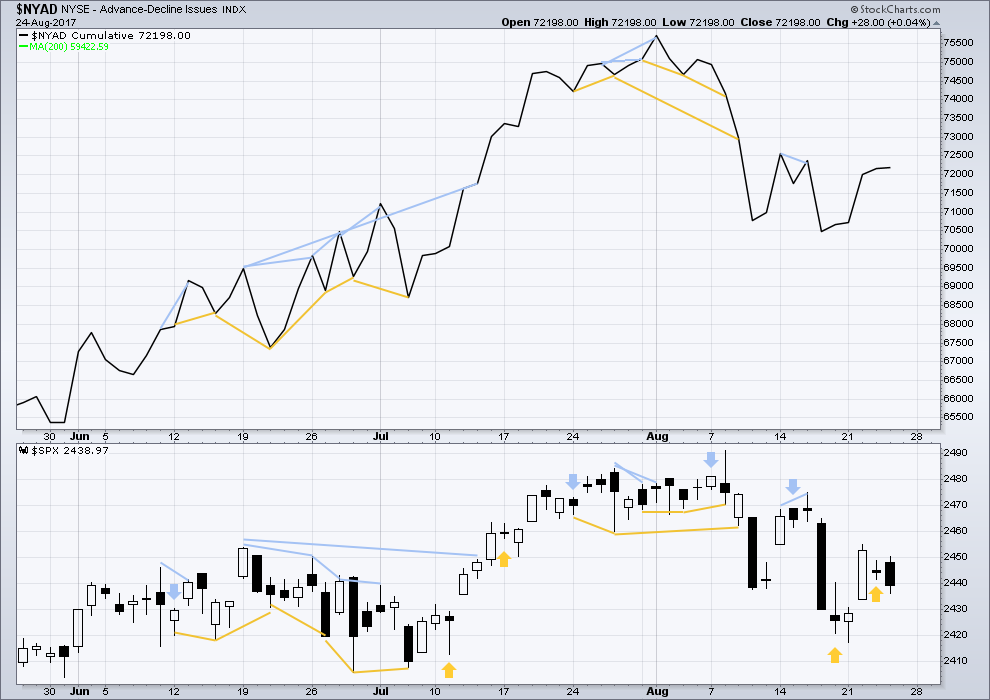
With the last all time high for price, the AD line also made a new all time high. Up to the last high for price there was support from rising market breadth.
There is normally 4-6 months divergence between price and market breadth prior to a full fledged bear market. This has been so for all major bear markets within the last 90 odd years. With no divergence yet at this point, any decline in price should be expected to be a pullback within an ongoing bull market and not necessarily the start of a bear market.
Bullish divergence noted in last analysis has been followed by a red daily candlestick, so it is considered to have failed. No new divergence is noted today between price and breadth.
DOW THEORY
The S&P500, DJIA, DJT and Nasdaq have all made new all time highs recently.
Modified Dow Theory (adding in technology as a barometer of our modern economy) sees all indices confirming the ongoing bull market.
The following lows need to be exceeded for Dow Theory to confirm the end of the bull market and a change to a bear market:
DJIA: 17,883.56.
DJT: 7,029.41.
S&P500: 2,083.79.
Nasdaq: 5,034.41.
Charts showing each prior major swing low used for Dow Theory are here.
Published @ 11:37 p.m. EST.
Well, could the grave-stone dojis in DJI and SPX be telling us something about the life expectancy of the upward correction? 🙂
If you have an account with Scottrade I suggest you take your trading capital elsewhere. I have been a customer for over ten years and something has gone terribly wrong with the company the last three or four months. Not only are they displaying erroneous pricing data and sometimes unacceptably slow in executing trades, increasingly customers are finding themselves unable to log into their trading accounts. This obviously can be a huge disaster for active traders. I have not been as adversely affected as my accounts with them are for long term trades, but nonetheless, this kind of sloppy service should not be allowed custodian of other people’s money. Considering where this market is most likely headed the next several weeks, it may be wise to move funds to a different broker, particularly if you are an active trader.
They have agreed to be bought out by TD Ameritrade (also supposedly not a very good service provider) so I am not sure if this has anything to do with the pending merger. Either way, they are experiencing very serious problems with their platform of late.
That’s interesting Verne. I’m with Schwab and am very happy there but recently, twice this quarter, I have placed trades to execute at “market” but the trade has not executed due to some software issue somewhere down the line….the trade has been held up for hours and I was not able to cancel. The trade did execute but at a different price than what I expected. At this point I am only entering “limit” trades. An interesting development considering your experience with Scott Trade. Overall I am very happy with Schwab….customer service is fantastic with never a hassle.
My short and mid-term trading accounts are with Options Express and have been for awhile. Their platform does not have too many bells and whistles but I am a fairly simple trader in that regard and have been quite happy. They were bought out by Schwab and we will be migrating to their service in October so I also will soon be a Schwab customer. I heard good things about IB and would like give them spin for the exact reason Olga mentioned- currency diversity.
I’m also with Schwab. Very happy too. I use their StreetSmartEdge cloud platform on a MacBook Pro.
There was a technical problem filling orders on Wednesday. The platform warned me about it when I signed in. First time I’ve ever seen that.
I tried a tiny STB order, just to see what would happen. It didn’t fill when it should have, but I was able to cancel it. Choppy inside day anyway, so I shut down and quit for the day.
I was a broker for Schwab for 4 years (96-2000) and have traded with them ever since. I also have accounts with Options Express an TD Ameritrade. Schwab’s customer service cannot be matched by anybody, and believe me it is built into their corporate culture. Street Smart Edge is a good platform, TD Ameritrade’s Trade Architect is awful. I just had yesterday a bear credit spread changed to a bull credit spread on the Trade Architect platform in a situation that would have the trade cancelled in Schwab or Options Express. I love Schwab but I can’t say the platform, while good, is the greatest anywhere, but I can argue that their brokers and customer service people probably are.
I can highly recommend Interactive Brokers – never had any of the issues that you both mention (can cancel a trade at any time in or out of hours).
Kevin mentioned that he has had problems with the IB TWS trading platform freezing up when too many charts open, but I haven’t experienced that (albeit I only have maybe 5 or 6 charts max open at any one time).
Fee is $1 per 200 shares but what I really like about them is their Forex allows you to trade currencies at mid-market rate then actually withdraw that currency if you choose to a bank account – living in a few different countries, that alone has saved me an absolute fortune in fees / exchange rates especially for high value purchases.
Live US data feed is about $10 a month I think, but is waived if you’ve racked up $30 of commisions in any given month. You can trade all major exchanges afaik, not only USA.
I think there is an inactivity fee after a few months if your portfolio is less than $100K (they pay you interest on USD cash balances)
DJT is down to new lows today….
For some reason my data feed shows different Lara. I show a DJT close of 9133.75 that did not take out yesterday’s low of 9010.19 and up 1.25% from yesterday.
Before I answer questions and look at charts below, this is what I have this morning.
What another boring day! But boring days are followed by excitement and opportunity for profit. It’s hard to not let the dullness lull ourselves into sleep…
I still looks like the upper edge of the base channel is going to be tested.
Minute ii still a zigzag. Minuette (b) within it still a zigzag. Minuette (c) may be an ending expanding diagonal. These are almost never truncated, so subminuette v needs to move above subminuette iii at 2,453.71, and preferably minuette (c) at it’s end needs to move above minuette (a) at 2,454.77 to avoid a truncation. If the final high touches the base channel, then it may react strongly from there.
and with a little more downwards movement at the end of the session, the possible ending diagonal for minuette (c) in this count no longer looks right.
I’m going to label this as Olga suggests. Another second wave correction over.
Could it be a black Monday???
It’s definitely a grey Friday 😀
C’mon Mr M – let’s do one already….
geez Olga,, you must have some clout,, nothing but red after your message
😉 😀
Well atm from todays high price is falling in 5’s and rising in 3’s – so I guess that’s good enough for now….
Opened a small short with a stop at todays high just in case we get a ‘gap and gonner’ down on Monday.
I feel like I am still waiting for that final shakeout…
SPX sure appears to me to be one very ripe apple. With any luck, the little remaining stem breaks, and gravity does the rest! But maybe…not today. The buying pressure just won’t exhaust!! Yet….
SNAP!!!! zzzzzzzzzz….plop!!
Maybe this idea makes more sense ??… leading diagonal for minuette (1).
Deep retrace as you would expect and resolves the truncation.
That’s it, IMO!
Wave 2 in the leading diagonal looks a bit dodgy (should be a zig zag) – but we are at quite low timeframes and I aint got anything else atm 😀
Lara will soon let me know if it’s wrong 😛
It looks good to me. Yep. We could already have the high in place.
And sometimes third waves do start off a bit slow…
If we don’t get a new high then this may be a better idea than mine.
Of late the long upper wicks have been a reliable prelude to a plunge…
One bounce of the 50% retrace (which was also the upper 5 minute keltner channel as I have the paramaterized), perhaps a second any moment. If we get price passing the new 5 minute swing low and past the 38% retrace fibo…I’m jumping on it. And jumping even harder if I see DIA/QQQ/IWM falling in some kind of synchrony.
Failed double zig zag maybe???….. 😀
Whatever we end up labeling it… I agree that minor 2 is done. That double top seals it for me (unless/until it’s broken to the upside!!). If action continues sideways for a day or two, obviously I’m wrong. But I’m watching closely for an accelerating momentum down starting, oh, any minute or hour now.
Fibo’s on this morning’s downmove indicate a turn back down could be soon. Already at 38% retrace. I’m pretty confident in a turn back down no higher than the 62%, but we’ll see. Lots of symmetric resistance in the 50% to 62% zone as well.
Anyone know the exact timing of Yellen speaking and/or key minutes being release etc, today from Jackson Hole? The kind of thing that causes the market to start acting like an epileptic seizure for a few minutes? Very good to know when that’s coming. 2pm EST today perhaps?
Ooops, finished already. Well, wasn’t that a non-event.
Draghi at 3pm EST. He loves to trash the market.
It did have a big effect on Gold. But not the S&P
could be we are in wave 2 of minute C of minor 2
looks like a five down on the 5 min chart
I agree – looks impulsive – but we ended on a 3 wave structure upwards so this wave down (if it was a 5) is more likely to be a (c) wave rather than the start of a third imo.
Could also be a zig zag – very hard to tell the difference between a zig zag and an impulse at low time frames imho.
If price invalidates a final impulse upwards here, it will create more questions for me than it answers. An impulse to a slight new high would make life alot easier.
Anyone think this could work. How about seeing wave up from Aug 21 low as a 3 wave structure to finish minute 2 at 2454.77 rather than a A wave and now we have completed and expanded flat second wave correction of minor 3 down already started with confirmation by taking out yesterday’s low and lower trendline of green channel? One problem is trying to see last movement up as a 5 wave structure to complete C wave however maybe it is possible on smaller time scale. Safest thing would be to add onto shorts with breach of channel to downside or hitting top of channel.
Looks very much like a ‘3’ up from recent lows to me on all timeframes (even low ones).
We still not invalidated a 5 wave up yet imo. I need to see 5 waves up to complete this leg however I count it. Also need to make a slight new high to avoid a truncation.
I suggested this yesterday, and I’ll through it out there with a chart today. The minor 2 finished 3 days ago, we’ve been doing a minor 3 leading diagonal for 2 days, and now we have the minute 2 of the minor 3, and the minuette 1 down of the 3 of the minor 3 down, etc. Chart….
That doesn’t get much support from this knowledgeable community because folks expect that a 3 here should kick off with a vengeance, not a wimper!! That said, you could be correct. The big question is, are we eventually dropping out of this mess and getting on the the big 4 down? Or…not?? Me, I’m long again for a few minutes…lol!!! Market action is, in the end, all that matters. But check back in a hour…
If symmetry with the push up and move back down 1-2 weeks ago continues…we are EXACTLY at 13:15 on 8/16. Easy to see on a 3 week 15 minute of SPX. Obviously, what happens next is a lot of down. At some point this structural symmetry will stop, but until it does stop, it continues, probably because investor sentiment etc. is going through the exact same cycle.
Speaking of symmetry, at the moment the move down here is exactly the size of the move down yesterday morning. And just short of the length move the move down the morning of the day before, as well.
I always load up shorts in anticipation of the third wave down , and then get stuck in a weird corrective second . The only thing that has me thinking is both sentiment, and the fear index .
https://www.dailyfx.com/sentiment#pairsSPX500
http://money.cnn.com/data/fear-and-greed/
I would feel more conformable going short if these 2 indicators were pointing the other way . Thoughts please .
Well, there you have it folks. That long upper wick the last few iterations has been an unmistakable sign. Once again, have VERY great weekend! 🙂
But the fat lady hasn’t sung yet today, Verne. I don’t doubt you are correct, but note that all the market has really done here is fill the gap. It continues to be a “distribution by the big/smart money” market, as I see it. They shove it up with a little cash, distribute as much as they can as it sells off, rinse and repeat. Hence, the “increased volatility”.
Granted. I’m merely pointing out that whether she sings today or in the very near future, sing she will! 🙂
She darn well better be good, we’ve been waiting quite awhile!!! Meanwhile, I’ve started to humm to myself with a little long after my earlier short (with BE stop already, I like it!!)…up and down, down and up, riding the little waves! What’s a hungry surf nut to do??
One last push?…
Gotta go above (a) to avoid a truncation.
Also posted idea below with 2 as an expanded flat (so wave 1 is lower)
Maybe, or perhaps we had a leading diagonal for minute 1 of Minor 3, and we just finished minute 2. In which case, watch out below.
I believe to confirm a leading diagonal, the minor 2 needs to kick above the upper base channel, which it has not yet.
Close for both of us…but no cigar!! I did short a bit as it broke from the top, and closed under the assumption a turn would happen. Oh well, a chunk out of the middle is never a bad thing!
If C waves are supposed to be a 5…then did this C wave start at the low yesterday, do a 1 and 2 yesterday, we’ve seen the 3 this morning, and are now in the 4??
Ala, this?
Thats what I had but wave 1 might also be lower down (wave 2 an expanded flat)
chart…
FWIW, the certifiably moribund sectors of retail and automotive are showing surprising signs of life today. The generous buyers bidding up those sectors and leaving that pile of money in the proverbial corner should certainly be shown some appreciation! 😉
I’ve cashed my few scalp longs, I’ve closed my small Euro position on the significant currency moves this morning, and now I’m just waiting for the beginning of wave 3 down! I see price stalling at this 62% fibo, right where it turned 3 days ago. I will short on a break downward here; the market is whippy, and the whip is highly extended up. I’ll still put my vote on hourly main, but not my $ until some kind of trigger.
We are close enough to completion of what I expect is some kind of c wave. I am loading the remainder of my short positions on this jaunt higher and will leave the bulls to enjoy the ride. Have a great week-end everyone!
Lara wrote:
“In the first instance expect very strong resistance at the upper edge of the blue base channel.
If price moves higher above the upper edge of the base channel, then the alternate below should be preferred as soon as that trend line is breached and before the invalidation point is passed.”
We are approaching the upper edge of the blue colored base channel line. I have it about 2455 right now. Must hold. If we go above it, new ATHs become a reasonable projection.
The elusive 3rd wave down continues to elude and disappoint. It seems to appear on the charts and yet, it vanishes before our very eyes.
I know 🙁
It sure is looking like we are going to have to wait until next week for our third wave down. I expect the clowns at Jackson Hole to take one last swipe at the bears with some kind of dopey dovish statement that will get the bulls all giddy for at least one more day.
Agreed. Have a great weekend.
I suppose it is entirely possible for minute ii to complete today with the third wave down beginning. I just suspect price will meander sideways for quite a while.
I suspect the alternate may be correct. The pull of a third wave really should have limited the duration of that minute second wave. I always fall back to that old bromide- “If yer hsveta ask if it is a third wave…” 🙂
They tried to smash the Yen but got nowhere.
They are now entirely focused on smashing Vix.
I am adding to my long positions on today’s slump.
Number 1
You got it Ronald! Have a great day reigning as champion. I don’t mind if I am not #1 as long as that wascally wabbit isn’t.