
Downwards movement was expected for Wednesday’s session.
Summary: It now looks likely that primary wave 3 has ended and primary wave 4 may be beginning. Some confidence in this view may be had if price makes a new low below 2,462.17.
Primary wave 4 may be expected to last at least 8 weeks and may end about 2,320.
Alternatively, if price makes a new high tomorrow, then the target for primary wave 3 to end would be at 2,497.
New updates to this analysis are in bold.
Last monthly and weekly charts are here. Last historic analysis video is here.
MAIN ELLIOTT WAVE COUNT
WEEKLY CHART
Click chart to enlarge.
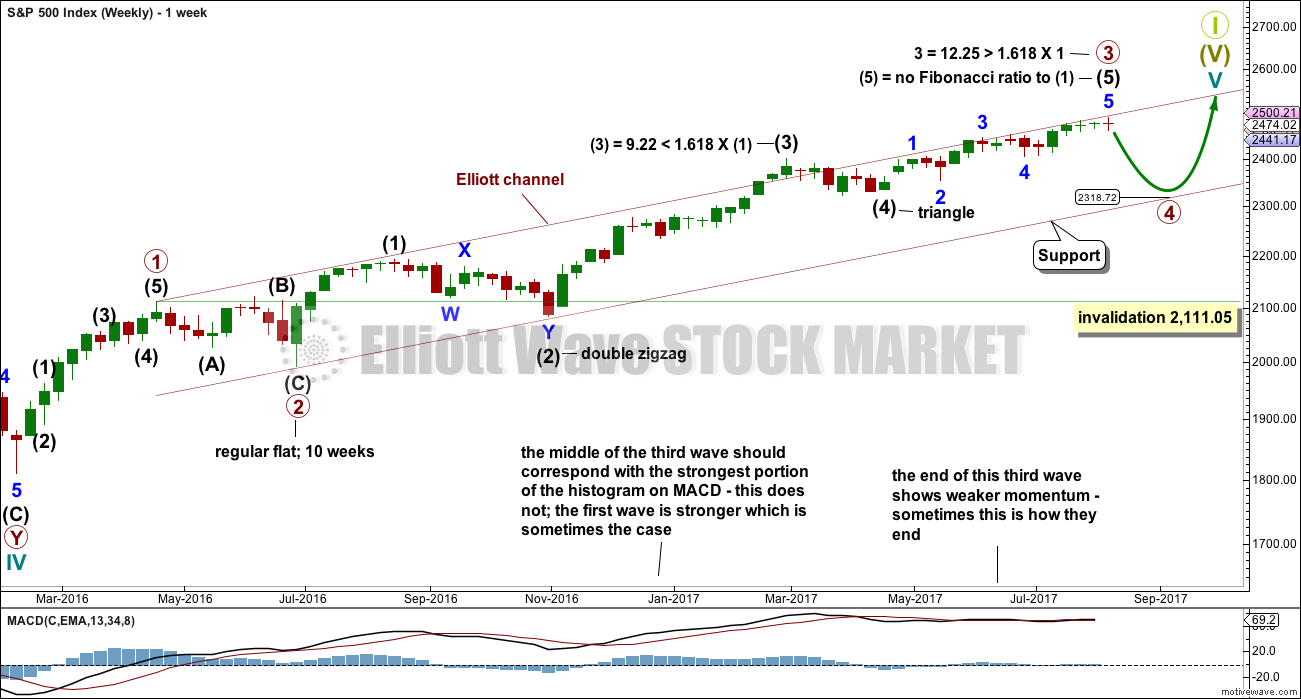
It is possible that primary wave 3 is complete. However, some confidence may be had in this view only with a new low below 2,462.17 now. Further and substantial confidence may be had if price makes a new low below 2,405.70. Fibonacci ratios are calculated at primary and intermediate degree. If primary wave 3 is complete, then it still exhibits the most common Fibonacci ratio to primary wave 1.
Primary wave 4 may not move into primary wave 1 price territory below 2,111.05.
Primary wave 4 should last about 8 weeks minimum for it to have reasonable proportion with primary wave 2. It is the proportion between corrective waves which give a wave count the right look. Primary wave 4 may last 13 or even 21 weeks if it is a triangle or combination.
If primary wave 4 reaches down to the lower edge of the Elliott channel, it may end about 2,320. This is very close to the lower range of intermediate wave (4); fourth waves often end within the price territory of the fourth wave of one lesser degree, or very close to it.
If price reaches the target at 2,500 and either the structure is incomplete or price keeps rising, then the next target would be the next Fibonacci ratio in the sequence between cycle waves I and V. At 2,926 cycle wave V would reach 1.618 the length of cycle wave I.
At the end of last week, Lowry’s analysis favours the idea that primary wave 4 has begun.
DAILY CHART
Click chart to enlarge.
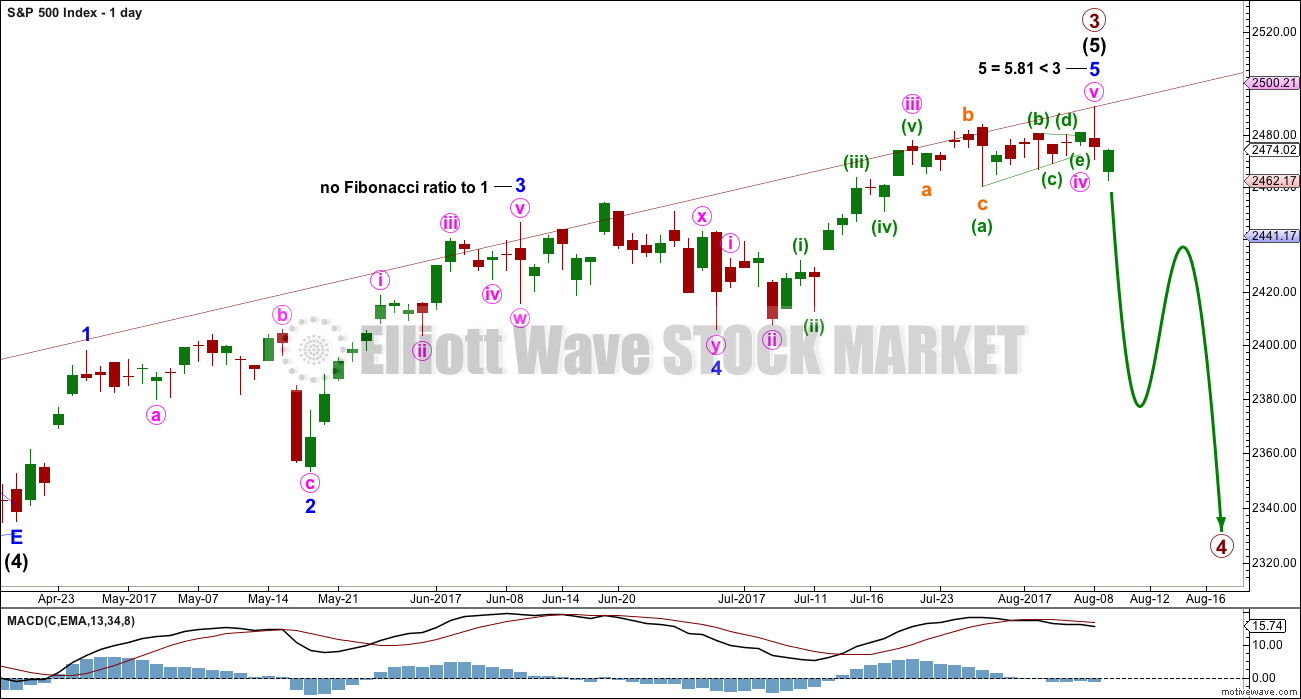
The daily chart shows only the structure of intermediate wave (5); this structure is an impulse.
There is perfect alternation between the deep expanded flat of minor wave 2 and the shallow double zigzag of minor wave 4.
There is now an adequate Fibonacci ratio between minor waves 5 and 1. Minor wave 3 exhibits strongest momentum and is the longest actionary wave, so this wave count fits with MACD.
HOURLY CHART
Click chart to enlarge.
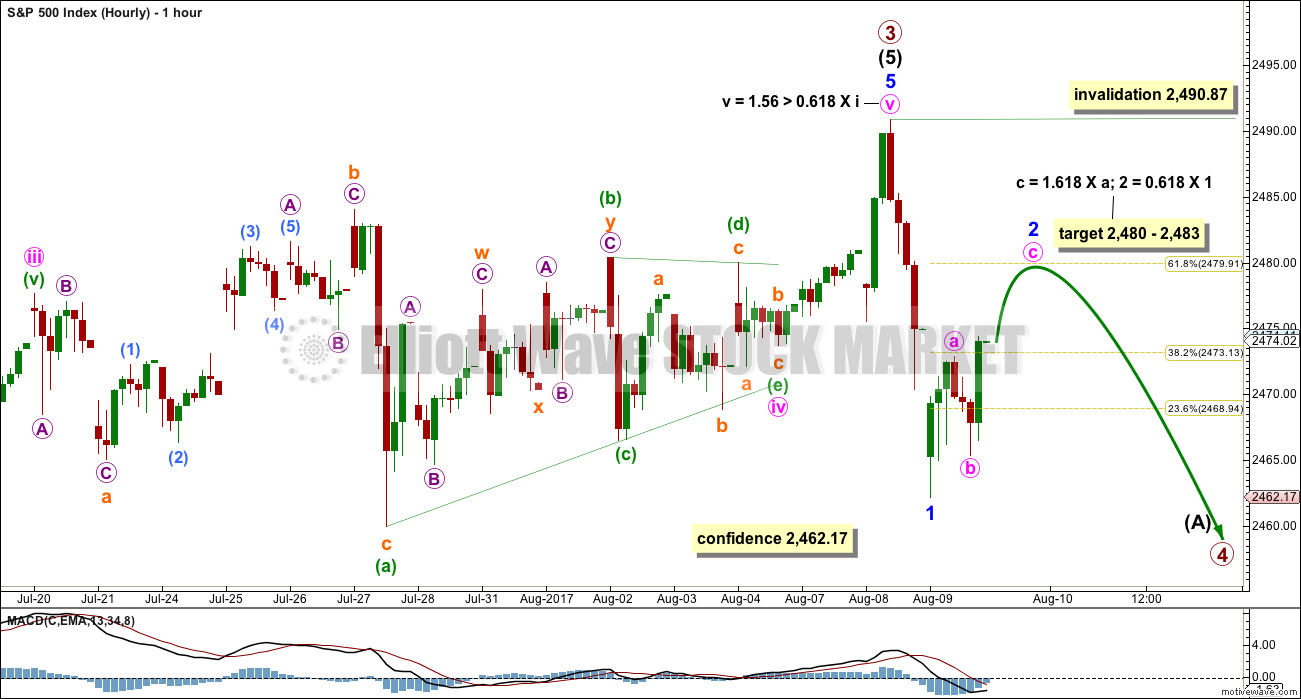
Minute wave iv will fit as a regular barrier triangle. There is an adequate Fibonacci ratio between minute waves v and i.
A first wave down to begin primary wave 4 may be complete. Sideways movement for Wednesday’s session may be an incomplete zigzag for minor wave 2. A target is calculated at two wave degrees for minor wave 2 to end tomorrow.
Thereafter, this wave count would expect to see an increase in momentum as a third wave down unfolds.
Minor wave 2 may not move beyond the start of minor wave 1 above 2,490.87.
ALTERNATE HOURLY CHART
Click chart to enlarge.
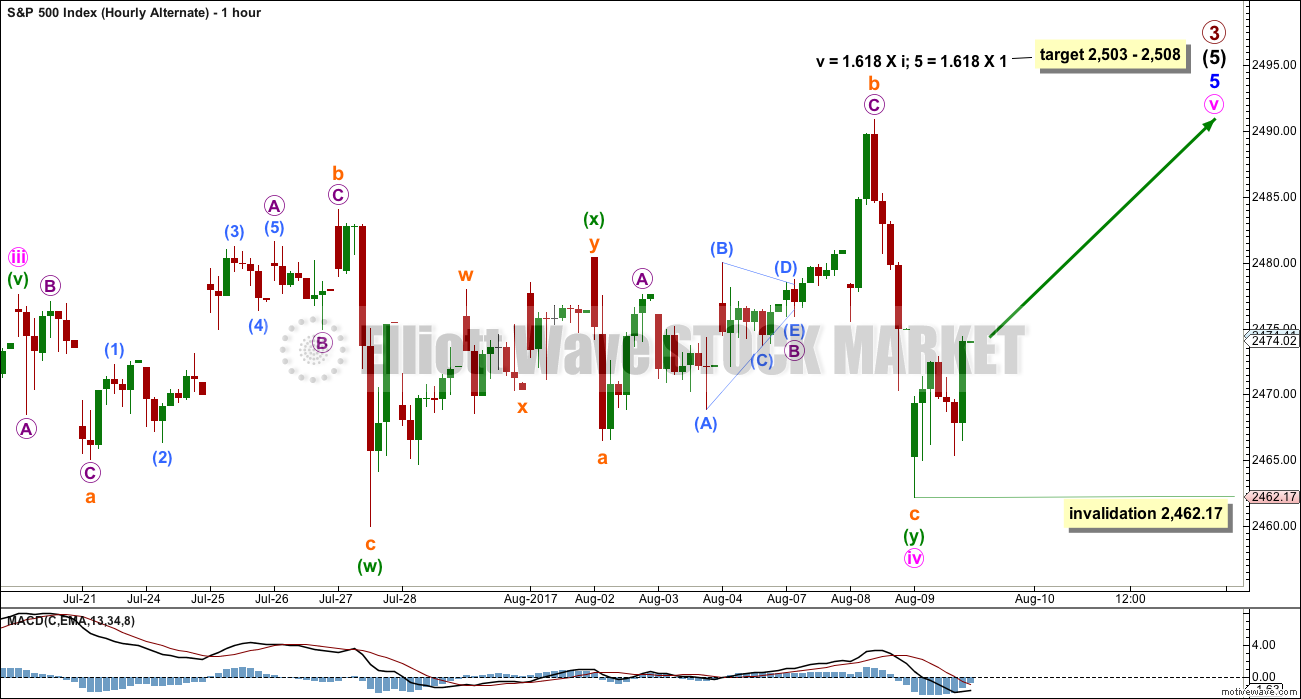
It is still possible that primary wave 3 may not be over. Within minor wave 5, minute wave iv may have ended as a double flat correction.
There are two main problems with this wave count which must reduce its probability:
1. Double flat corrections are one of the rarest Elliott wave structures; they are rarer than running flats.
2. Minute wave iv would have lasted 14 days, which is grossly disproportionate to 3 days for minute wave ii.
A target is calculated for minute wave v at two wave degrees. If price makes a new all time high, then this wave count should be used; the main wave count would then be invalidated.
TECHNICAL ANALYSIS
WEEKLY CHART
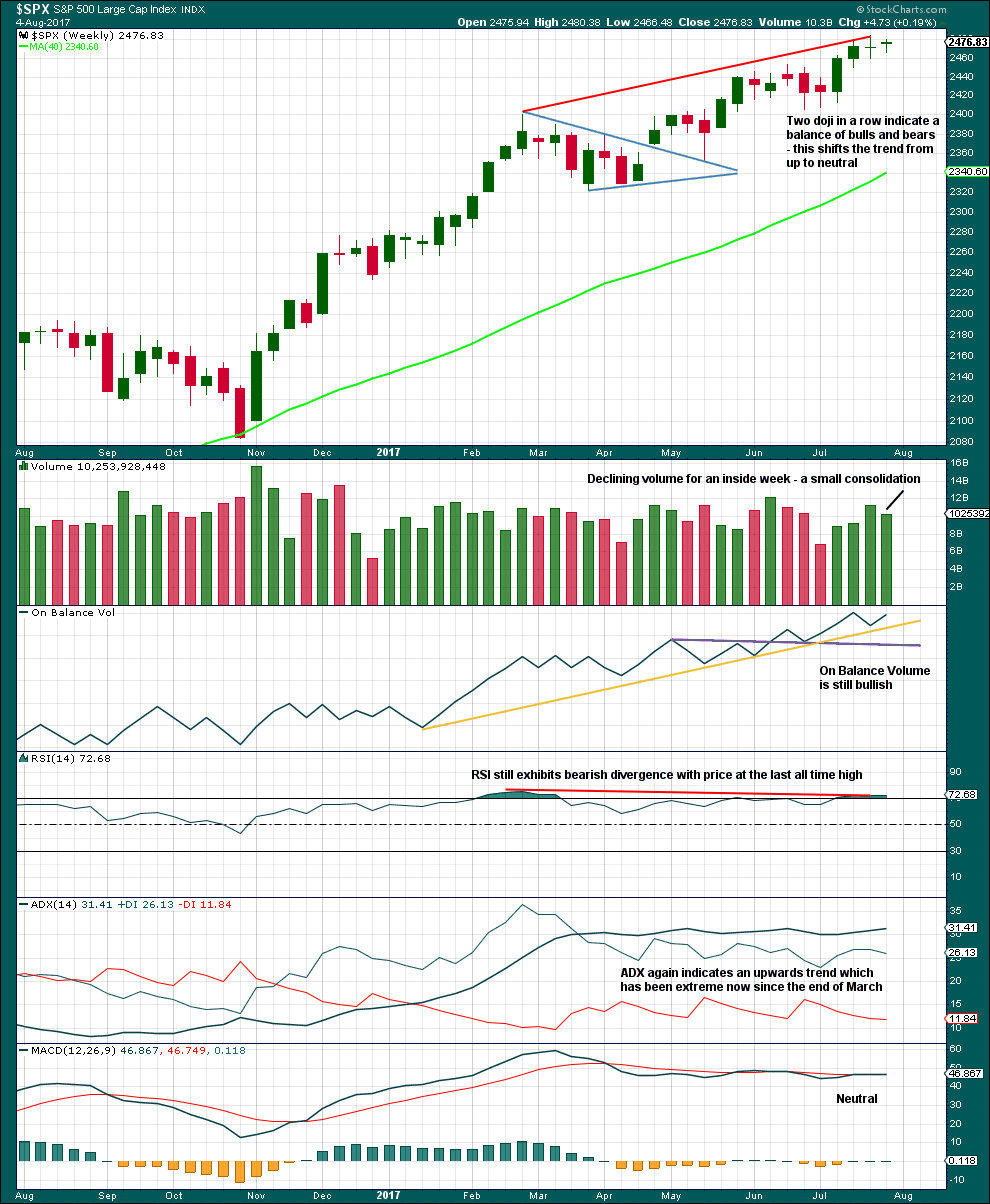
Click chart to enlarge. Chart courtesy of StockCharts.com.
RSI, ADX and the two doji support the idea that primary wave 4 has begun.
DAILY CHART
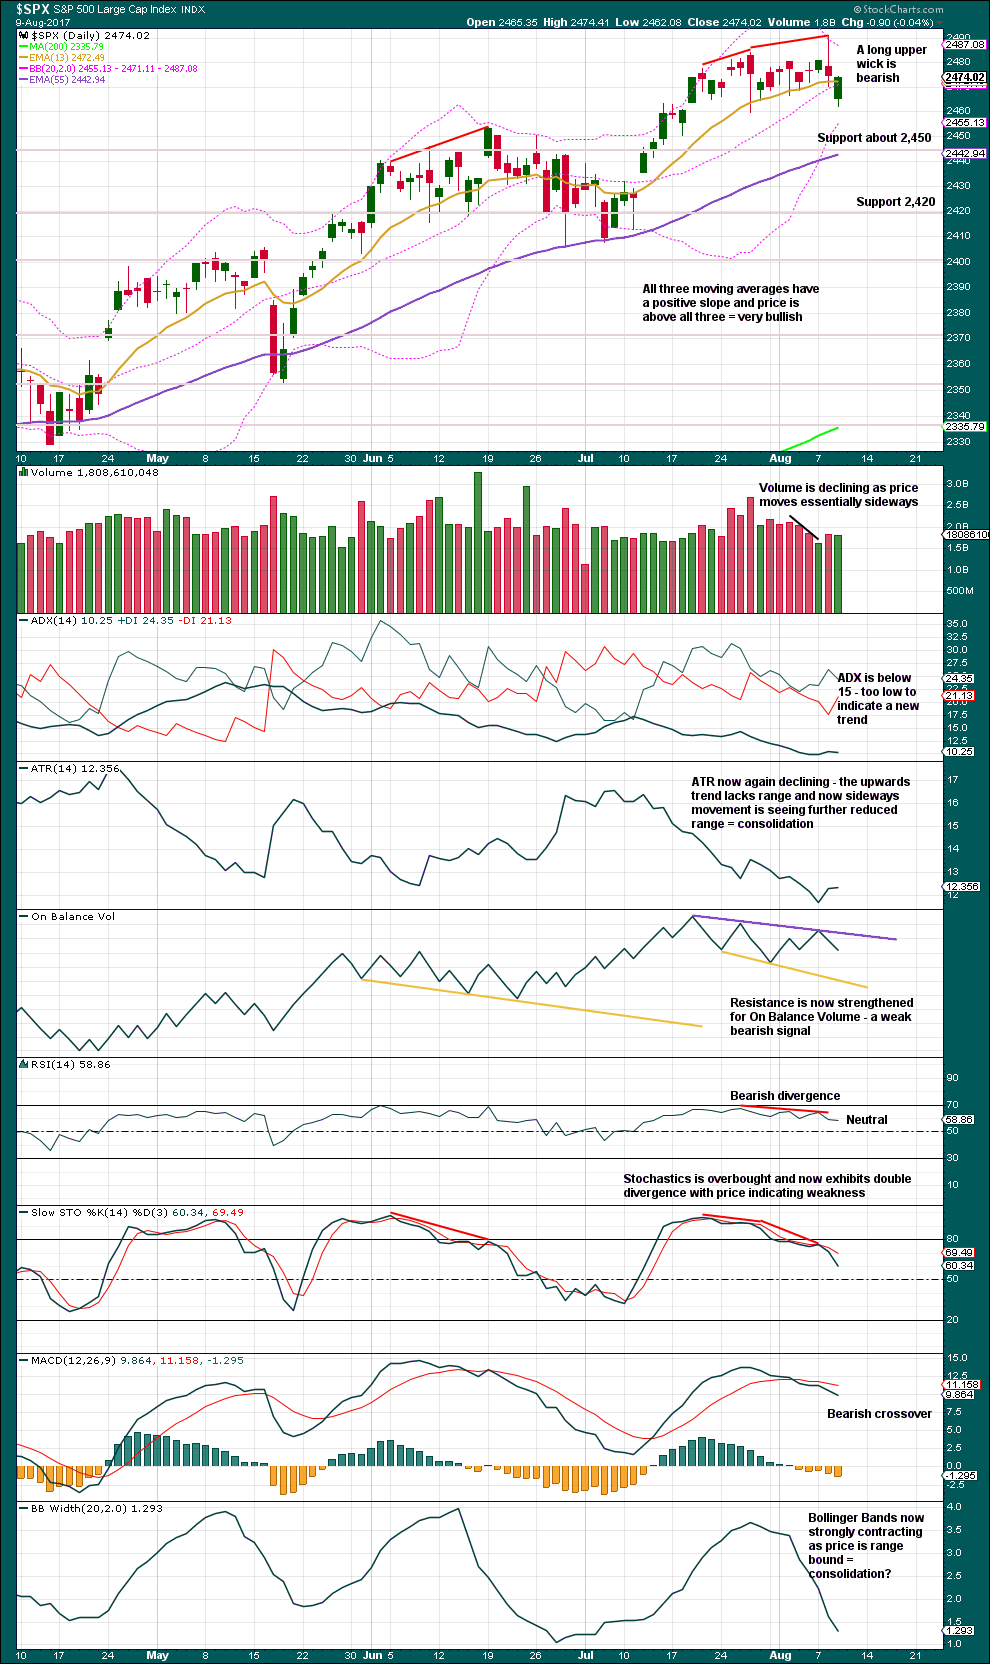
Click chart to enlarge. Chart courtesy of StockCharts.com.
The S&P500 entered another sideways consolidation back on the 19th of July. During this consolidation, it is the downwards day of the 27th of July that has strongest volume suggesting a downwards breakout here is more likely than upwards.
We need to see a breakout either above about 2,485 which must have support from volume, or below 2,460 which preferably (but not necessarily) should have support from volume. After the breakout, expect a back test and then for price to move away from support / resistance.
Double divergence now with price and RSI and price and Stochastics, bearishness from On Balance Volume, and bearish MACD all suggest a downwards breakout is now more likely.
Looking back at cycle wave IV, which had strong falls in price in August 2015 and January 2016, Bollinger Bands remained tightly contracted right up until the day that price began to fall strongly. That may happen again here. Contracted Bollinger Bands are not a concern for the Elliott wave count.
VOLATILITY – INVERTED VIX CHART
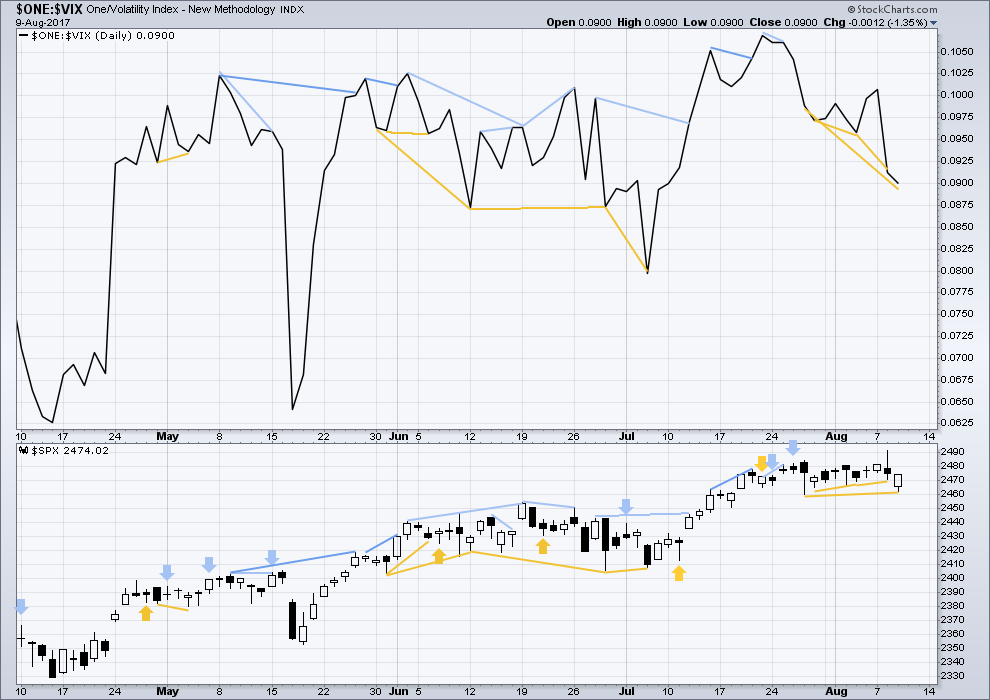
Click chart to enlarge. Chart courtesy of StockCharts.com.
Normally, volatility should decline as price moves higher and increase as price moves lower. This means that normally inverted VIX should move in the same direction as price.
There is new bullish divergence between lows of the 27th of July and 9th of August: price has made a higher low, but inverted VIX has made a lower low. This indicates an increase in volatility today was not matched by a corresponding decline in price; there is weakness today within price. However, the slightly higher low for price is so slight this divergence should not be given much weight.
BREADTH – AD LINE

Click chart to enlarge. Chart courtesy of StockCharts.com.
With the last all time high for price, the AD line also made a new all time high. Up to the last high for price there was support from rising market breadth.
There is normally 4-6 months divergence between price and market breadth prior to a full fledged bear market. This has been so for all major bear markets within the last 90 odd years. With no divergence yet at this point, any decline in price should be expected to be a pullback within an ongoing bull market and not necessarily the start of a bear market.
There is new bullish divergence between lows of the 27th of July and 9th of August: price has made a higher low, but the AD line has made a lower low. This indicates a decline in market breadth today was not matched by a corresponding decline in price; there is weakness today within price. However, the slightly higher low for price is so slight this divergence should not be given much weight.
Lowry’s measures of internal market strength and health continue to show a healthy bull market. While the bull market overall remains healthy, there are signs at the end of this week of some short term weakness which may indicate a pullback to develop here. This supports the labelling of the Elliott wave count at the daily chart level.
DOW THEORY
The S&P500, DJIA, DJT and Nasdaq have all made new all time highs within the last month.
Modified Dow Theory (adding in technology as a barometer of our modern economy) sees all indices confirming the ongoing bull market.
The following lows need to be exceeded for Dow Theory to confirm the end of the bull market and a change to a bear market:
DJIA: 17,883.56.
DJT: 7,029.41.
S&P500: 2,083.79.
Nasdaq: 5,034.41.
Charts showing each prior major swing low used for Dow Theory are here.
Published @ 09:24 p.m. EST.
A quick note about today’s VIX candle. In hindsight, the long upper wick yesterday instead of signaling the usual capitulation. possibly reflected the smart traders getting out early and the lemmings jumping on the short side. Today’s big fat candle suggests and orderly and systematic exit on the part of quite a few. It makes perfect sense as it seemed hardly likely that the long standing massive short trades would unwind in a single session. I definitely was not thinking when I got spooked out of my short trades yesterday.
At any rate, the bottom line is we do not yet have a panic. That will probably come with a monstrous upper wick as traders exit en masse. It will be an excellent time to take a shot at the 10X trade when it happens. 🙂
Nice bearish engulfing candle today on USO. Some smarty pants holder of calls I sold a few weeks back snuck up and assigned me a week early. I did not mind being short the shares. Anyway, USO 10.50 puts expiring next week look particularly tasty!
Have a great evening everybody and, “Party on…Garth!” 🙂
Well Verne… 16.06 VIX
So it closed above this magic 15… so now what happens?
A whole lot depends on what happens overnight Joseph. Leveraged longs who used short vol trades to fund their trades should be in a whole lot of hurt right now. A lot of them are going to be getting visits from their risk managers at the close of the day who are gong to want to know how they are going to extract themselves from the bind they are in. The smart ones are gong to unwind and we should see a massive vol spike tomorrow. If they all do it is going to be YUGE. Some of them are going to double down if they can borrow more money are get an extension on their margin calls while they hope VIX does not keep rising. IF we do not get a second wave bounce tomorrow they are TOAST!!
If we do get a bounce they will probably use it to run like bats out of hell and VIX is going MUCH higher after they get out. Either way tomorrow is going to be lots of fun watching them scramble! 🙂
Hourly chart updated:
A five down now completing. While price remains within the Elliott channel assume it’ll keep falling. When the channel is breaches minor 1 would be over and minor 2 would have begun.
Looks like P4’s finally arrived folks.
Almost a complete five down. VIX moving back above 15 suggests the battle still joined.
As expected, they are stepping in to defend the VIX 15.00 pivot.
This is the line in the sand, they absolutely cannot allow VIX to close above this level. Look for increasing selling pressure to drive it lower into the close.
There is no guarantee they are going to pull it off. If we have a primary degree change underway it will keep trending higher and the B bands will continue to expand.
A close above 15 and look out below! 🙂
Here they come again… the BTFD crew!
VIX back above 15. If it is not putting in a double top, there will be blood…!
It sure is tough to tell whether the move down from the top is a three or a five!
Not even a bounce in sight. wow.
I’m watching red dawn just in case…..go wolverines
Looking like the VIX short traders are going to live to fight another day. I don’t think it is going to clear the 15 handle barrier…at least not yet. SVXY putting in a long lower wick so some deep pockets are coming to the rescue. We may have an interim low in place.
All the BTFD are watching the tape and thinking…”Any minute now we head back up to the moon…”.
It is going to be side splitting to see if it dawns on them today that “Not so fast…!”, and they all run screaming for the exits as if their hair was on fire, to quote an old friend! 🙂
Here they come… the BTFD crew!
Get ready for an epic battle. All the complacent, reckless money managers falling for the mad notion of selling vol and leveraging their long trades and criminally ignoring their fiduciary responsibility to respect VAR constraints in their trading positions are facing some serious comeuppance. If VIX crosses 15 today they are going to have to go crying to the banksters for help.
15.36 high
Yea… Sorry, the era of bailouts is over!
Shorting VOL and shorting the 3X short ETF’s has been… “a Sure Thing” “a Lock” since those ETF’s were created.
They have now gone several VIX spike cycles without being forced to unwind. It is looking as if they are going to survive yet another one today. It may well be that this cohort is going to remain entrenched until we put in a final market top.
Under normal circumstances, what one should now expect is reversion to the mean plays out with VIX returning to recent lows. I would argue that true macro-economic risks are still not being priced into the market, and certainly not geo-political risks. I suspect our sleepy normalcy bias is going to be rudely interrupted by some exogenous shock. I don’t think it is a matter of “if”, just “when”.
Continuing to muse on the principle of reversion to the mean.
There is absolutely no doubt about it. Over the last several months volatility has been beaten into a blood pulp. The kind of suppression we saw in vol price was historical. The consecutive closes below 10.00 never before having been seen in the entire history of the VIX. I suspect the bludgeoning of the VIX is now something that if firmly entrenched in the minds of the volatility smashers and it is going to take more than a day or two of market decline to disabuse them of the notion that they can abolish the principle of reversion to the mean. Are the volatility smashers themselves about to royally smashed??!! 🙂
I expect they are.
I thought spy option pricing (the basis for the “volatility” index, arguably a misnomer) was driven primarily by mathematic models driven by actual price volatility. I.e., the vix is low because spy options prices are low because price volatilty of the SP500 index is low and as a result BlackShcholes cranks out the “optimal” (low currently) price. Or something along those lines, implying that the only real way to drive the vix up is create increased price volatility in the actual market, and vice-versa. On the other hand, a blend of vix futures prices drives the tradeables like xiv and uvxy, and those future markets are driven more by trader expecation than straight math (hence some occasional odd divergences), and probably manipulable to some degree. That said, I could be all wrong, it’s a complex area.
Question on the main weekly & monthly count:
Stated above is… Primary wave 4 may not move into primary wave 1 price territory below 2,111.05.
Should this occur than what would this mean for the count… weekly & monthly that is?
I would be very interested in knowing, even if speculation. Thank You.
To my mind it would mean that a final top was here!
Not speaking for Lara mind you; just my two cents! 🙂
Thanks Verne…
What Verne said 🙂
🙂
Wow! KSS paid out huge! 🙂 🙂 🙂
KSS looks about ready to return to reality. I watched in happy amazement at it traded as high as 44.14 on Tuesday. I wondered to myself who is giving away all this free money?! 🙂
Naturally, my own convictions about the true state of the retail sector required diligent additions to short positions. The foray above the upper B band did not last long and today we will get a second close below, a fairly reliable reversal trigger.
The 23% pop in Hertz yesterday is another spectacular display of investor insanity. In the era of the ride sharing industry coming of age as a business model who in their right mind is bidding up Hertz??!!
The event horizon for all the giddy bulls using compressed VIX levels to blow up VAR constraints on long positions, and especially leveraged long positions is 15. At that level they will all be forced to unwind. Look for a furious attempt to beat it down if it approaches that level. If it closes at the high today, I am guessing the unwind is going to take place after hours and we could really see some spectacular fireworks as it does.
The last time VIX approached 15 was June 29 and they jumped on it with all four feet. It made another high at 13 on July 6 then went into a swoon to put in a new 52 week low at 8.84 on July 26. It is now sporting what looks like a bull flag so things could get interesting the next few days! I’ll be watching how it acts with respect to the upper B band today. As long as it stays above 10.50 the bulls are not out of the woods.The market has been doing unprecedented things. Perhaps we are about to see that continue in the area of how vol price behaves. Interesting times we are living in!
Germany’s DAX down almost 1% and has already taken out yesterday’s lows. I am starting to think we will follow in its steps…
Bob Kudla of Trade Genius thinks market makers are trying to shake traders out of short positions. If he is right it certainly worked with me! 🙂
At any rate today could be a critical inflection point where the market finally shows its hand. It does look as if 2470 will fall decisively and that Lara’s confidence point of 2462.17 will trigger. A close below 2470 and I will load the trailer.
VIX also moving higher this morning. If it closes higher, that too will be a game changer as it will be the first time I have seen a long upper wick above the upper B band not signal at the very least an interim reversal. Are we about to finally see the mother of all unwinds of the monstrously large VIX shorts??!
Foist!!!
Yikes! Bested by an amateur!