
The diamond pattern was broken but the possible upwards breakout was quickly reversed. The second hourly Elliott wave count expected this but price fell 6.13 points short of the target.
Summary: It now looks likely that primary wave 3 ended today and primary wave 4 may be beginning. Some confidence in this view may be had if price makes a new low below 2,459.93.
Primary wave 4 may be expected to last at least 8 weeks and may end about 2,320.
Alternatively, if price makes a new high tomorrow, then the target for primary wave 3 to end would be at 2,497.
New updates to this analysis are in bold.
Last monthly and weekly charts are here. Last historic analysis video is here.
MAIN ELLIOTT WAVE COUNT
WEEKLY CHART
Click chart to enlarge.
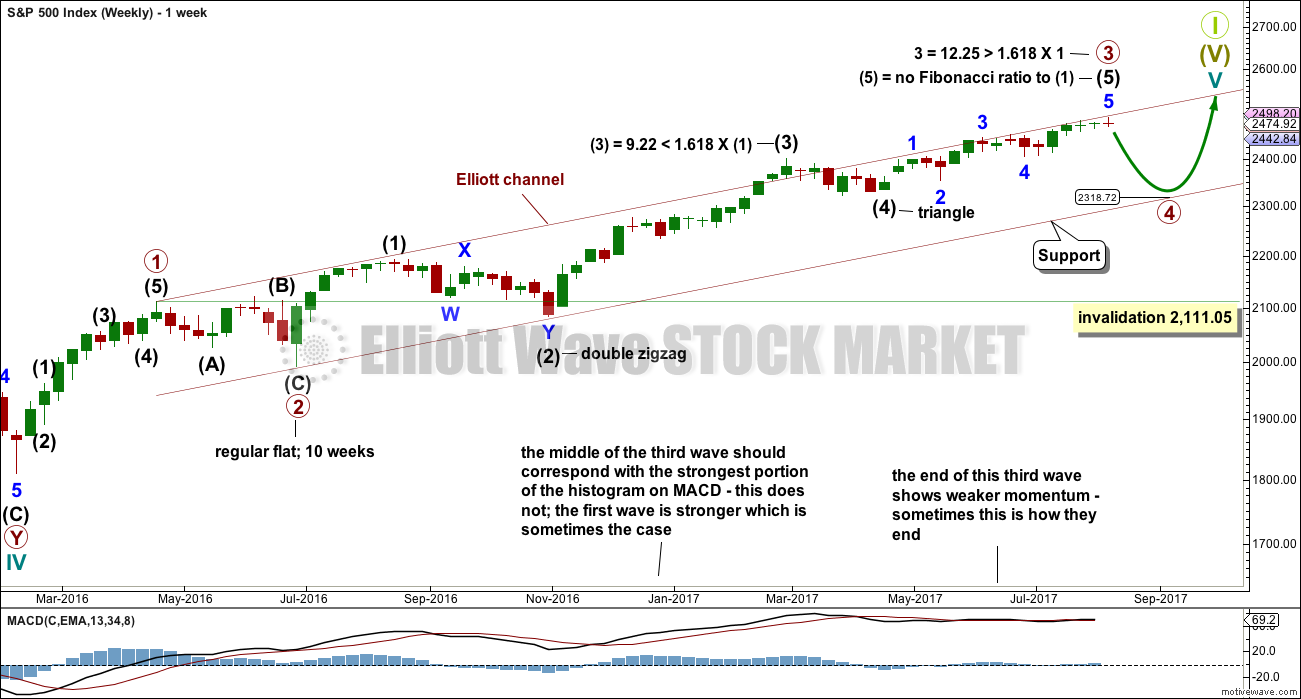
It is possible that primary wave 3 is complete. However, some confidence may be had in this view only with a new low below 2,459.93 now. Further and substantial confidence may be had if price makes a new low below 2,405.70. Fibonacci ratios are calculated at primary and intermediate degree. If primary wave 3 is complete, then it still exhibits the most common Fibonacci ratio to primary wave 1.
Primary wave 4 may not move into primary wave 1 price territory below 2,111.05.
Primary wave 4 should last about 8 weeks minimum for it to have reasonable proportion with primary wave 2. It is the proportion between corrective waves which give a wave count the right look. Primary wave 4 may last 13 or even 21 weeks if it is a triangle or combination.
If primary wave 4 reaches down to the lower edge of the Elliott channel, it may end about 2,320. This is very close to the lower range of intermediate wave (4); fourth waves often end within the price territory of the fourth wave of one lesser degree, or very close to it.
If price reaches the target at 2,500 and either the structure is incomplete or price keeps rising, then the next target would be the next Fibonacci ratio in the sequence between cycle waves I and V. At 2,926 cycle wave V would reach 1.618 the length of cycle wave I.
At the end of last week, Lowry’s analysis favours the idea that primary wave 4 has begun.
DAILY CHART
Click chart to enlarge.
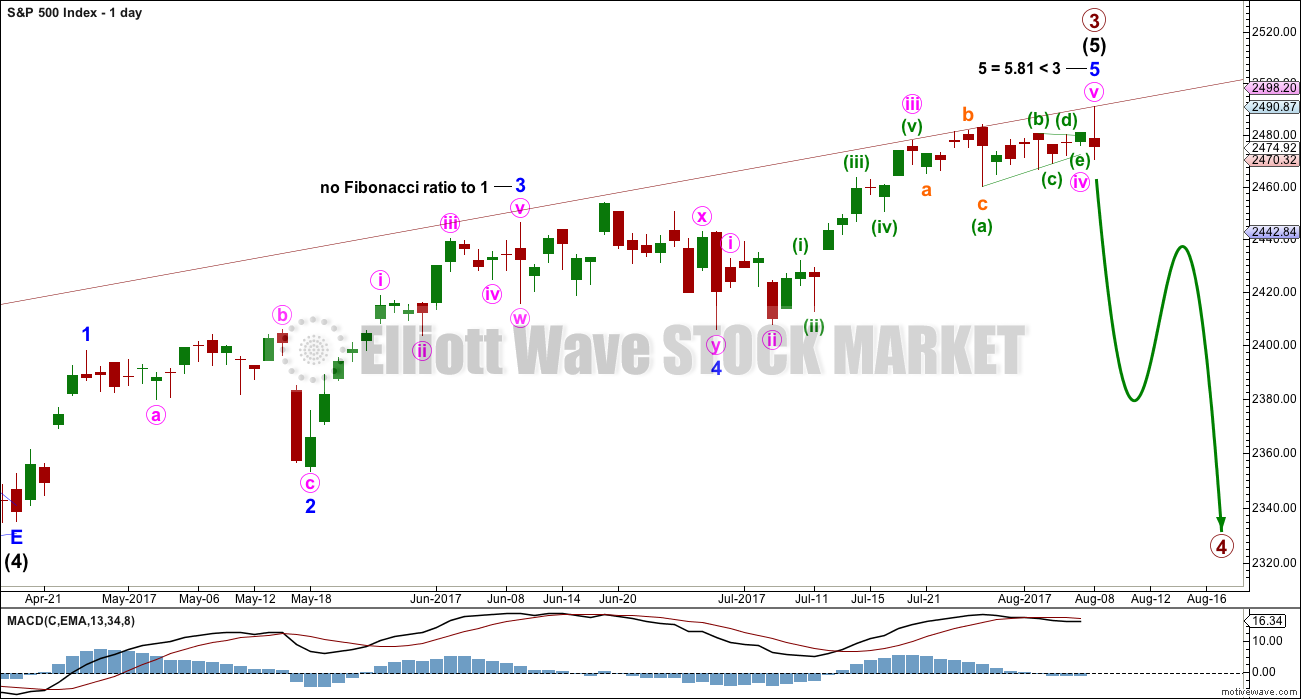
The daily chart shows only the structure of intermediate wave (5); this structure is an impulse.
There is perfect alternation between the deep expanded flat of minor wave 2 and the shallow double zigzag of minor wave 4.
There is now an adequate Fibonacci ratio between minor wave 5 and 1. Minor wave 3 exhibits strongest momentum and is the longest actionary wave, so this wave count fits with MACD.
HOURLY CHART

Click chart to enlarge.
Minute wave iv will fit as a regular barrier triangle. There is an adequate Fibonacci ratio between minute waves v and i.
Downwards movement at the end of today’s session has brought price below the start of minute wave v. This downwards movement cannot be a second wave correction within minute wave v, so minute wave v must be over.
This wave count still requires at least a new low below 2,459.93 before any confidence may be had in it.
TECHNICAL ANALYSIS
WEEKLY CHART
Click chart to enlarge. Chart courtesy of StockCharts.com.
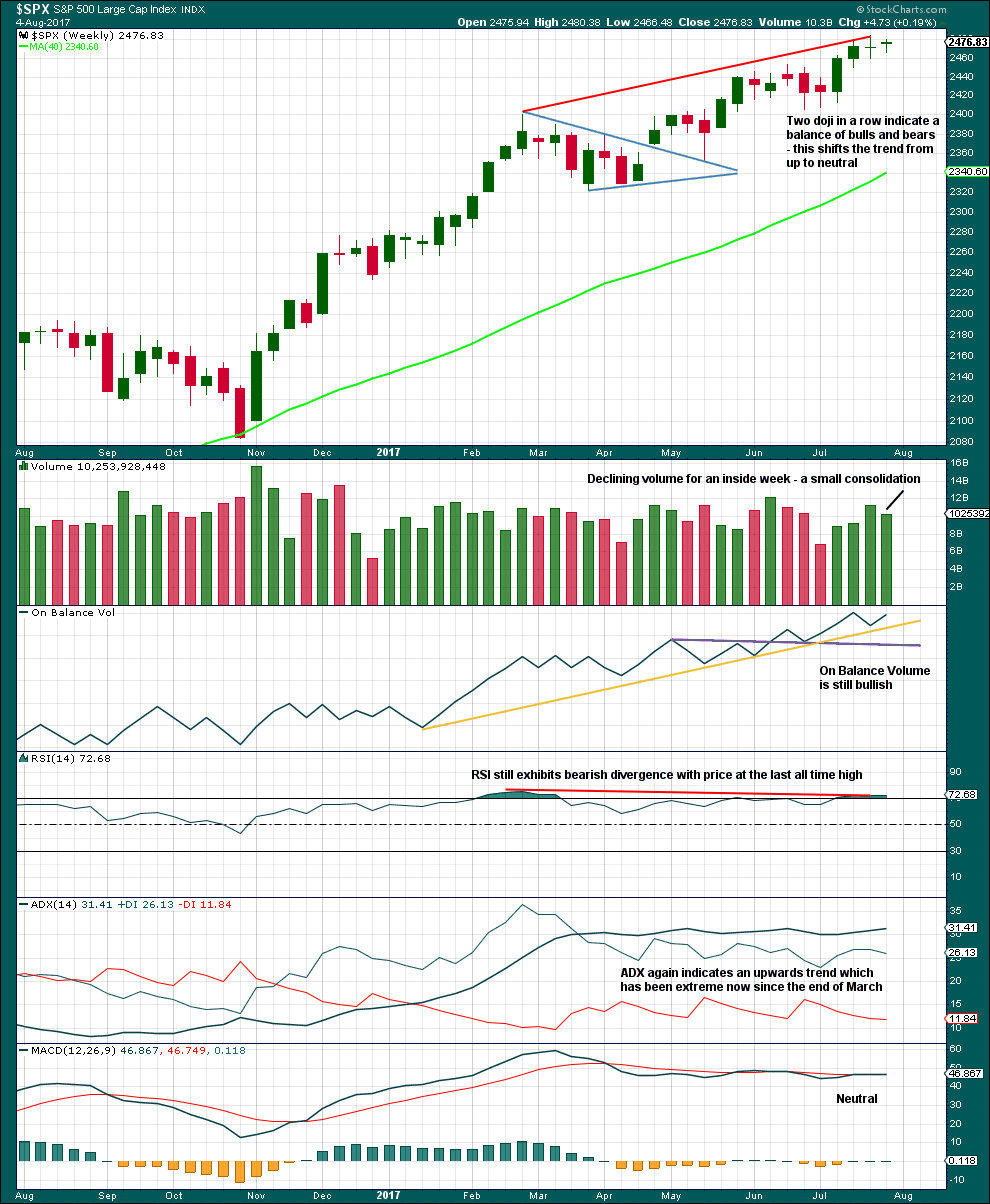
RSI, ADX and the two doji support the idea that primary wave 4 has begun.
DAILY CHART
Click chart to enlarge. Chart courtesy of StockCharts.com.
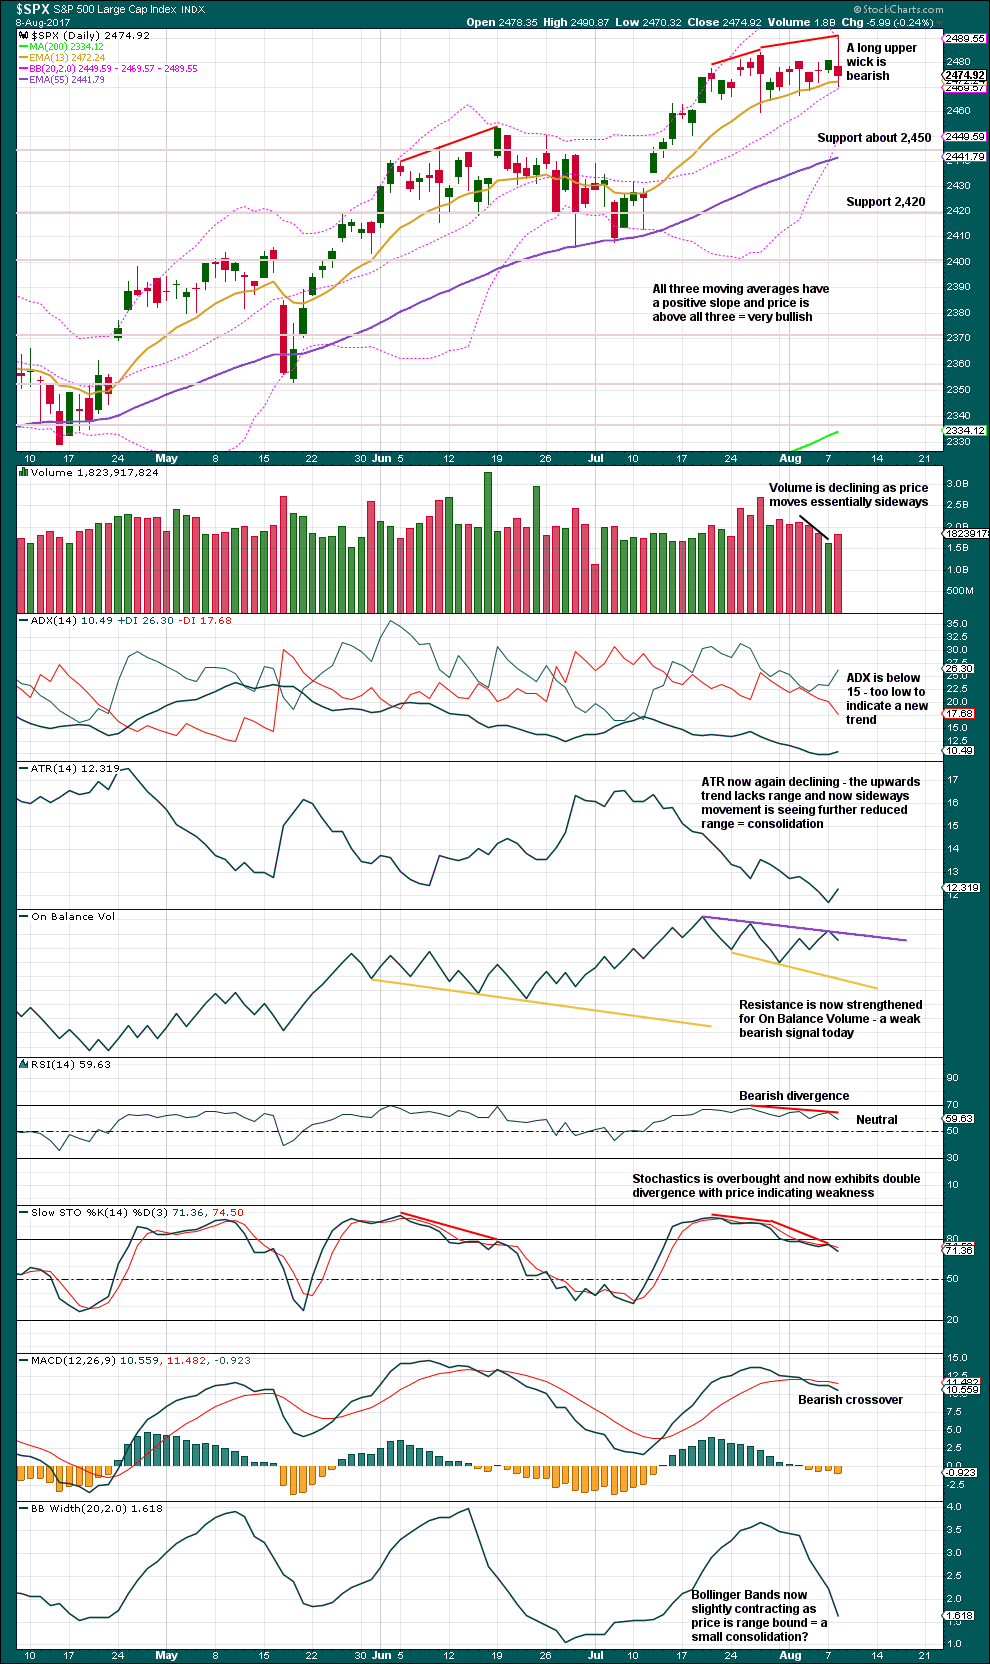
The upwards session for Tuesday has ruined what looked like a diamond top. This movement no longer fits into a classic pattern.
Price continues to find support about the short term Fibonacci 13 day moving average.
There is now divergence between price and RSI, and double divergence between price and Stochastics. This is bearish.
The long upper candlestick wick today is bearish. A slight support from volume for a balance of volume downwards today is bearish. MACD is bearish.
Overall, there is reasonable bearishness in this chart today.
VOLATILITY – INVERTED VIX CHART
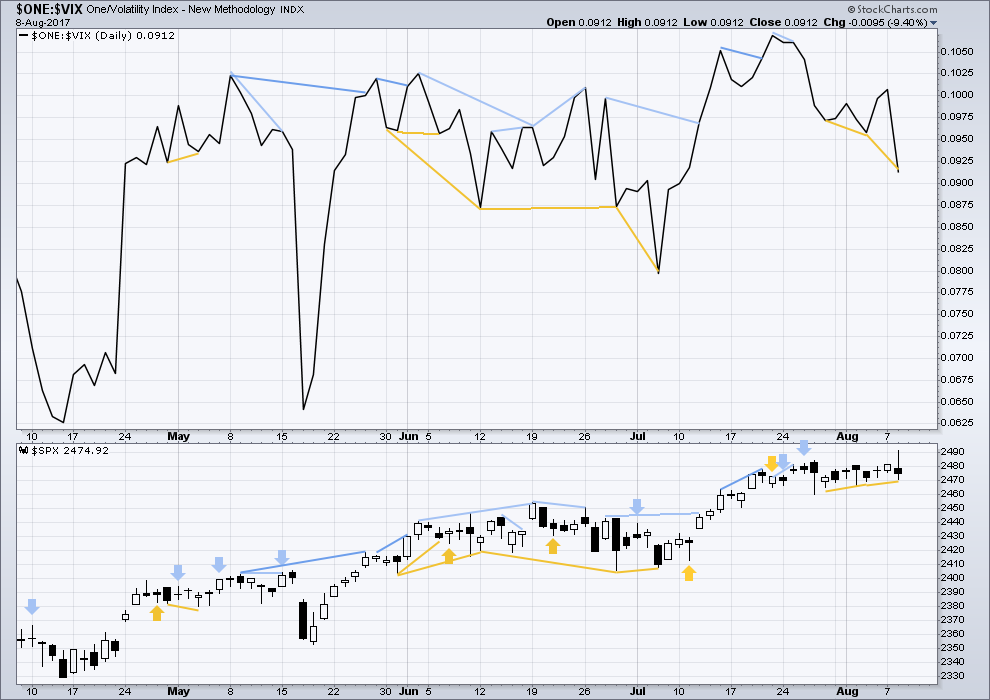
Click chart to enlarge. Chart courtesy of StockCharts.com.
Normally, volatility should decline as price moves higher and increase as price moves lower. This means that normally inverted VIX should move in the same direction as price.
Price has made a higher low and inverted VIX has made a lower low today. This divergence is interpreted as bullish and indicates weakness today within movement from price.
BREADTH – AD LINE
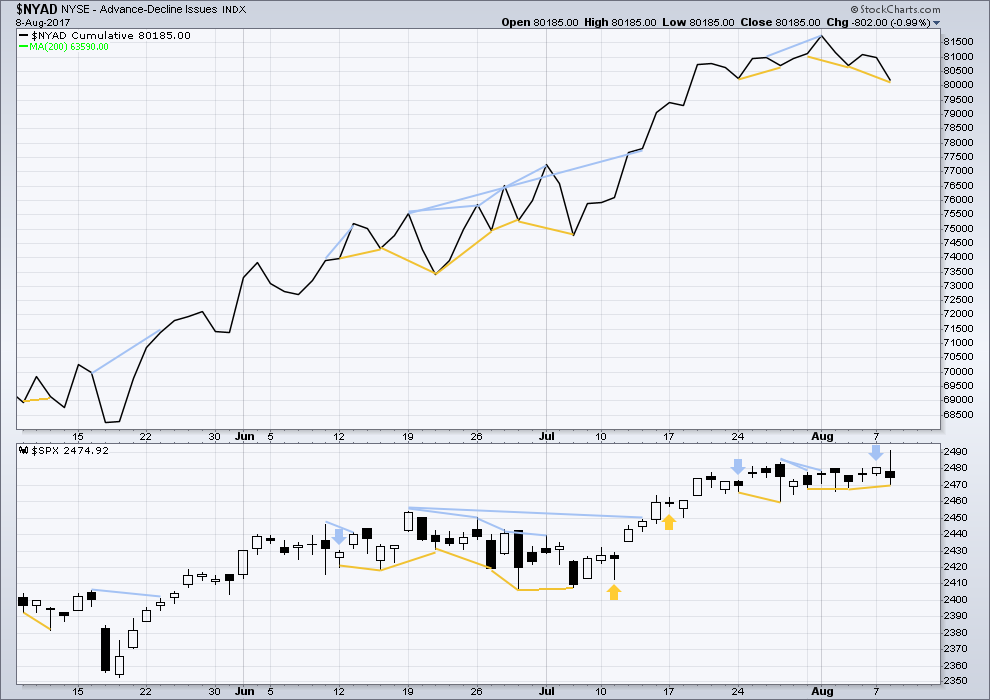
Click chart to enlarge. Chart courtesy of StockCharts.com.
With the last all time high for price, the AD line also made a new all time high. Up to the last high for price there was support from rising market breadth.
There is normally 4-6 months divergence between price and market breadth prior to a full fledged bear market. This has been so for all major bear markets within the last 90 odd years. With no divergence yet at this point, any decline in price should be expected to be a pullback within an ongoing bull market and not necessarily the start of a bear market.
Price has made a higher low and breadth has made a lower low today. This divergence is interpreted as bullish and indicates weakness today within downwards movement from price.
Lowry’s measures of internal market strength and health continue to show a healthy bull market. While the bull market overall remains healthy, there are signs at the end of this week of some short term weakness which may indicate a pullback to develop here. This supports the labelling of the Elliott wave count at the daily chart level.
DOW THEORY
The S&P500, DJIA, DJT and Nasdaq have all made new all time highs within the last month.
Modified Dow Theory (adding in technology as a barometer of our modern economy) sees all indices confirming the ongoing bull market.
The following lows need to be exceeded for Dow Theory to confirm the end of the bull market and a change to a bear market:
DJIA: 17,883.56.
DJT: 7,029.41.
S&P500: 2,083.79.
Nasdaq: 5,034.41.
Charts showing each prior major swing low used for Dow Theory are here.
Published @ 09:14 p.m. EST.
I’ve been watching the NYSE Advance / Decline line. For the late afternoon upwards push, the line was at the maximum 920 Advancing issues, 2070 Declining, which was at the close. Suggests a weak push up by very few stocks.
I agree. The problem is I have made that precise argument about a market advance only to watch it continue upwards a hundred points later! 🙂
At any rate I went ahead and shorted VIX above the upper B band today for a nice return so far. If we are in a second wave instead of some kind of ongoing zig zag (possible ED?!) I am going to have to cash in those VIX puts post haste.
I would not be at all surprised to see new highs. SVXY has already touched its lower BB and it does not stay in that area very long…
Finally, the SPX 2470 pivot was a deal-breaker for me. What pesky persistence!! 🙂
Have a great evening all!
Main hourly chart updated:
Minor 2 may be underway, expect it to be deep, close to 0.618 X minor 1 or deeper.
Daniel, this one’s for you.
It’s possible that minute iv may have just ended as a double flat correction.
The problem here is although that’s how it subdivides neatly, double flats are one of the rarest EW structures. I’ve only ever seen one before. Double combinations are common, but double flats are rare.
They’re even rarer than running flats.
But… it fits. So it should be considered. Now to calculate a target…
Thanks Lara for alternate possility.
I don’t think we are done yet folk. Every time I ignore what VIX is telling me I end up being wrong. We could see new highs…
Could this be a second wave?
VIX is telling a different story, unless yet another useful signal has gone kaput!
I was thinking same thing. 5 min trend channel from highs has been breached to upside and so far has retraced .382 of the decline.
I am switching to credit spreads only to limit upside risk and get a sense of how contracts are being bid. That sometimes give a clue of which direction market makers expect price to move.
DIA 220/222.5 bearish call credit spread for 1.05
SPY 248/254 bearish call for 0.65
We know that the VIX short sellers are going to keep hammering away. That long upper wick could be evidence of the assault underway. If that thing morphs into a nice fat candle, it is going to put a huge smile on my face….
Looking at the SPX chart we have not had a decline last more than a day or two since May. Absolutely amazing! The market simply refuses to correct.
It is starting to look like it could be a fourth wave underway.
If so, we get a new low sometime today and a sharp second wave up. I think it prudent to wait and see if that is what develops.
I am out of all short trades. That long upper wick on VIX is ominous for the immediate bearish case. I’m stumped.
So is the move down from the recent all-time high to this morning’s low a 5 or a 3?
Peter it looks to me like we need another low to make it a five. Hard for me to be certain looking at the 15 min chart.
It will fit well as a five. But it will also fit as a three. It’s ambiguous.
I cut my positions literally in half on the move down this morning after a number of them hit profit targets. I will wait for the confirmation point of the analysis below 2460 to re-enter short. Never underestimate the banksters!
Not too excited about VIX early move above B bands. SPX 2470 remains my line in the sand and if they manage to close price above it I think it means they are not done.
Lately moves by VIX above upper B band have been short -lived and signaled an end to the down-trend. That would not be remotely possible with a primary degree correction so right now I am a bit puzzled. VIX B bands simply have to confirm a large degree decline underway and so far they are just not doing that and I don’t quite get it. 🙁
The other possibility is that this one is very slow getting started, which in turn would mean it has quite a long way to go to its climax…..
Any thoughts on any bullish hourly wave counts which could see the trend continuing upwards?
One thought with some imagination may be an ending expanding diagonal if we get one more move up above 2491 to explain all this overlapping movement. I get nervous when there are no alternatives to the downside. I am positioned for more downside and hope 2459 gets taken out promptly but want to be considering options in case market moves back up.
Expanded flat for [iv] from the 2459.93 low to today’s high for (b) of [iv] as imo the move up looks like a choppy 3 wave move, not a 5.
Then down to not much below 2459.93 for (c) of [iv] then up to finish P3.
Also provides good alternation to zig zag [ii]
Thanks for your thoughts.
Interesting. I don’t like the fact that the VIX B bands did not expand today. Ahead of a major trend change they should start to open up to accommodate upwards price movement in VIX and price hitting the upper B band today was indeed a cautionary note. Maybe tomorrow.
There would be significant discrepancy however between length of proposed 4th wave expanded flat and zig zag for 2.
For the first in in quite some time, futures offering a road map of sorts to where we may be headed tomorrow, an unless they pull off some election night magic, it looks like it is down….I was starting to get a bit concerned about my fat long volatility positions but they all popped nicely in the green today and look to do some more popping tomorrow. Glad I gave em room to run! 🙂
Anybody watching Priceline?
Quite a nearly 7% swoon after hours!
Five weeks of green candles gone in the flash of one day.