
Another small inside day now gives the current consolidation a more typical look. A pennant may be forming.
Summary: Assume the trend remains up while price remains above 2,459.93. The Elliott wave target is now at 2,494, and a classic technical analysis target is at 2,554. Look out now for an upwards breakout, maybe tomorrow on release of Non Farm Payroll data. This expectation has support from classic technical analysis today.
A new low now below 2,459.93 would add some confidence to the view that primary wave 4 has finally arrived. Full confidence may be had if price makes a new low below 2,405.70. The target would be about 2,320.
New updates to this analysis are in bold.
Last monthly and weekly charts are here. Last historic analysis video is here.
MAIN ELLIOTT WAVE COUNT
WEEKLY CHART
Click chart to enlarge.
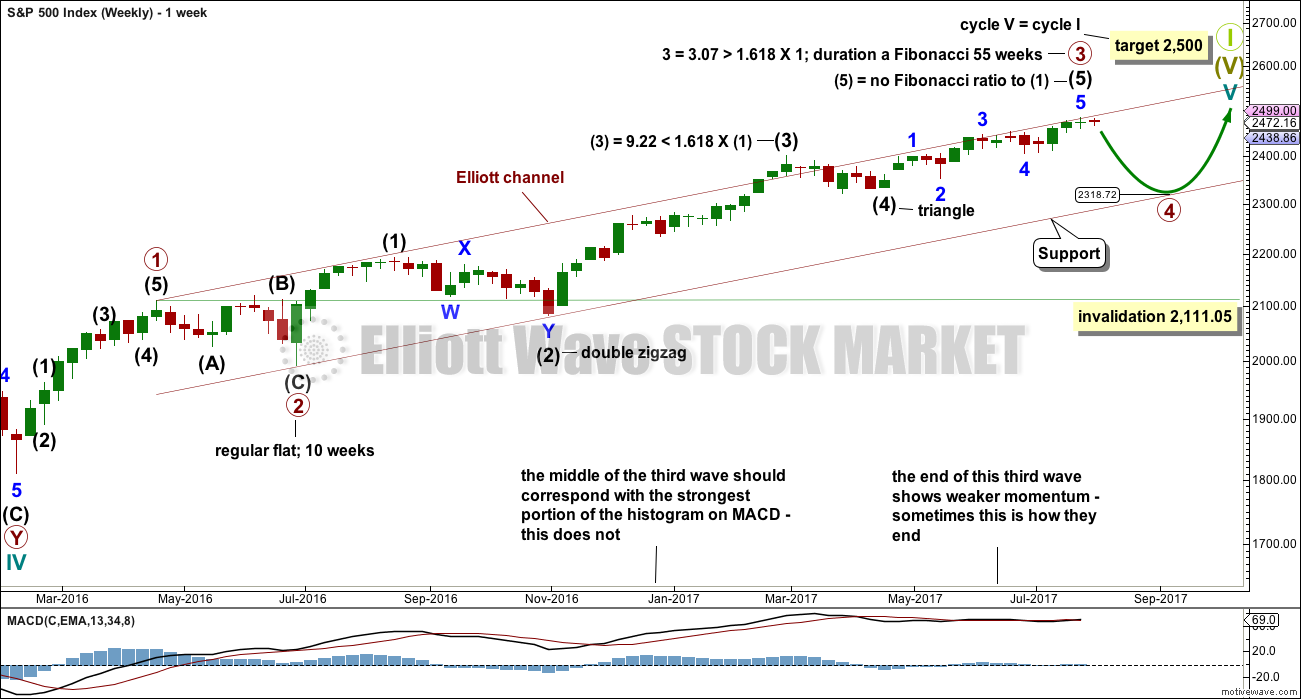
It is possible that primary wave 3 is complete. However, some confidence may be had in this view only with a new low below 2,459.93 now. Further and substantial confidence may be had if price makes a new low below 2,405.70. Fibonacci ratios are calculated at primary and intermediate degree. If primary wave 3 is complete, then it exhibits the most common Fibonacci ratio to primary wave 1. It also perfectly exhibits a Fibonacci 55 weeks duration.
Primary wave 4 may not move into primary wave 1 price territory below 2,111.05.
Primary wave 4 should last about 8 weeks minimum for it to have reasonable proportion with primary wave 2. It is the proportion between corrective waves which give a wave count the right look. Primary wave 4 may last 13 or even 21 weeks if it is a triangle or combination.
If primary wave 4 reaches down to the lower edge of the Elliott channel, it may end about 2,320. This is very close to the lower range of intermediate wave (4); fourth waves often end within the price territory of the fourth wave of one lesser degree, or very close to it.
If price reaches the target at 2,500 and either the structure is incomplete or price keeps rising, then the next target would be the next Fibonacci ratio in the sequence between cycle waves I and V. At 2,926 cycle wave V would reach 1.618 the length of cycle wave I.
DAILY CHART
Click chart to enlarge.
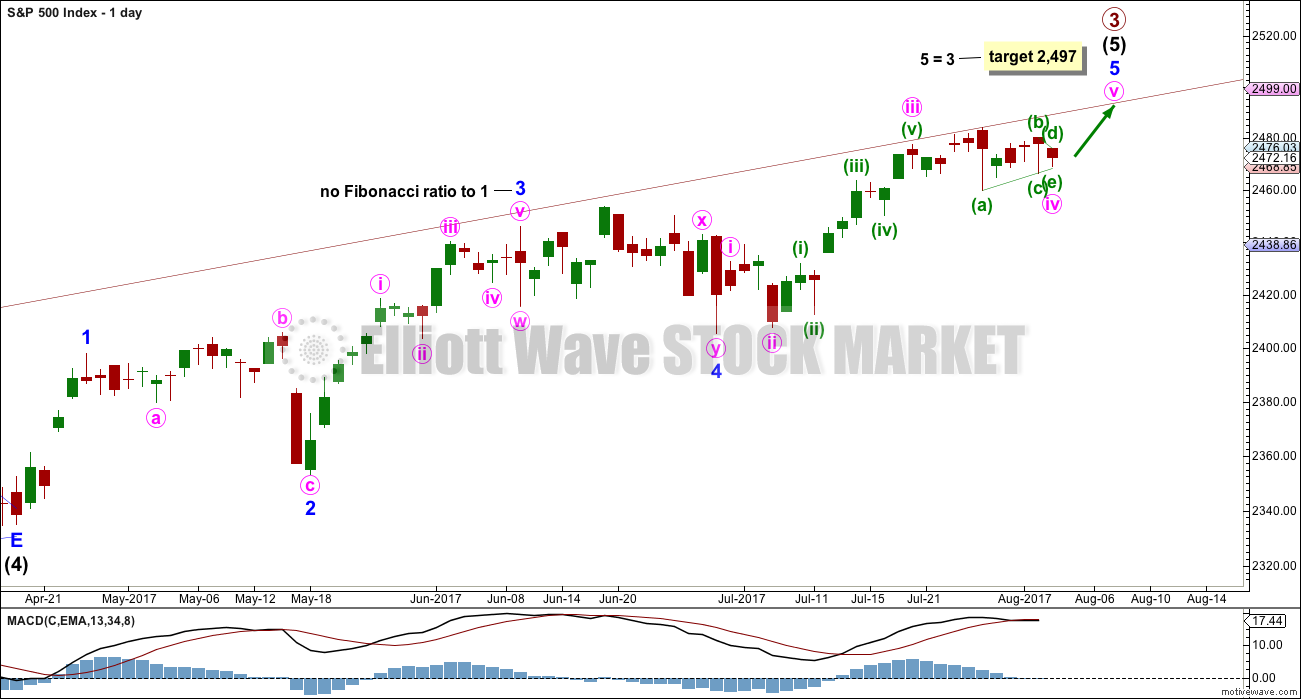
The daily chart shows only the structure of intermediate wave (5); this structure is an impulse.
There is perfect alternation between the deep expanded flat of minor wave 2 and the shallow double zigzag of minor wave 4.
There are no adequate Fibonacci ratios between minor waves 1 and 3. Minor wave 3 exhibits strongest momentum and is the longest actionary wave, so this wave count fits with MACD.
It must be accepted that it is entirely possible that primary wave 3 may not be over and may continue higher while price remains above 2,405.70.
The hourly wave counts today are swapped over and renamed “main” and “alternate” to reflect my judgement on their probability. It now looks like there may be an upwards breakout tomorrow from a small triangle or pennant pattern to a new all time high.
MAIN HOURLY CHART
Click chart to enlarge.
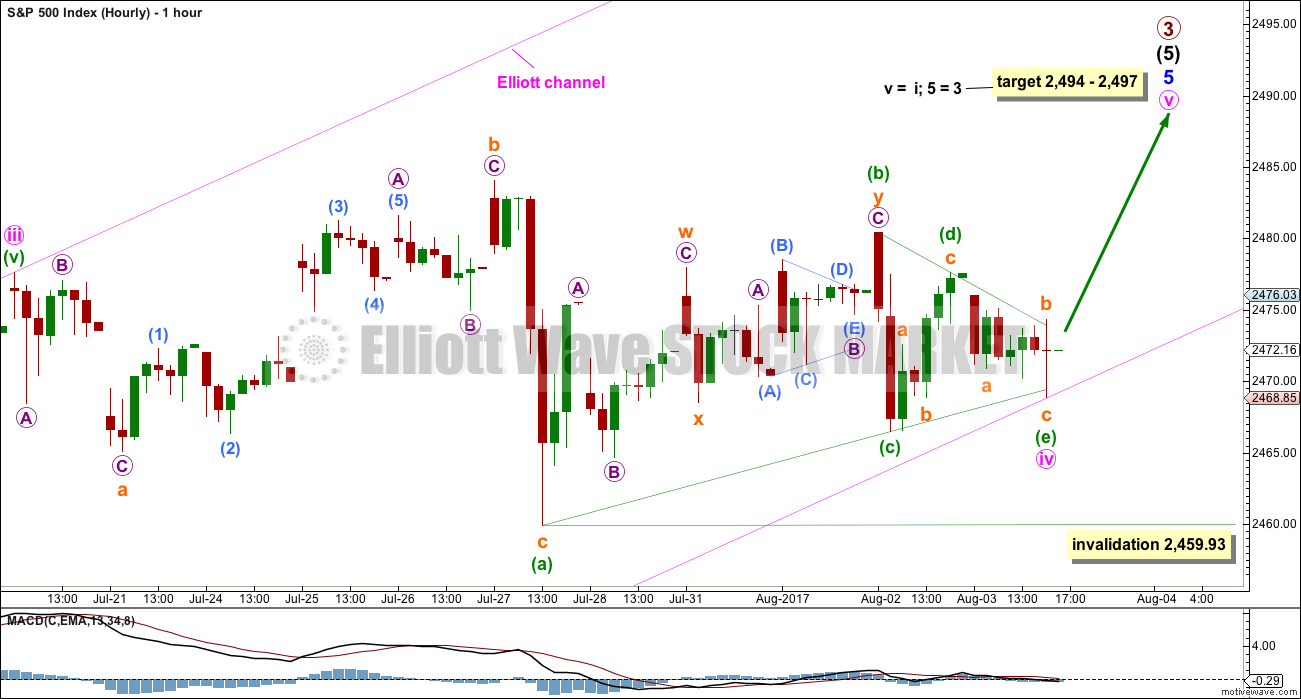
It is still possible that minor wave 5 is incomplete.
The problem of a lack of alternation is resolved if minute wave iv is a triangle (thank you Kevin for pointing out this possibility).
The triangle would be a regular contracting triangle: minuette wave (b) ends below the start of minuette wave (a).
Four of the five sub-waves of a triangle must be zigzags or multiple zigzags. One sub-wave may be a different A-B-C structure. Here, minuette wave (a) may have been an expanded flat correction.
One triangle sub-wave may be a more complicated multiple. This may be minuette wave (b).
All remaining sub-waves must be single zigzags, as these are.
Minuette wave (e) ends with a very slight overshoot of the A-C trend line.
This Elliott wave triangle is analogous to the small pennant pattern noted today on the classic technical analysis chart. For both the breakout would be expected to be upwards.
The target is recalculated using the most common Fibonacci ratio for minute wave v.
Within the triangle, if minuette wave (c) continues further, then it may not move beyond the end of minuette wave (a) below 2,459.93.
ALTERNATE HOURLY CHART
Click chart to enlarge.
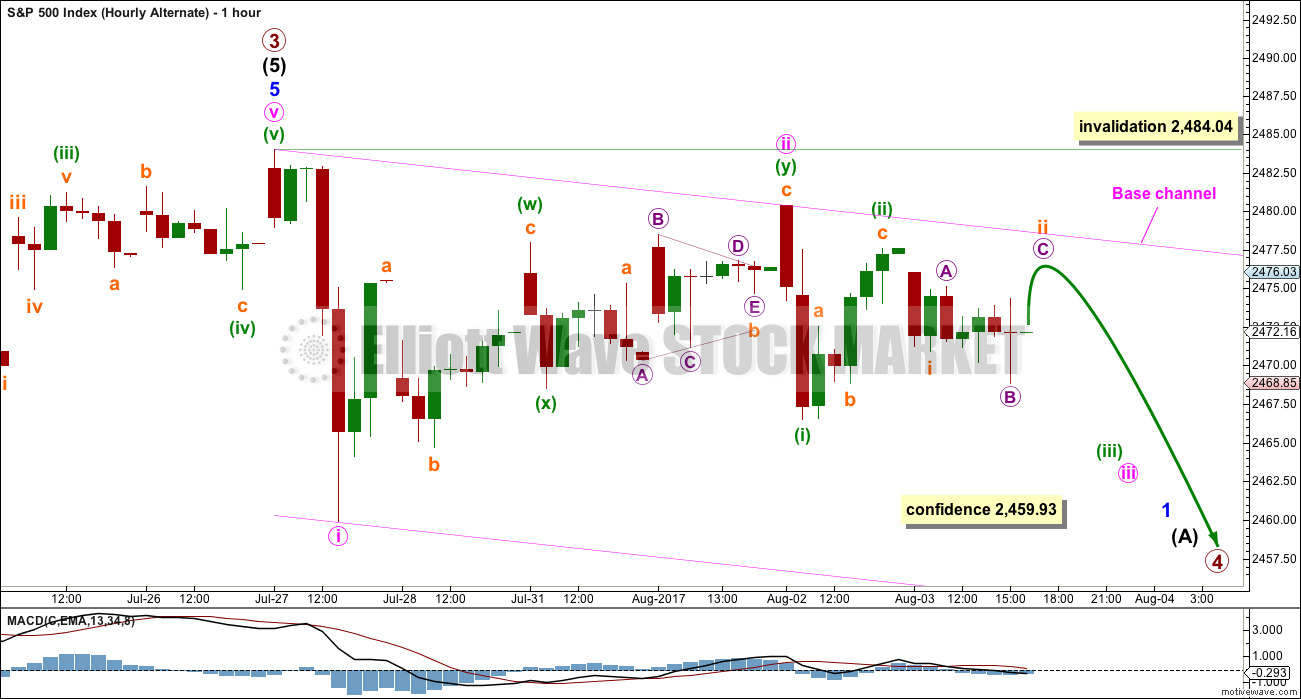
Minor wave 5 may now be a complete five wave impulse.
A new base channel is added today about minute waves i and ii. Lower degree second wave corrections should find resistance at the upper edge of this base channel.
There may now be three overlapping first and second wave corrections to begin primary wave 4 down. When third waves extend, this is sometimes how they begin. But we have been here before many times and the third wave has not eventuated. Assume the trend remains the same until proven otherwise. This wave count requires a new low below 2,459.93 for any confidence.
If it continues further, then minute wave ii may not move beyond the start of minute wave i above 2,484.04.
TECHNICAL ANALYSIS
WEEKLY CHART
Click chart to enlarge. Chart courtesy of StockCharts.com.
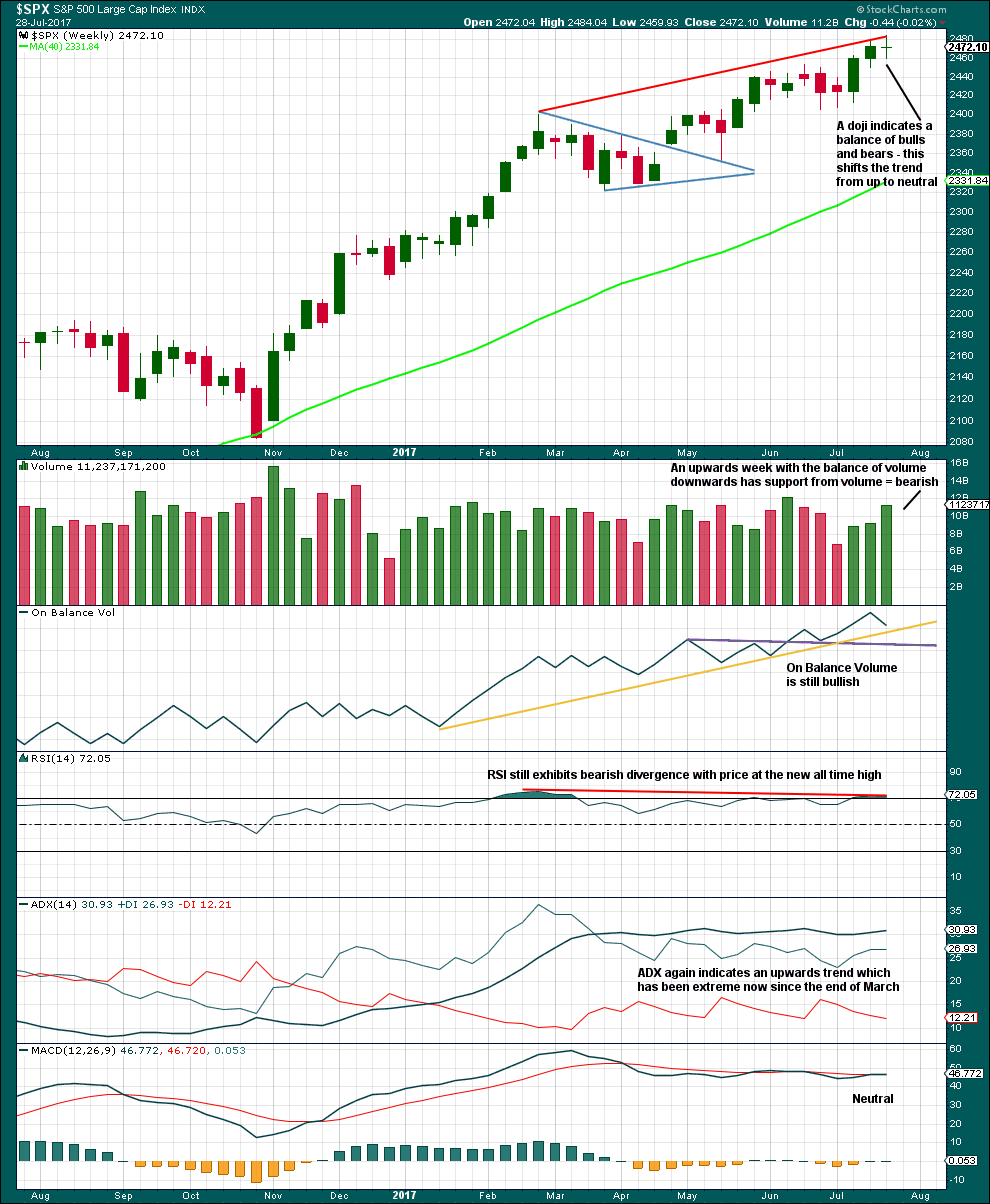
There is a little short term bearishness last week to support the labelling of the daily Elliott wave count: some support from volume for downwards movement, divergence still between price and RSI, and a doji candlestick.
With still extreme ADX, the conditions look right now for a primary degree correction here.
DAILY CHART
Click chart to enlarge. Chart courtesy of StockCharts.com.
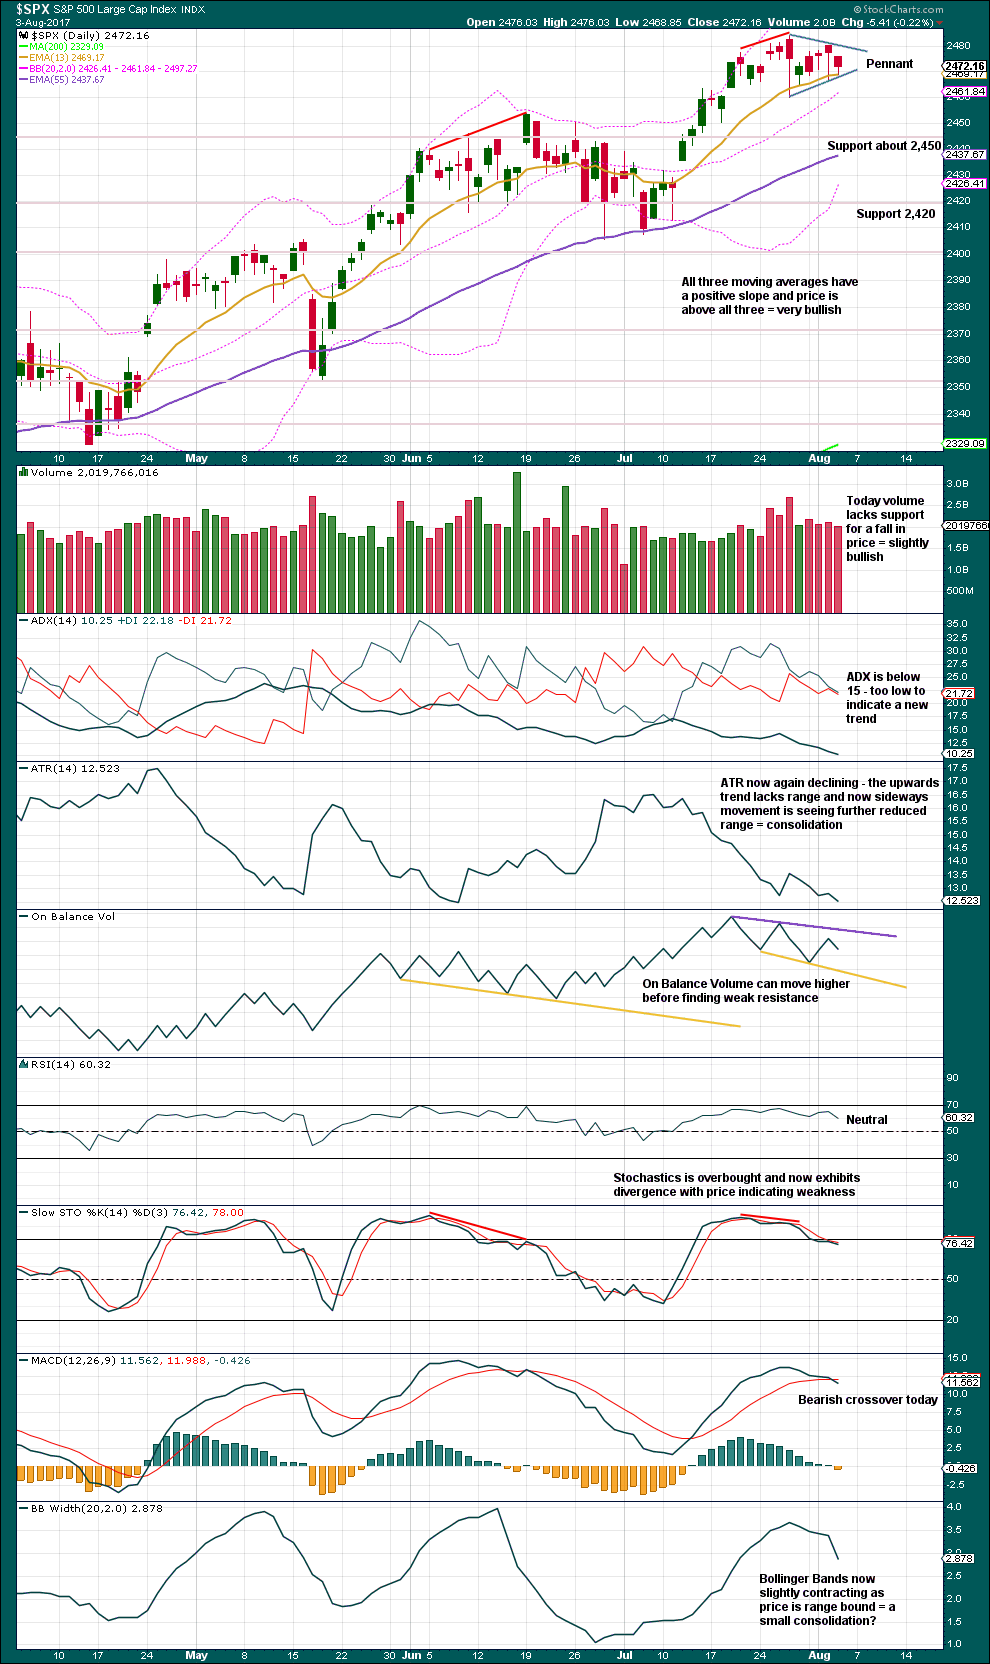
A small pennant may be forming. Using the measured rule a target of 2,554 would be calculated; the breakout would be expected to be upwards. Pennants are reliable continuation patterns. This one is supported by light volume as it nears its end.
Price continues to find support at the short term Fibonacci 13 day moving average. Long lower wicks are still bullish.
ADX, ATR and Bollinger Bands all agree that price is likely consolidating.
The only disagreement today comes from a bearish crossover from MACD.
This chart today looks more bullish than it has for a few days. An upwards breakout looks likely soon, maybe with the release of Non Farm Payroll data tomorrow.
VOLATILITY – INVERTED VIX CHART
Click chart to enlarge. Chart courtesy of StockCharts.com.
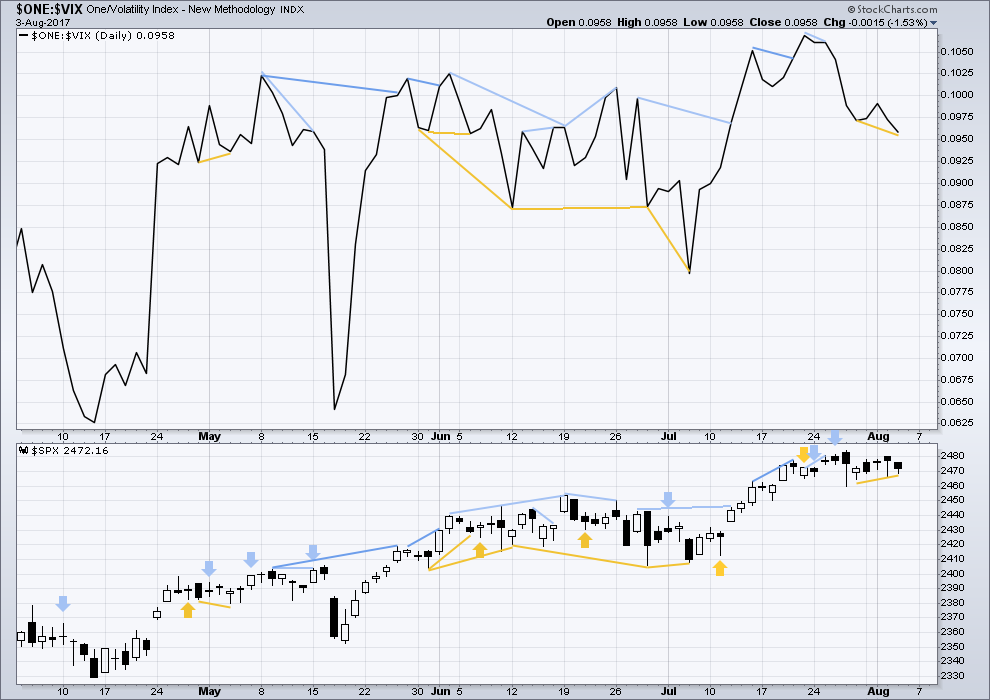
Normally, volatility should decline as price moves higher and increase as price moves lower. This means that normally inverted VIX should move in the same direction as price.
Inverted VIX today has made a new low below the prior low four sessions ago, but price has not. This divergence is judged to be bullish. This supports the main hourly Elliott wave count.
BREADTH – AD LINE
Click chart to enlarge. Chart courtesy of StockCharts.com.
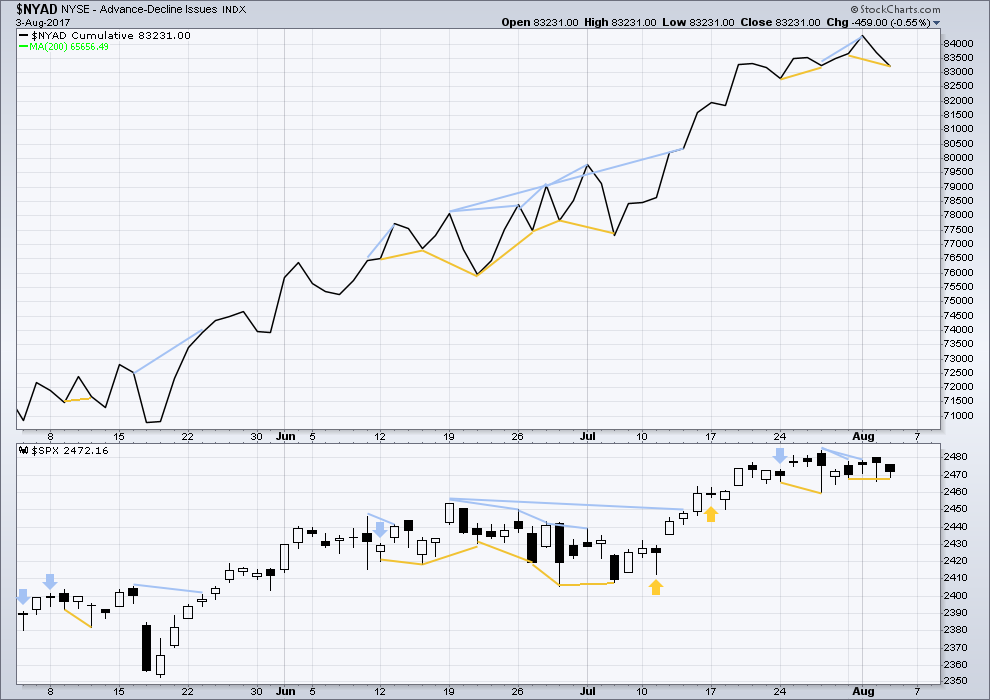
With the last all time high for price, the AD line also made a new all time high. Up to the last high for price there was support from rising market breadth.
There is normally 4-6 months divergence between price and market breadth prior to a full fledged bear market. This has been so for all major bear markets within the last 90 odd years. With no divergence yet at this point, any decline in price should be expected to be a pullback within an ongoing bull market and not necessarily the start of a bear market.
There is slight and weak bullish divergence today between price and market breadth. Breadth has made a new low below the prior low three sessions ago, but price has not made a corresponding new low. This supports the main hourly Elliott wave count.
Lowry’s measures of internal market strength and health continue to show a healthy bull market. While the bull market overall remains healthy, there are signs at the end of this week of some short term weakness which may indicate a pullback to develop here. This supports the labelling of the Elliott wave count at the daily chart level.
DOW THEORY
The S&P500, DJIA, DJT and Nasdaq have all made new all time highs.
Modified Dow Theory (adding in technology as a barometer of our modern economy) sees all indices confirming the ongoing bull market.
The following lows need to be exceeded for Dow Theory to confirm the end of the bull market and a change to a bear market:
DJIA: 17,883.56.
DJT: 7,029.41.
S&P500: 2,083.79.
Nasdaq: 5,034.41.
Charts showing each prior major swing low used for Dow Theory are here.
Published @ 10:50 p.m. EST.
main hourly chart updated:
no breakout today on NFP. it didn’t move this market at all.
MACD still sitting right on zero sure does look like a triangle
I’m long on this morning’s (8/4) action but I’m skeptical of much of a breakout. I think a very short 5 is likely. When I look at daily SP500 action with bollinger and keltner bands, I see action for many months where a touch on the upper band then pullback to the center band ALWAYS results in a fall to or very close to the lower band. Over and over. But if this market breaks UP here…not THIS time. Which causes me to be very, very suspicious, that it will be seen in the end as a “final head fake” before the intermediate 4 kicks in. All this action is on light volume too, including the entire July up move. I’m looking forward to Sept/Oct when we should see some serious downside action.
New highs and new lows were about 85 on the Nasdaq yesterday, s&p around 135 NH to 55 NL s. Let see what today brings in this regard as there are around 2800 stocks on the NYSE. The Hindenburg omen requires a 2.2 percent number in new hi’s and new lows. This would be around 62 stocks hitting both of those levels on the NYSE. It also requires a few other factors but this would give us a heads up the market is getting close to roll over, imo.
I am skeptical of the new count. It would not shock me to see it play out and get new ATHs tomorrow, but it seems to me that momentum has slowed down more broadly than in previous consolidations of this P3. International markets, DJT, RUT are all rather weak. We just emerged from 10 straight days of VIX under 10. Previous breakouts heralded collapses in volatility, so are we to expect another two weeks of record lows for VIX? The Nasdaq has carried this market for most of the year but the June swoon seems to have people spooked. This whole rally started with the promise of tax reform and infrastructure stimulus, neither or which seem likely to materialize soon. The economic and earnings numbers are good for the most part though. There is no indication earnings will subside, and with a dovish Fed the big money doesn’t seem to think this business cycle is anywhere near its end. September will be a key month it seems.
Let’s break doc’s domination.