
A short term pullback was expected to begin on Friday. A downwards day completed with a lower low and a lower high, exactly as expected.
Summary: The trend is up. Trading with the trend is the safest approach for your account. Use corrections as an opportunity to join the trend.
Only the most experienced traders should attempt to trade the small whipsaws within corrections; if doing so, reduce risk to less than 3% of equity. Long positions may risk more, up to 5% of equity on any one trade.
Friday’s low was another opportunity to join the trend. The short term target is now at 2,490. The longer term target still at 2,500, but a higher possibility is now 2,926.
In the short term, next week may see the small correction over, or less likely price may move sideways for another day to three before an upwards breakout.
New updates to this analysis are in bold.
Last monthly and weekly charts are here. Last historic analysis video is here.
MAIN ELLIOTT WAVE COUNT
WEEKLY CHART
Click chart to enlarge.
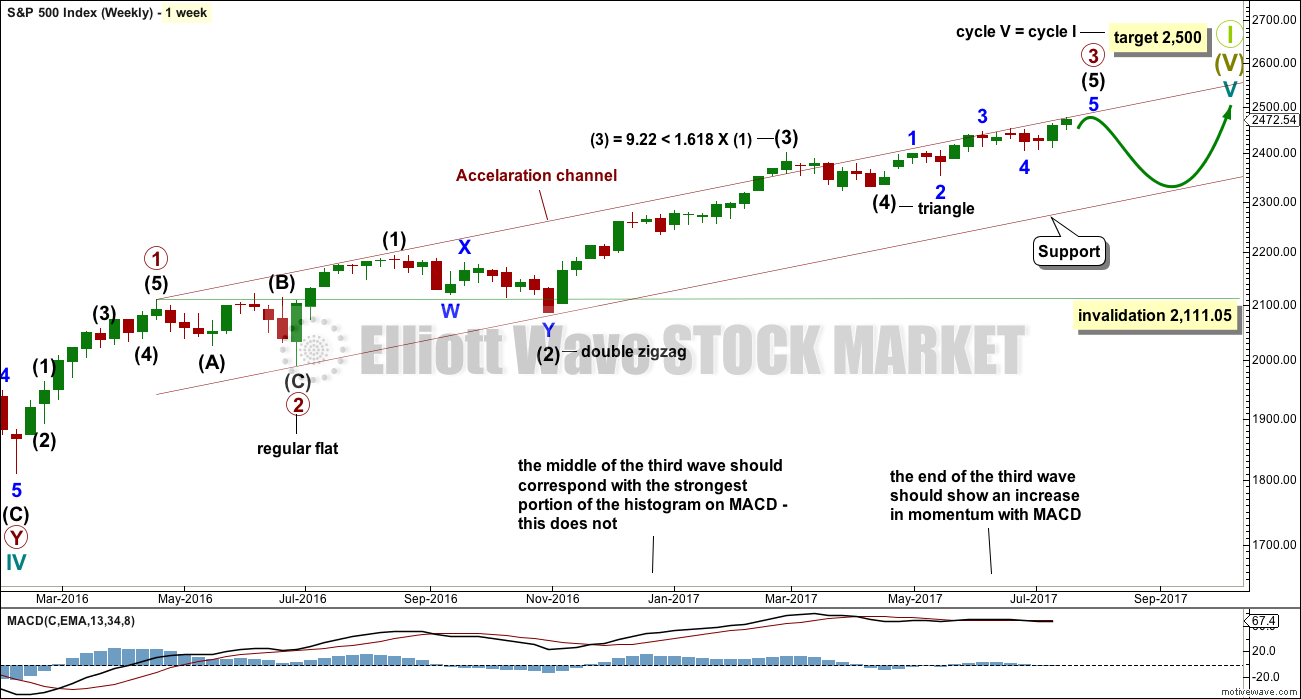
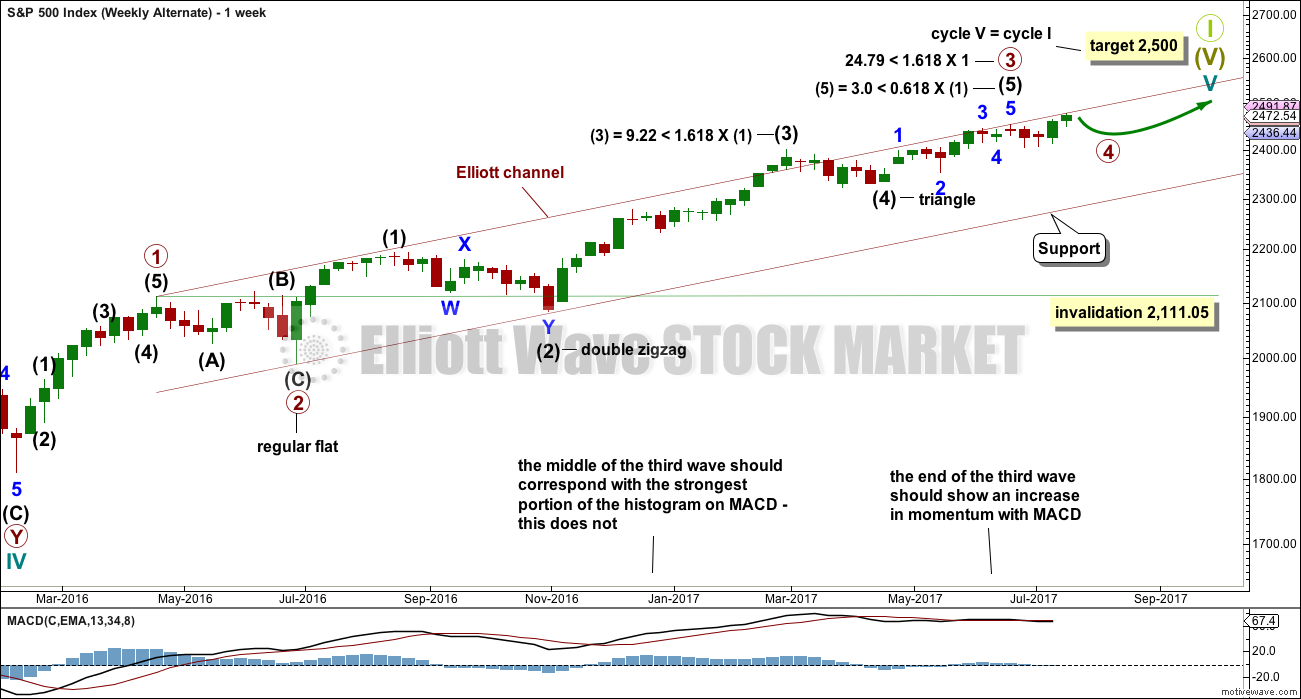
This wave count is identical to the alternate wave count up to the high labelled minor wave 3 within intermediate wave (5) within primary wave 3.
This wave count sees primary wave 3 as incomplete, but close to completion.
Within primary wave 3 impulse, the final wave of intermediate wave (5) is seen as incomplete. Intermediate wave (5) is subdividing as an impulse.
When intermediate wave (5) is complete, then primary wave 3 would be complete. Primary wave 4 may not move into primary wave 1 price territory below 2,111.05.
If price reaches the target at 2,500 and either the structure is incomplete or price keeps rising, then the next target would be the next Fibonacci ratio in the sequence between cycle waves I and V. At 2,926 cycle wave V would reach 1.618 the length of cycle wave I.
DAILY CHART
Click chart to enlarge.
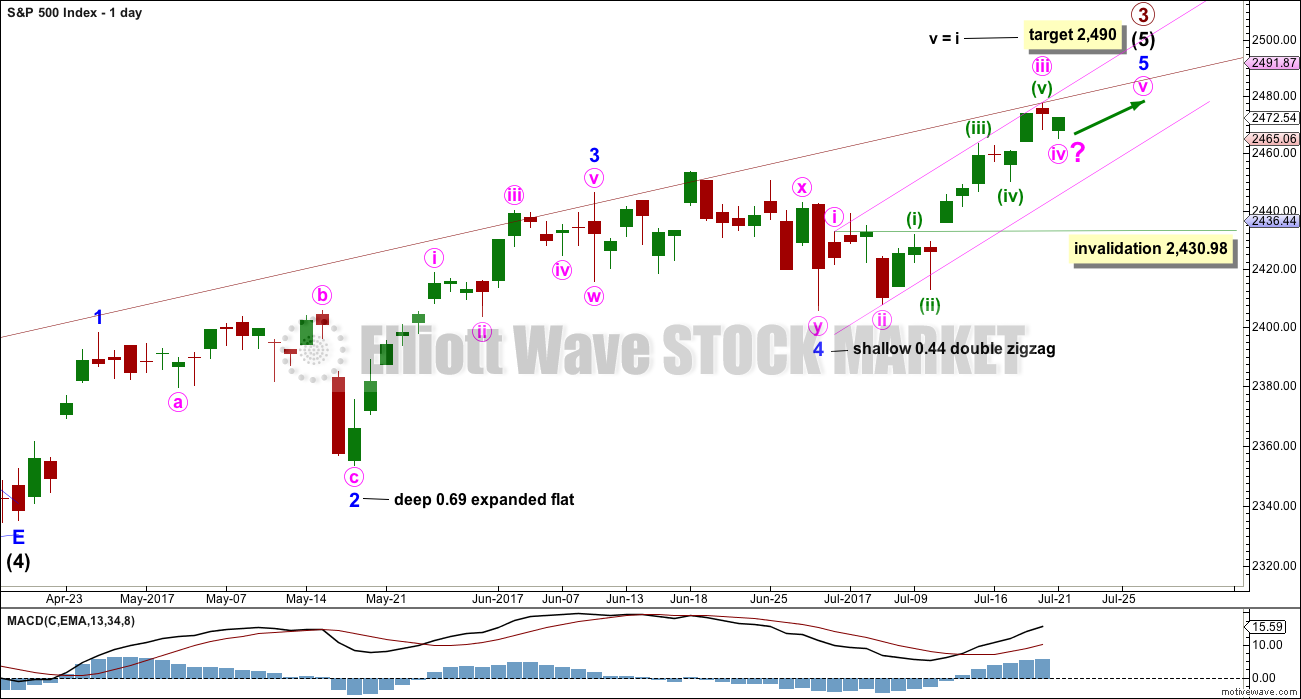
The daily chart shows only the structure of intermediate wave (5); this structure is an impulse.
Within intermediate wave (5), minor waves 1 through to 4 are now complete. The final fifth wave of minor wave 5 is underway. Within minor wave 5, minute wave iv may not move into minute wave i price territory below 2,430.98.
Minor wave 5 is extending. Within minor wave 5, minute waves ii and iv now both show up clearly at the daily chart level. This portion of the wave count has now the right look. It would still look right if minute wave iv continued sideways for another day to three, taking up a bit more time.
Within minute wave iii, the subdivisions of minuette waves (ii) and (iv) now look clear on the daily chart.
There is perfect alternation between the deep expanded flat of minor wave 2 and the shallow double zigzag of minor wave 4.
FIRST HOURLY CHART
Click chart to enlarge.
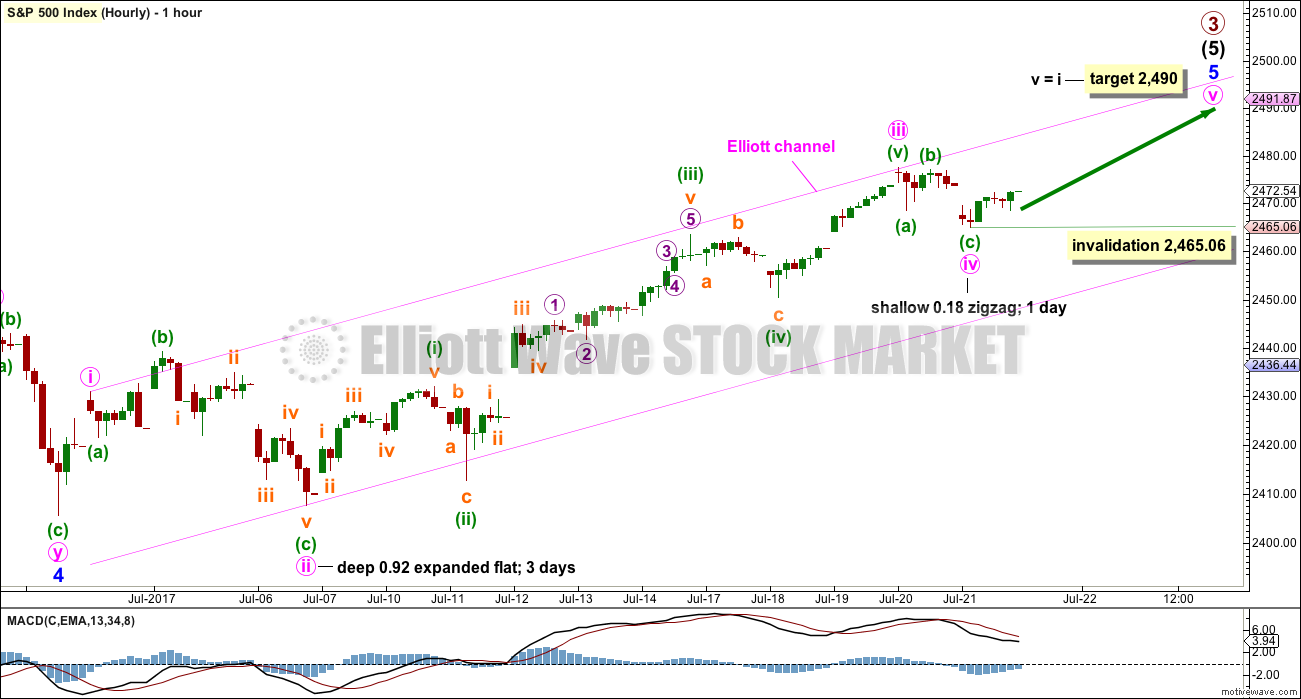
Minor wave 5 may be subdividing as an impulse so far. The middle of the third wave has the strongest upwards momentum. This wave count fits so far with MACD.
If minute wave iv is over as a quick shallow zigzag at Friday’s low, then there is perfect alternation between minute waves ii and iv. Zigzags are quicker structures than flats, so the disproportion between them is entirely acceptable.
If minute wave v has begun, then within it no second wave correction may move beyond its start below 2,465.06.
The old target for primary wave 3 now looks to be too low. A new target is calculated at minute degree, now that minute wave iv may be over.
This new target at 2,490 may still work with the higher final target at 2,500, but that is now beginning to look less likely. When primary waves 3 and 4 may be over, then the final target for primary wave 5 may be calculated at two degrees with more confidence.
SECOND HOURLY CHART
Click chart to enlarge.
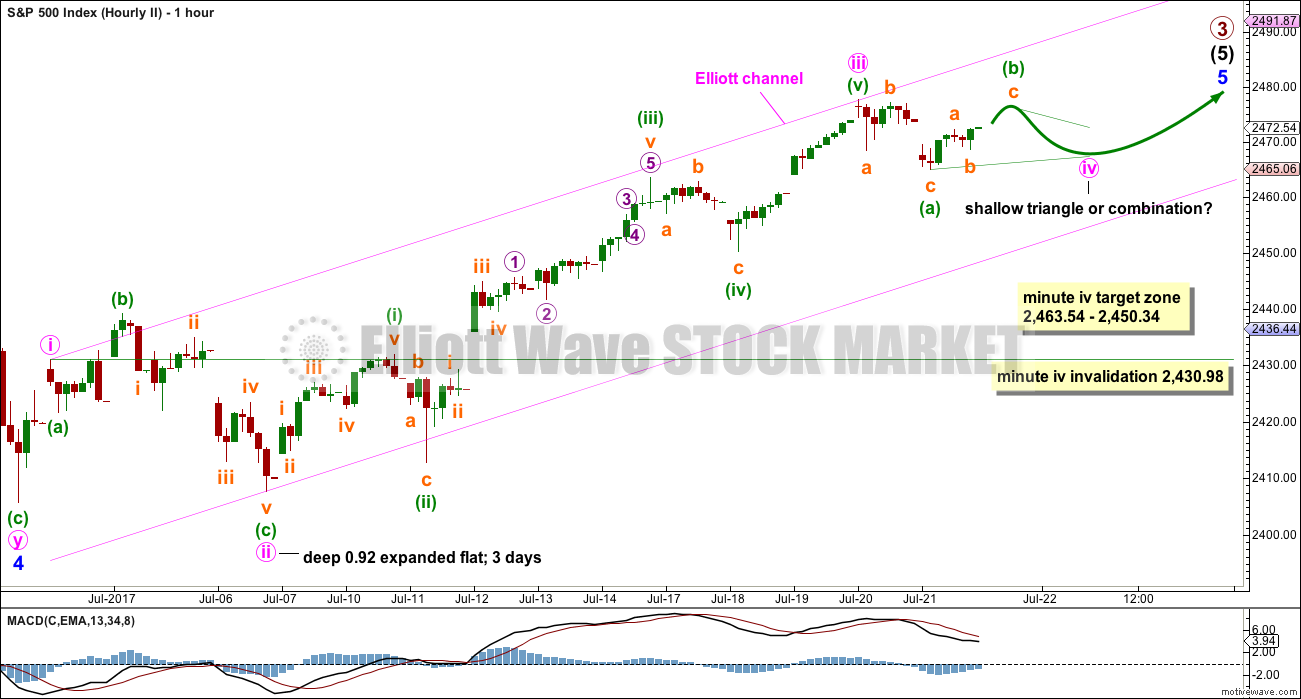
It is also possible that minute wave iv may not be over and may continue further sideways for one to three days next week.
Minute wave ii was an expanded flat correction, so the least likely structure for minute wave iv would also be an expanded flat as that would offer no alternation in structure. Minute wave iv may be a triangle and still have good alternation, or a combination and still have reasonable alternation.
Both triangles and combinations are sideways movements. Lower degree Elliott wave triangles equate to pennant patterns and combinations equate to flag patterns. Both are reliable continuation patterns and should be used as opportunities to join a larger trend.
If it is a combination, then it is possible that minute wave iv may still reach down to end within the target range, but now at this stage that range is looking a little too low.
Minute wave iv may not move into minute wave i price territory below 2,430.98.
Minute wave iv may end within the price territory of the fourth wave of one lesser degree. Minuette wave (iv) has its price territory from 2,463.54 to 2,450.34. The lower edge of this range is also a strong area of support. There may also be strong support at the last breakaway gap at 2,460.92.
ALTERNATE ELLIOTT WAVE COUNT
WEEKLY CHART
Click chart to enlarge.
Primary wave 4 may now be underway.
Primary wave 2 was a regular flat correction that lasted 10 weeks. Given the guideline of alternation, primary wave 4 may most likely be a single or multiple zigzag or a triangle and may last about a Fibonacci eight or thirteen weeks, so that the wave count has good proportion and the right look. So far it has lasted three weeks. This is far too brief to be considered complete or even close to complete.
Primary wave 4 may end within the price territory of the fourth wave of one lesser degree. Intermediate wave (4) has its range from 2,400.98 to 2,322.35.
Primary wave 4 may not move into primary wave 1 price territory below 2,111.05.
DAILY CHART
Click chart to enlarge.
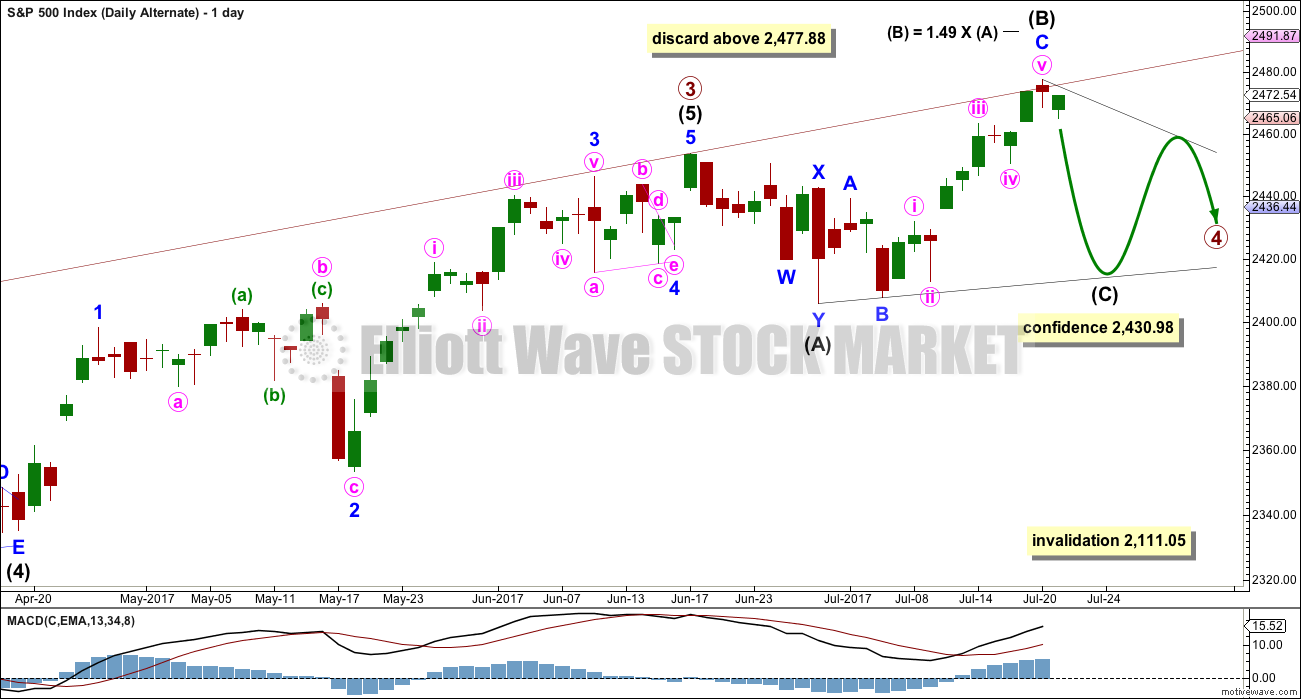
A new all time high means a double zigzag for primary wave 4 is still possible but much less likely. A double combination would be more likely but would not offer very good alternation with the flat correction of primary wave 2.
What would still offer good alternation would be a running contracting triangle.
Within the triangle, intermediate wave (A) can be easily seen as a double zigzag. All remaining sub-waves of the triangle should then be simple A-B-C corrections.
There is a rule for expanding triangles stating that no sub-wave may be longer than 1.5 times the length of the prior wave. This rule will be applied here to intermediate wave (B) of this triangle, which may be any of the three types (contracting, barrier or expanding). That price point is at 2,477.88.
At this stage, intermediate wave (B) is now reasonably longer than intermediate wave (A). As price moves higher, the probability of this wave count reduces. The probability today is now fairly low.
HOURLY CHART
Click chart to enlarge.
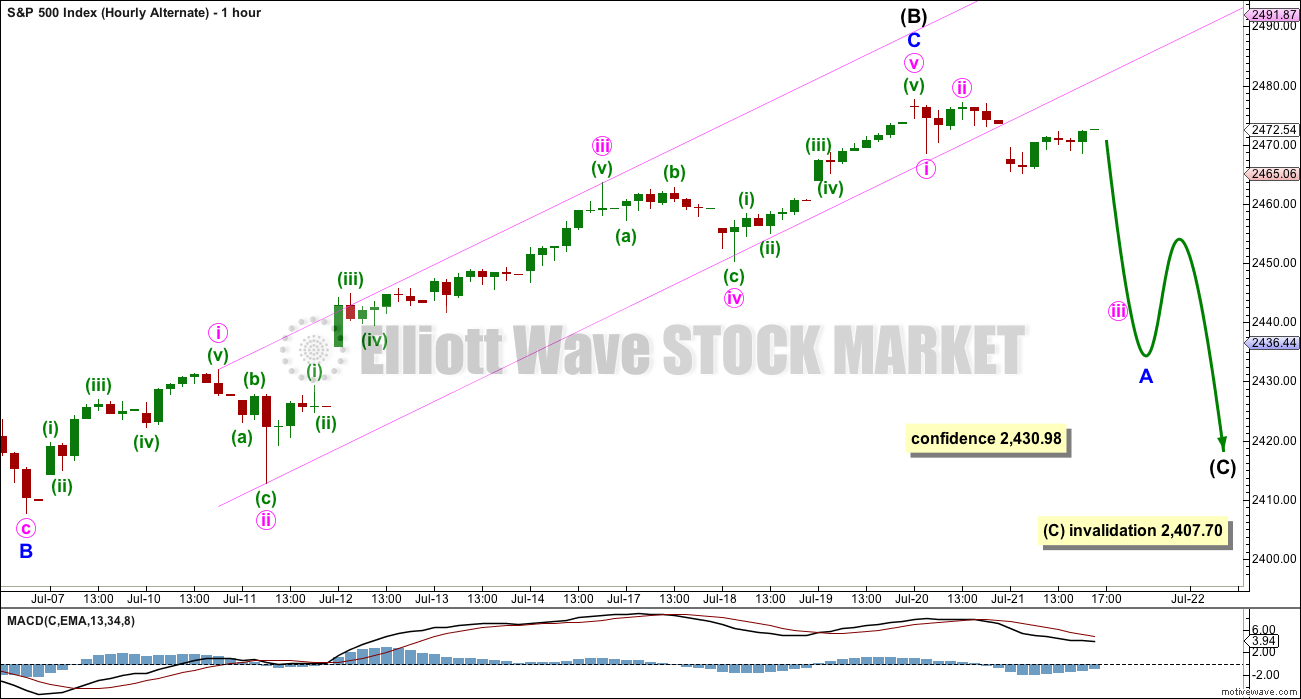
Intermediate wave (C) of a contracting triangle may not move beyond the end of intermediate wave (A) below 2,407.70. Although an expanding triangle would be valid, they are the rarest of Elliott wave structures. In my nine years of daily Elliott wave analysis I have only ever seen one structure which in hindsight was an expanding triangle. If price makes a new low here below 2,407.70, then another scenario would be considered.
TECHNICAL ANALYSIS
WEEKLY CHART
Click chart to enlarge. Chart courtesy of StockCharts.com.
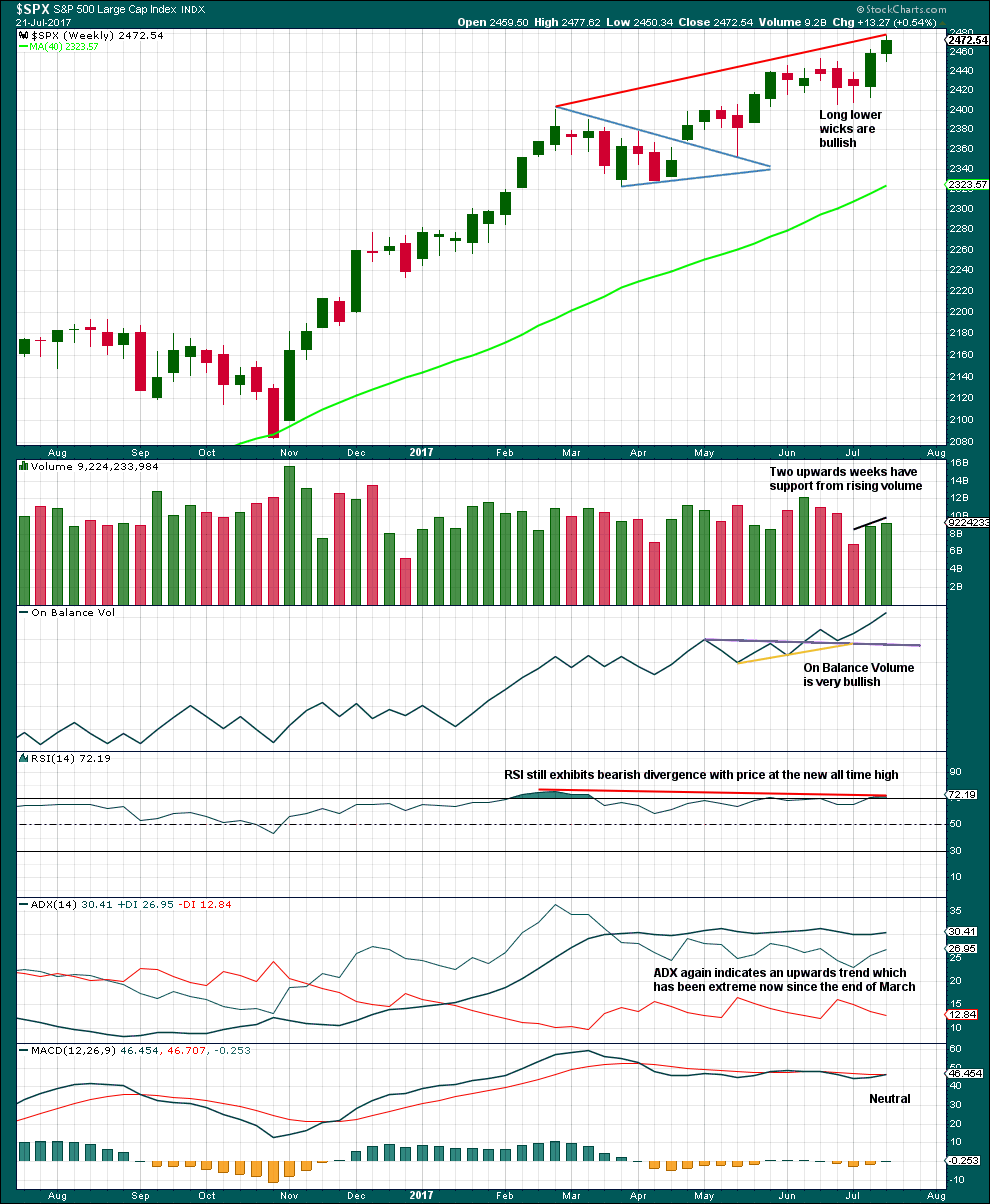
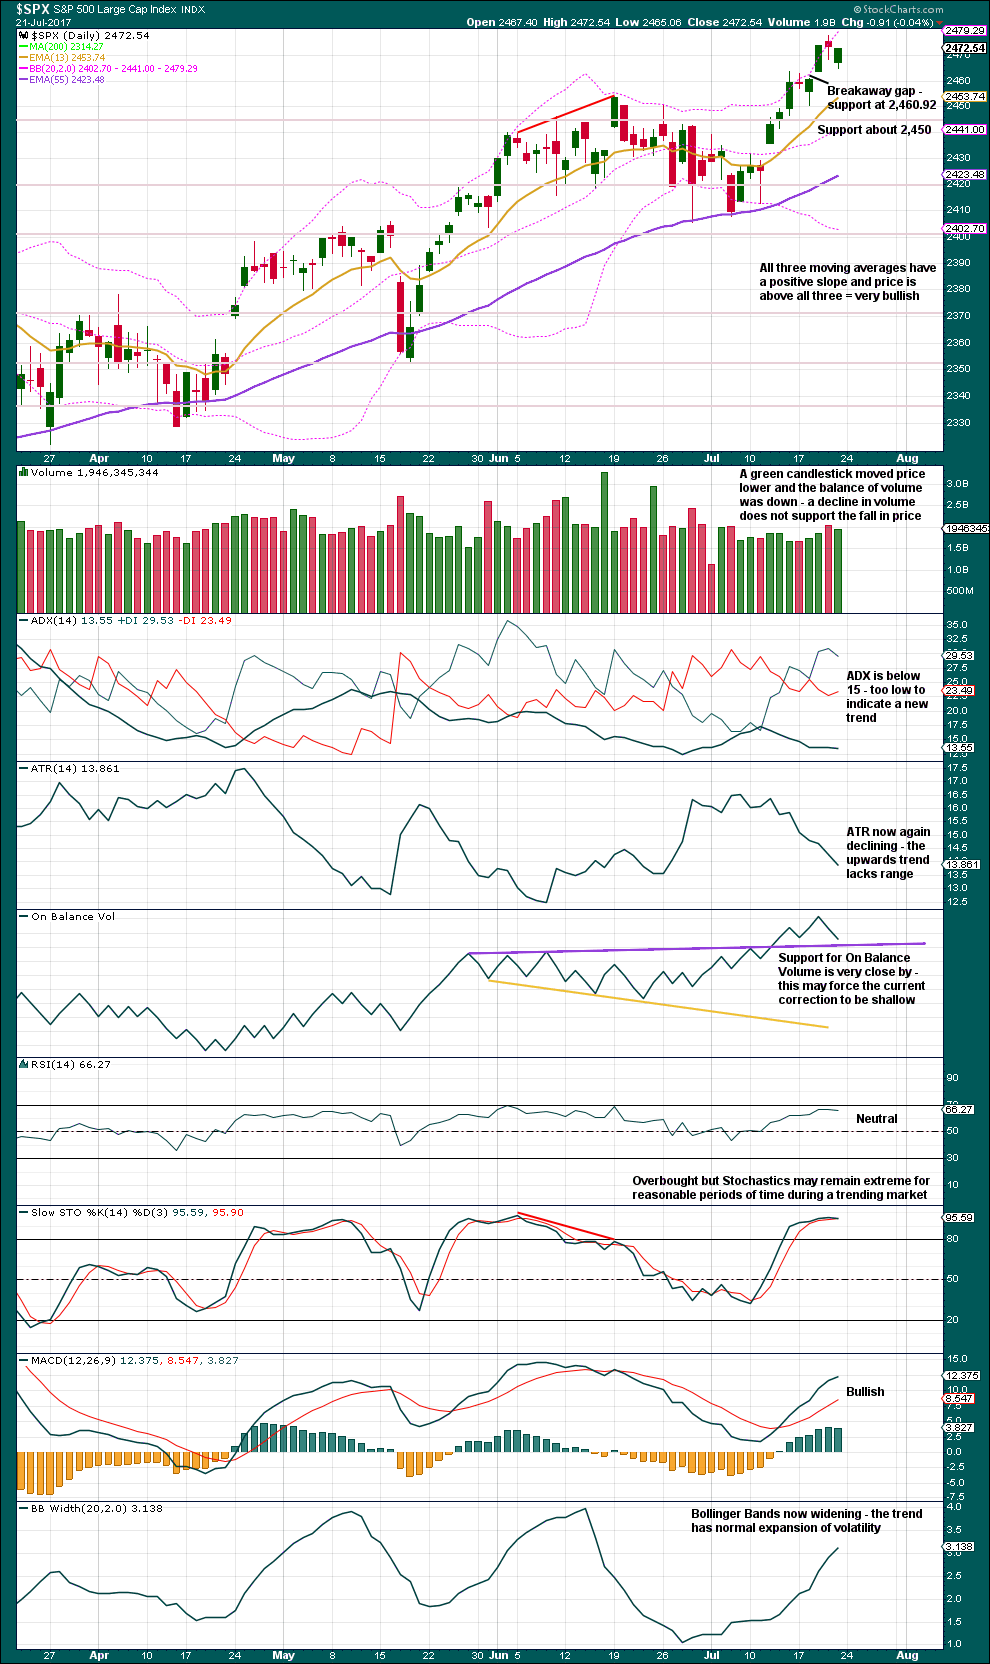
Volume is bullish. On Balance Volume is very bullish.
ADX is extreme and usually at the weekly chart level this quickly leads to a pullback to last two to four weeks. During the current bull market, which began in March 2009, ADX has only reached extreme on four previous occasions. On each of those occasions it was immediately followed by two weeks of downward movement in one case and four weeks of downwards movement in the other three cases.
In all four prior cases the pullback was sufficient to bring ADX down back below the directional lines and below extreme.
This time ADX has remained extreme for 17 weeks although the ADX line has not been rising for the whole time, only fluctuating. This trend is looking very stretched, but at this stage it may be better to rely upon Elliott wave structure and other indicators to tell when the next multi week pullback may begin.
DAILY CHART
Click chart to enlarge. Chart courtesy of StockCharts.com.
If the last gap is correctly labelled a breakaway gap, then it may not be closed; this one may offer support. Breakaway gaps may be used in trading to set stops.
Price fell of its own weight on Friday. This does not mean the market can’t fall further, it just means the probability of more downwards movement here is lower. This favours the first hourly Elliott wave chart.
On Balance Volume along with support at the gap may prevent price from falling much further here.
Although Stochastics is overbought, at this time it does not exhibit divergence with price at highs to indicate weakness. Only when it exhibits multiple divergence and RSI is also overbought would the probability of a bigger deeper pullback be reasonable.
There is room for upwards movement to continue.
VOLATILITY – INVERTED VIX CHART
Click chart to enlarge. Chart courtesy of StockCharts.com.
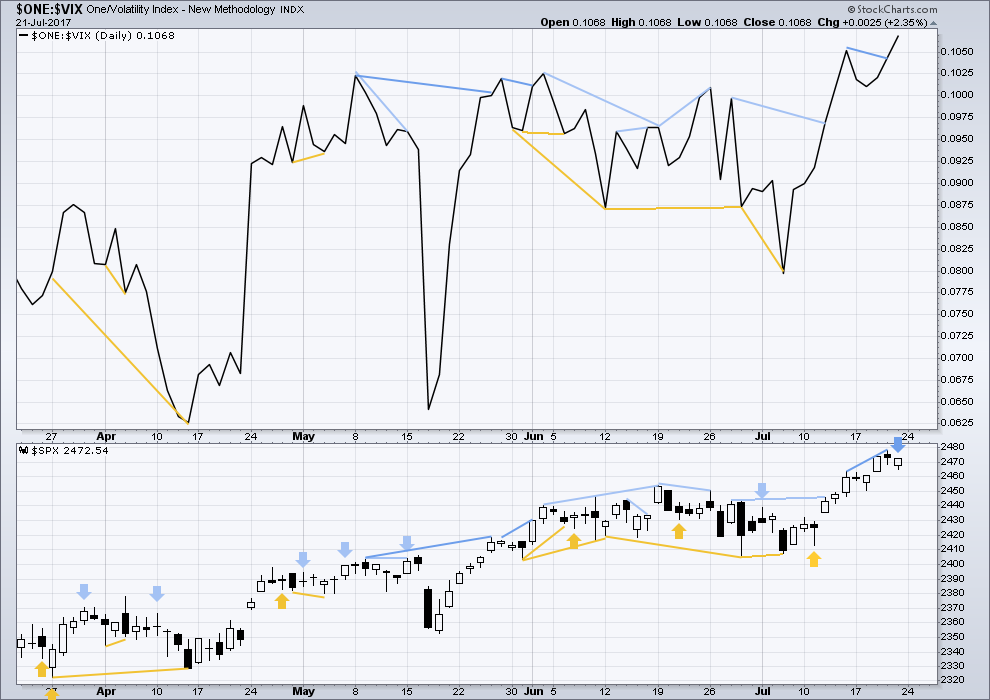
Normally, volatility should decline as price moves higher and increase as price moves lower. This means that normally inverted VIX should move in the same direction as price.
Hidden bearish divergence noted in last analysis has now disappeared. It is considered to have failed.
There is now single day bearish divergence between price and inverted VIX: price moved lower, but inverted VIX indicates volatility declined. This indicates weakness within the downwards movement from price, so it may be followed by one to two days of upwards movement.
BREADTH – AD LINE
Click chart to enlarge. Chart courtesy of StockCharts.com.
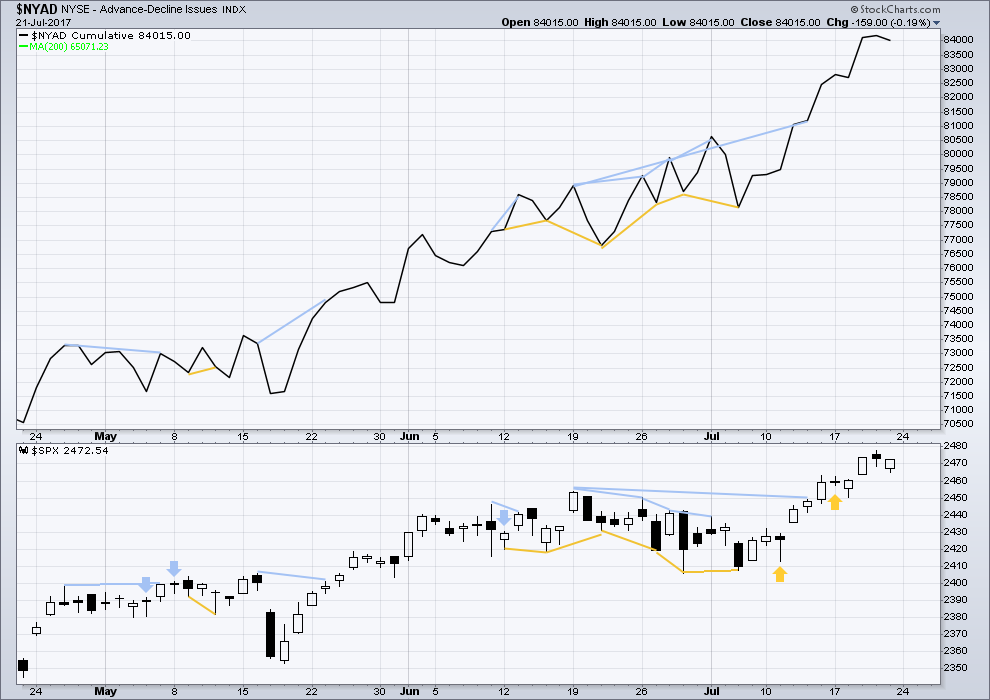
With the last all time high for price, the AD line also made a new all time high. Up to the last high for price there was support from rising market breadth.
There is normally 4-6 months divergence between price and market breadth prior to a full fledged bear market. This has been so for all major bear markets within the last 90 odd years. With no divergence yet at this point, any decline in price should be expected to be a pullback within an ongoing bull market and not necessarily the start of a bear market.
There is no divergence today between price and the AD line. Both moved lower for Friday.
Lowry’s measures of internal market strength and health continue to show a healthy bull market. This week has seen a further increase in internal health of the market, so we may have some confidence that this bull market shall continue.
Historically, almost every bear market is preceded by at least 4-6 months of divergence with price and market breadth. There is no divergence at all at this time. This strongly suggests this old bull market has at least 4-6 months to continue, and very possibly longer.
DOW THEORY
The S&P500, DJIA and DJT have all made new all time highs.
Nasdaq has made a new all time high. Modified Dow Theory (adding in technology as a barometer of our modern economy) sees all indices confirming the ongoing bull market.
The following lows need to be exceeded for Dow Theory to confirm the end of the bull market and a change to a bear market:
DJIA: 17,883.56.
DJT: 7,029.41.
S&P500: 2,083.79.
Nasdaq: 5,034.41.
Charts showing each prior major swing low used for Dow Theory are here.
Published @ 03:02 a.m. EST on 22nd July, 2017.
while price remains above 2,465.06 this is the preferred wave count.
corrections are an opportunity to join the trend, the trend is up.
always use stops and invest only 1-5% of equity on any one trade.
yes I believe so
Does anyone else have a weird spike down in MotiveWave at around the 2065 level on the 23 July?
Are you talking about the futures market?
I don’t. I’m using a BarChart data feed with Motive Wave.
I’m referring to the spot market.
Looks like another triangle of some sort unfolding today. We have been seeing quite a few of these of late. They have also been fun to trade as they are very predictable, resolving in sharp upside thrusts at their conclusion. I expect this time will be no different. ;D
Entirely possible, yes.
If the next session moves mostly sideways, then yes, it’ll look more like a triangle. That would offer a neat entry opportunity to join the trend.
Indeed. I was nimble today and took profits off trades I entered at the low this morning when VIX started to curl back up. Interesting move at the close. I think a bit more sideways movement in store before the break to the upside. It sure looks like the market makers are still intent on keeping both bulls and bears off balance. I would not be surprised to see more whiplash tomorrow.
Looking like KSS woke up today and figured out it has no business trading anywhere near 40.00! It will likely take out 35 on the next decline. I expect a bit of a bounce tomorrow and will reload 40.00 strike puts. Until tomorrow! 🙂
Lowering cost basis on DIA 215.00 calls. Closed short side of hedging DIA bearish call spreads.
Opening “stink bid” on SVXY October 100 strike puts for 10.00 or better. I think I have a great chance of getting filled with a final spike above upper BB on fifth wave up…we’ll see…
I haven’t said it for a while so I’ll say it again, thank you so very much Verne for sharing your trades with the membership. You are an invaluable addition to this membership.
For our new members over the weekend, this guy really knows his stuff. He’s been trading for a very long time. Pay attention.
If you choose to have a go and follow Verne’s trades, then I must advise in the strongest possible terms, manage your risk. Start out real small until you get the hang of what he’s doing. Risk only 1-3% of your equity on any one trade. And always, always use a stop. Trading without stops is financial suicide.
Most welcome Lara! Great fun to share the fun (and the frustration!) 🙂
I sure hope the other members don’t mind my sometimes trading out loud…!
Plunging DAX and FTSE may be of concern. Sometimes they lead the u.s. Markets down
DAX was also down quite a bit last Friday and US markets seemed to resist fully following. I did find that a bit unusual but perhaps our PPT boys were working overtime…. 🙂
It has been truly uncanny how frequently the market puts in some kind of interim top that co-incides with FED speak, and with Yammerin’ Yellen on deck for this Wednesday, could we about to see as it were, deja vu all over again? 🙂
I’m watching absolutely massive bull options positions being placed on the VIX yet again. They’re gonna be right on of these times.
It makes sense to me. Buying cheap volatility is something few other than the pros do with any consistency and the historic low levels we are seeing in VIX makes this a favorable R/R trade. I am holding August expiration calls and may roll into October for a bit more margin of safety but RTM to argues for a significant spike in VIX sometime in the next thirty days. I think we should exceed 15.00 at the very least.
Agree, 20 handle would make a lot of sense as well
This trader smartly got paid to open his position and went out to October.
http://www.cboe.com/blogs/options-hub/2017/07/21/weekend-review-of-vix-futures-and-options—7-17-2017—7-21-2017
It is really mind-blowing that we have not seen anything remotely resembling a capitulation spike in VIX (above 25) since Jan/Feb 2016.
I have never seen anything like it. There is a complacency in massively held short vol positions over an extended time period that is un-precendented. You have to go back to 1993 to find a lower VIX print at 9.31 than we had last Friday. If it remains unwound on the P4 correction, which it well could, that is going to be one scary scenario. If they do unwind it, I think we are going to get a few hours window for a 20X slam on the spike. Yum!
The unwind of short vol is likely one of the catalysts for a large bear market. Certainly one of the penalties of ZIRP is the reach for carry/yield into vol. Nearly all investors do not see this coming.
I think it is far worse than folk not seeing this coming. I get the sense that lots of traders are convinced that this is the “new normal”….absolutely incredible!
And the “new normal” is exactly the kind of talk we should see at a market high. It needs to get really overt though. Hit headlines on mainstream financial media.
I don’t think it’s upon us in the very near future though, not if Lowry’s almost 100 year history continues to show the same pattern of divergence with breadth.
If this is a Grand Super Cycle top approaching in the next 6 or so months, it may take a while to form. I’d expect everything to be extremely stretched and highly unusual. It’s a once in multi generations event, so we may be seeing things we’ve never seen before in our lifetimes. That makes sense IMO.
I agree. I am starting to think we are not going to see a top until next year. I do think we will get in the meantime, finally a more than just a measly two per cent downside move which will prompt a hue and cry from the banksters on no more rate hikes and QE infinity. I think that will drive a mania into the new year as P5 explodes to the upside in unleashed euphoria like we have never seen!
In fact I think if one plays that final blow-off move to the upside you should be able to quietly leave the scene of the coming carnage with profits more than sufficient to compensate not being exposed in the ensuing down-draft. It has always been my dream to trade a Grand Super Cycle third wave down but it may well break the system and brokerage instruments are not FDIC insured, unfortunately. I imagine I will leave a few short positions in my accounts but nothing I am not prepared to loose! It’s gonna be somethin’…!!
Very shallow brief corrections now seem to be the norm. I guess we should expect them.
I honestly don’t know that I would have sold my shorts yesterday if not for this website.