
A little more upwards movement today reached just above the target.
Summary: Another short term pullback to last about two to five days may begin tomorrow. It may pull price down to about 2,464 to 2,450.
If the channel on the hourly chart is breached early tomorrow, then have some confidence in the expectation of a pullback. If it is not, then the target for primary wave 3 to end would then be at 2,497.
New updates to this analysis are in bold.
Last monthly and weekly charts are here. Last historic analysis video is here.
MAIN ELLIOTT WAVE COUNT
WEEKLY CHART
Click chart to enlarge.
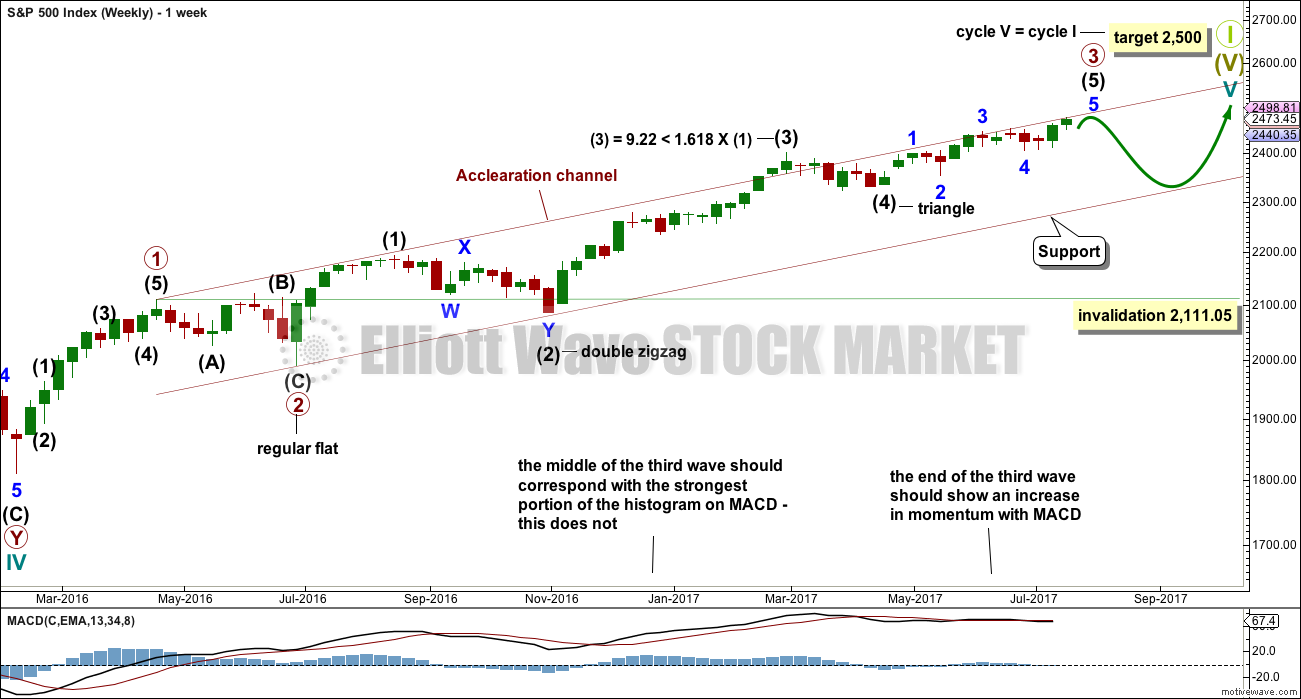
This wave count is identical to the alternate wave count up to the high labelled minor wave 3 within intermediate wave (5) within primary wave 3.
This wave count sees primary wave 3 as incomplete, but close to completion.
Within primary wave 3 impulse, the final wave of intermediate wave (5) is seen as incomplete. Intermediate wave (5) is subdividing as an impulse.
When intermediate wave (5) is complete, then primary wave 3 would be complete. Primary wave 4 may not move into primary wave 1 price territory below 2,111.05.
If price reaches the target at 2,500 and either the structure is incomplete or price keeps rising, then the next target would be the next Fibonacci ratio in the sequence between cycle waves I and V. At 2,926 cycle wave V would reach 1.618 the length of cycle wave I.
DAILY CHART
Click chart to enlarge.
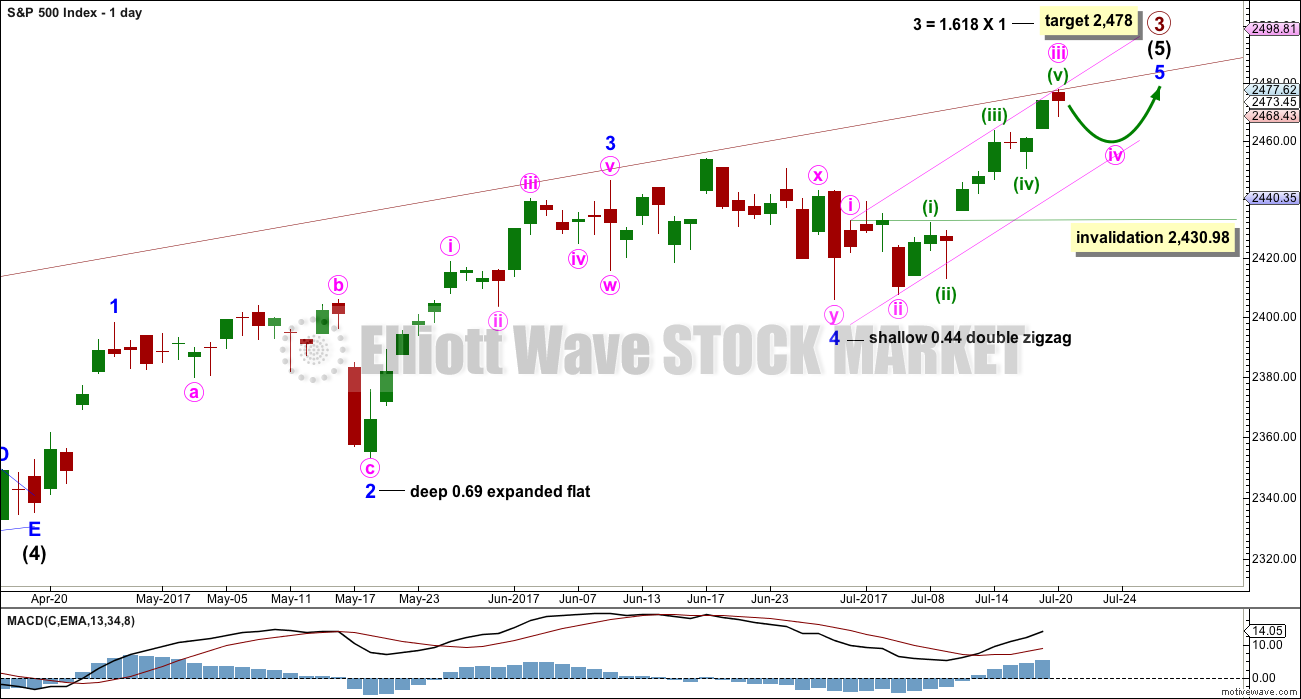
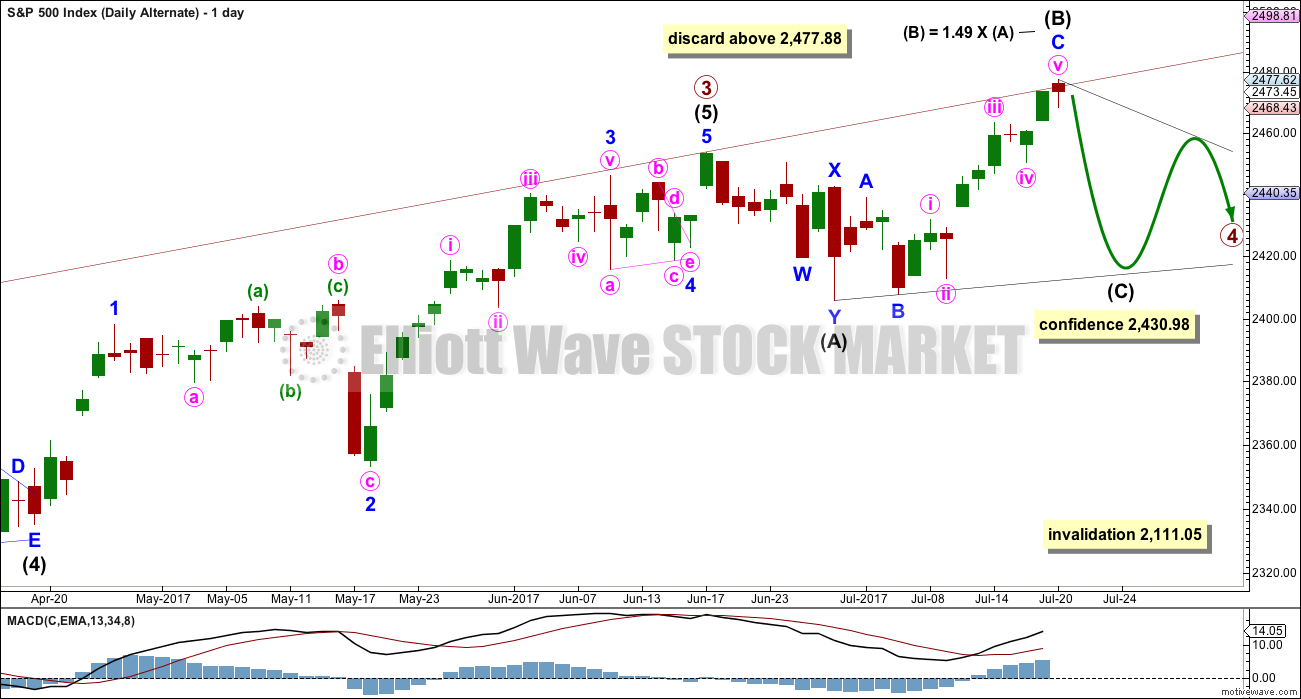
The daily chart shows only the structure of intermediate wave (5); this structure is an impulse.
Within intermediate wave (5), minor waves 1 through to 4 are now complete. The final fifth wave of minor wave 5 should now be underway. Within minor wave 5, the upcoming correction for minute wave iv may not move into minute wave i price territory below 2,430.98.
Minor wave 5 looks like it is extending. When waves extend, they show their lower degree subdivisions at higher time frames and here, within minor wave 5, minute wave ii is clear and minute wave iv should be also. That means that when it arrives minute wave iv may last two or so days.
Within minute wave iii, the subdivisions of minuette waves (ii) and (iv) now look clear on the daily chart.
There is perfect alternation between the deep expanded flat of minor wave 2 and the shallow double zigzag of minor wave 4.
HOURLY CHART
Click chart to enlarge.
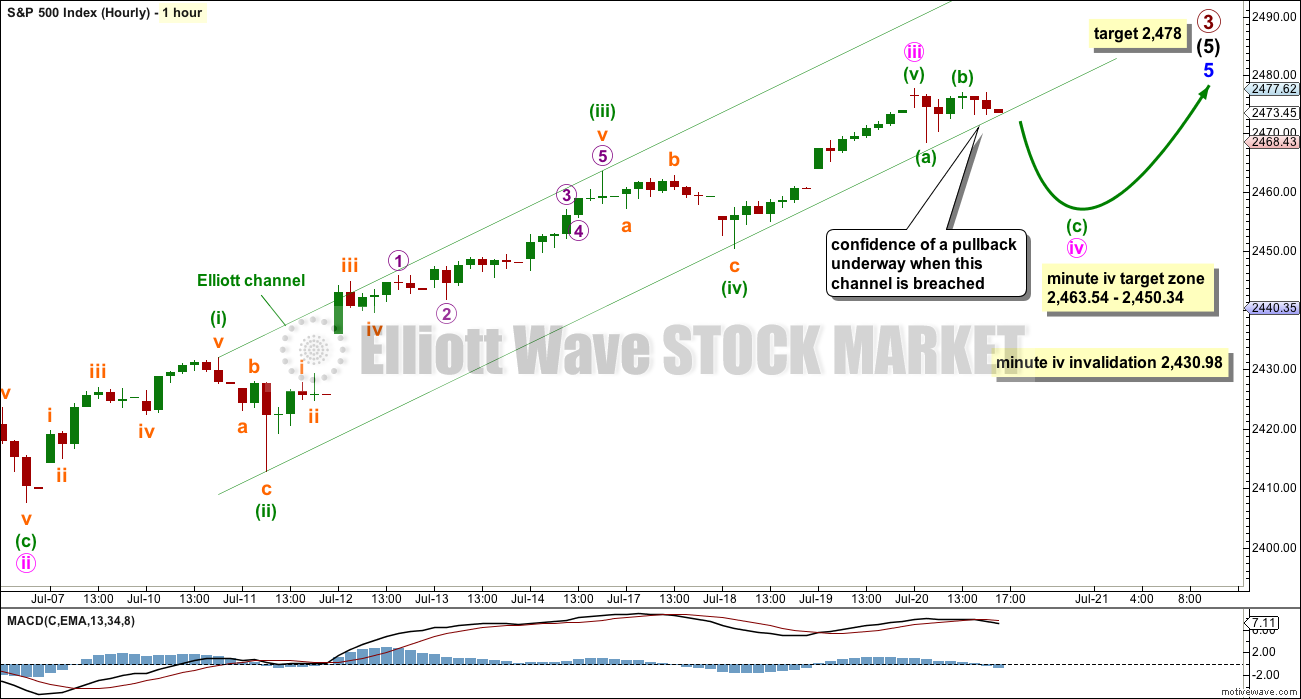
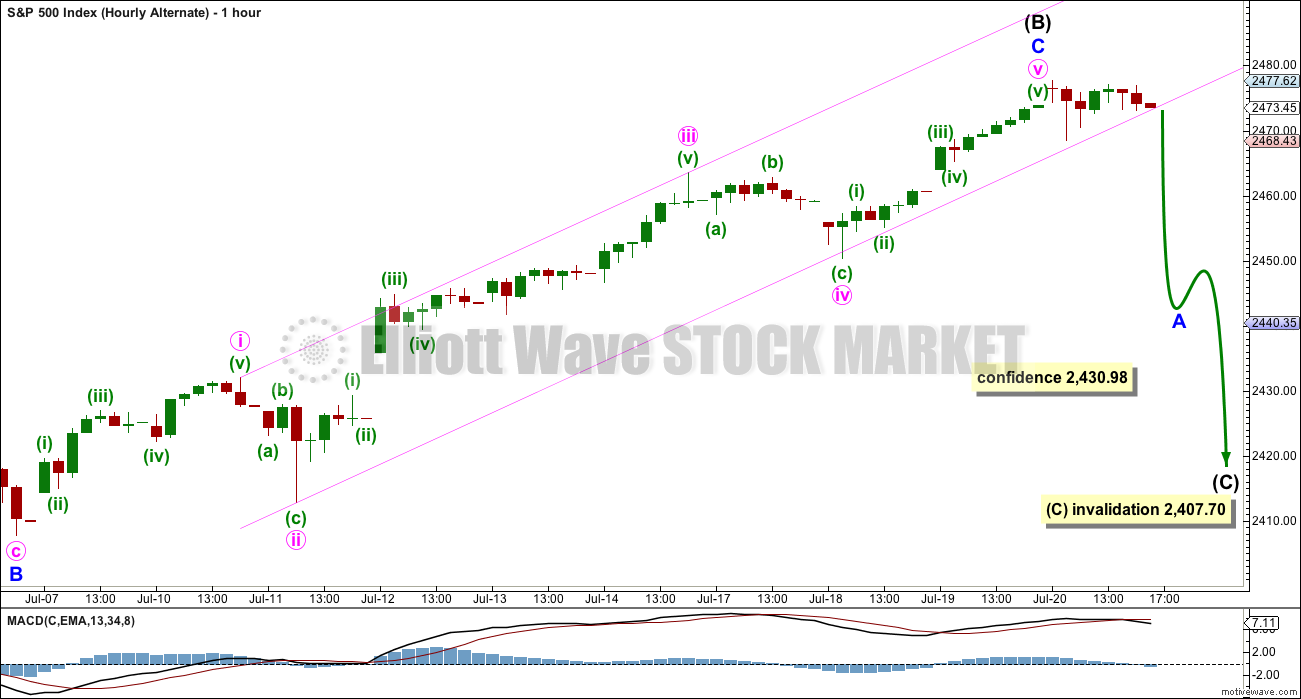
Minor wave 5 may be subdividing as an impulse so far. The middle of the third wave has the strongest upwards momentum. This wave count fits so far with MACD.
There is no Fibonacci ratio between minuette waves (i) and (iii). Minuette wave (v) is just a little too much longer than equality in length with minuette wave (i) to say they have a Fibonacci ratio. But it is not uncommon for the S&P to not exhibit Fibonacci ratios between all three of its actionary waves.
The channel about minute wave iii still needs to be clearly breached by downwards movement before confidence may be had that minute wave iii is over. If this labelling is correct, then that should happen at the start of next session.
If it does not happen, and if a new all time high is made tomorrow, then the target for primary wave 3 at 2,478 will be wrong and minor wave 5 would be extending further. The next target would be about 2,497 where minor wave 5 would reach equality in length with minor wave 3.
When minute wave iii is complete, then minute wave iv may not move into minute wave i price territory below 2,430.98.
Minute wave iv may end within the price territory of the fourth wave of one lesser degree. Minuette wave (iv) has its price territory from 2,463.54 to 2,450.34. The lower edge of this range is also a strong area of support.
ALTERNATE ELLIOTT WAVE COUNT
WEEKLY CHART
Click chart to enlarge.
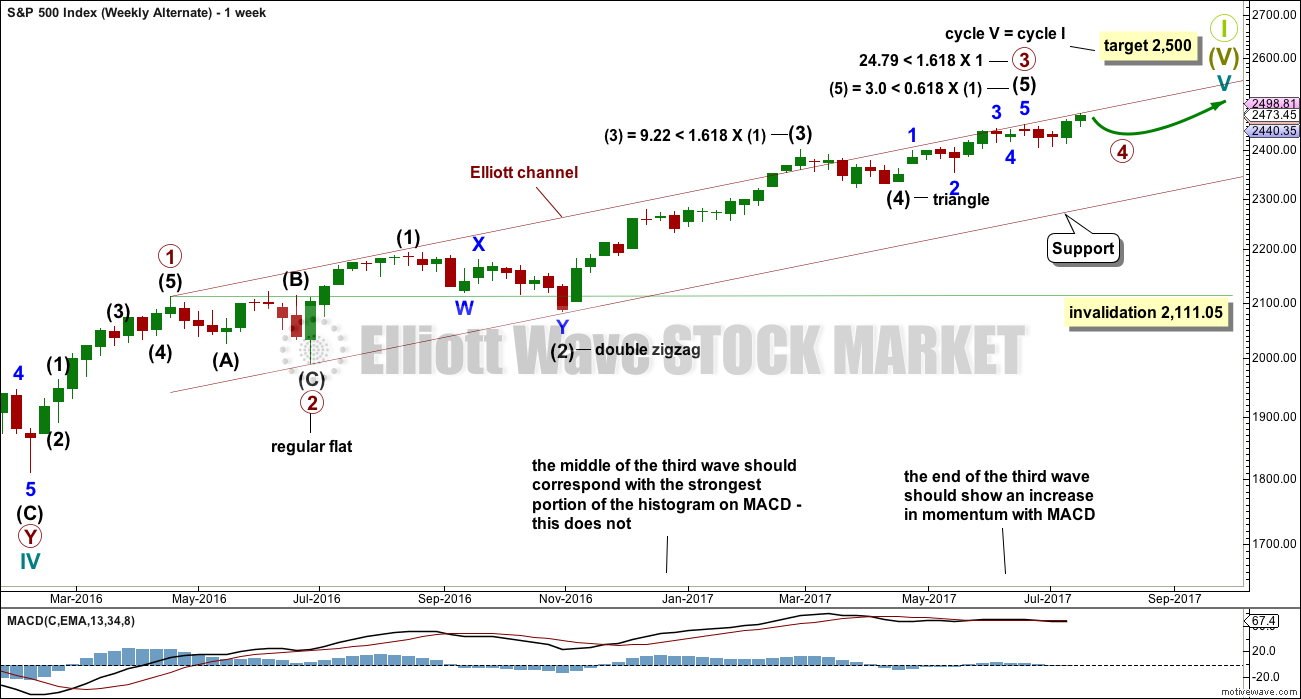
Primary wave 4 may now be underway.
Primary wave 2 was a regular flat correction that lasted 10 weeks. Given the guideline of alternation, primary wave 4 may most likely be a single or multiple zigzag or a triangle and may last about a Fibonacci eight or thirteen weeks, so that the wave count has good proportion and the right look. So far it has lasted three weeks. This is far too brief to be considered complete or even close to complete.
Primary wave 4 may end within the price territory of the fourth wave of one lesser degree. Intermediate wave (4) has its range from 2,400.98 to 2,322.35.
Primary wave 4 may not move into primary wave 1 price territory below 2,111.05.
DAILY CHART
Click chart to enlarge.
A new all time high means a double zigzag for primary wave 4 is still possible but much less likely. A double combination would be more likely but would not offer very good alternation with the flat correction of primary wave 2.
What would still offer good alternation would be a running contracting triangle.
Within the triangle, intermediate wave (A) can be easily seen as a double zigzag. All remaining sub-waves of the triangle should then be simple A-B-C corrections.
There is a rule for expanding triangles stating that no sub-wave may be longer than 1.5 times the length of the prior wave. This rule will be applied here to intermediate wave (B) of this triangle, which may be any of the three types (contracting, barrier or expanding). That price point is at 2,477.88.
At this stage, intermediate wave (B) is now reasonably longer than intermediate wave (A). As price moves higher, the probability of this wave count reduces. The probability today is now fairly low.
HOURLY CHART
Click chart to enlarge.
Intermediate wave (C) of a contracting triangle may not move beyond the end of intermediate wave (A) below 2,407.70. Although an expanding triangle would be valid, they are the rarest of Elliott wave structures. In my nine years of daily Elliott wave analysis I have only ever seen one structure which in hindsight was an expanding triangle. If price makes a new low here below 2,407.70, then another scenario would be considered.
TECHNICAL ANALYSIS
WEEKLY CHART
Click chart to enlarge. Chart courtesy of StockCharts.com.
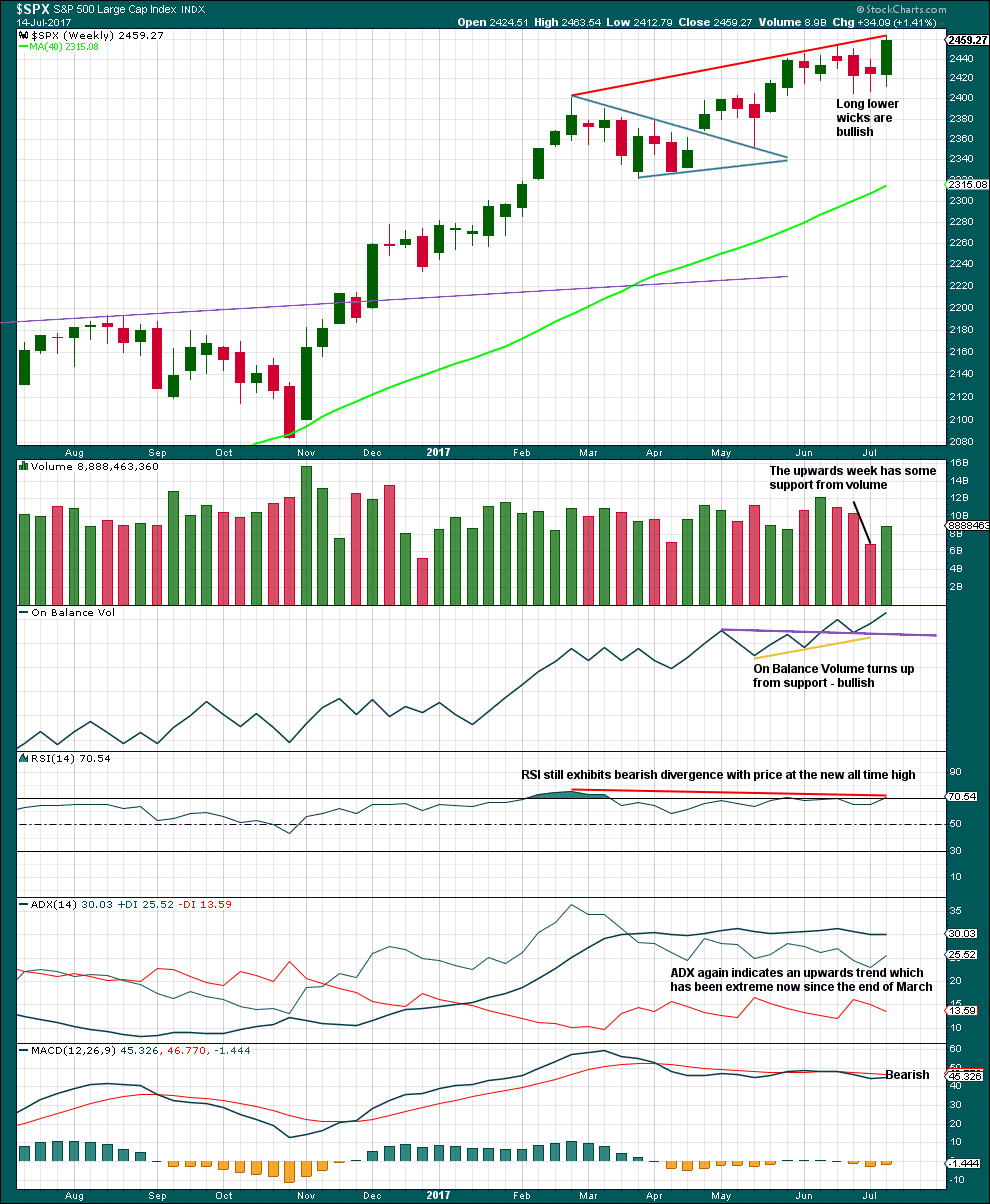
Candlesticks, volume, and On Balance Volume are bullish.
ADX, RSI and MACD are bearish.
Overall, give more weight to volume and On Balance Volume.
DAILY CHART
Click chart to enlarge. Chart courtesy of StockCharts.com.
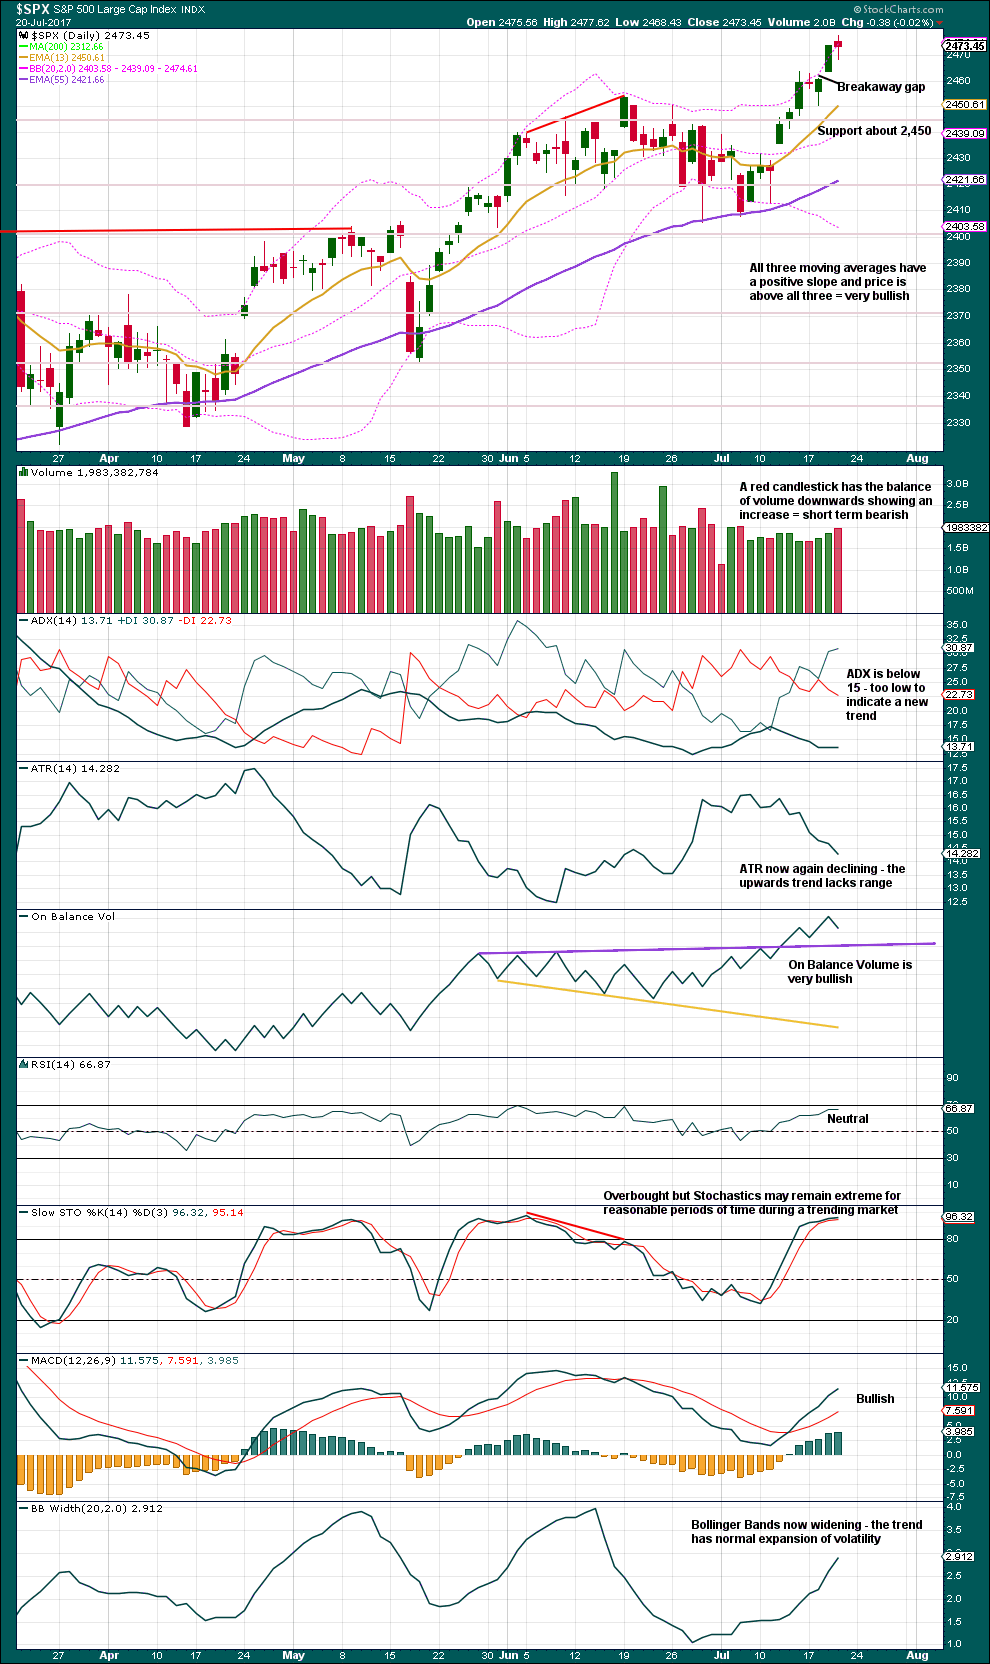
Look now for support about 2,450 for any pullbacks within this upwards trend.
Volume today supports downwards movement during this session. This suggests a downwards day tomorrow.
The trend looks healthy, except for ATR.
Corrections are an opportunity to join the trend.
VOLATILITY – INVERTED VIX CHART
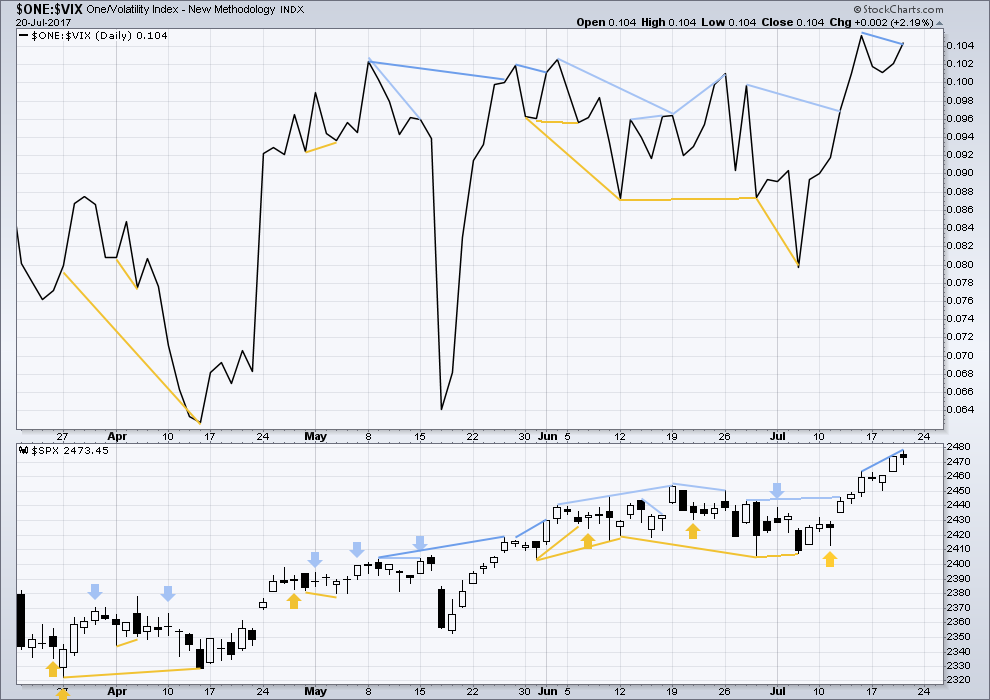
Click chart to enlarge. Chart courtesy of StockCharts.com.
Normally, volatility should decline as price moves higher and increase as price moves lower. This means that normally inverted VIX should move in the same direction as price.
There are five instances of hidden bearish divergence on this chart; instances where inverted VIX made a new high but price did not make a corresponding new high. This divergence is bearish and indicates weakness within price. Three of those prior four instances were followed by some downwards movement.
A fifth instance of hidden bearish divergence, which began yesterday, continues today. This may be followed by one or two days of downwards movement before it may be resolved.
BREADTH – AD LINE
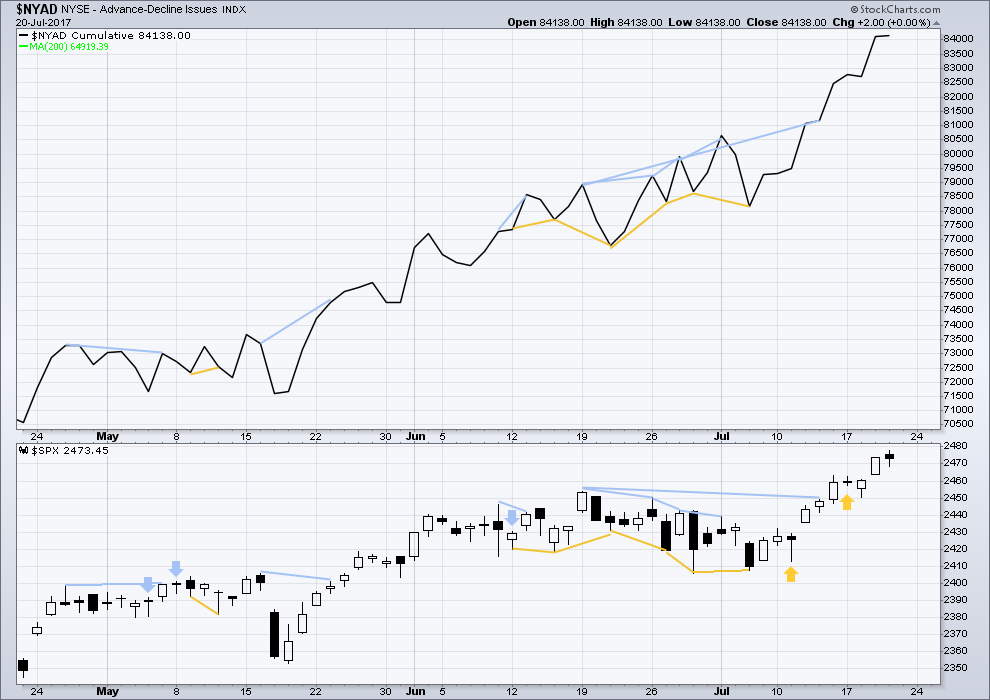
Click chart to enlarge. Chart courtesy of StockCharts.com.
With the last all time high for price, the AD line also made a new all time high. Up to the last high for price there was support from rising market breadth.
There is normally 4-6 months divergence between price and market breadth prior to a full fledged bear market. This has been so for all major bear markets within the last 90 odd years. With no divergence yet at this point, any decline in price should be expected to be a pullback within an ongoing bull market and not necessarily the start of a bear market.
There is no divergence today between price and the AD line. Both have now made new all time highs. Upwards movement from price today has support from rising market breadth
Lowry’s measures of internal market strength and health continue to show a healthy bull market. The rise in price comes with expanding buying power and contracting selling pressure, normal and healthy for a bull market, even an old one.
Historically, almost every bear market is preceded by at least 4-6 months of divergence with price and market breadth. There is no divergence at all at this time. This strongly suggests this old bull market has at least 4-6 months to continue, and very possibly longer.
DOW THEORY
The S&P500, DJIA and DJT have all made new all time highs.
Nasdaq has made a new all time high. Modified Dow Theory (adding in technology as a barometer of our modern economy) sees all indices confirming the ongoing bull market.
The following lows need to be exceeded for Dow Theory to confirm the end of the bull market and a change to a bear market:
DJIA: 17,883.56.
DJT: 7,029.41.
S&P500: 2,083.79.
Nasdaq: 5,034.41.
Charts showing each prior major swing low used for Dow Theory are here.
This analysis is published @ 07:43 p.m. EST.
Both hourly charts expect a little more upwards movement very short term folks. So if jumping in long here, stops just above today’s low for a short term trade, and move stops up to breakeven ASAP. Exit after a new ATH or hold on to see if minute iv is over and the new target for primary 3 at 2,490 is met.
As always, only 1-5% of equity on any one trade please. Manage risk.
Or this…
Moving the degree of labelling within the zigzag down one degree, this may only be wave A of a flat or triangle, or wave W of a combination.
A triangle would offer better alternation with the flat of minute ii.
A sideways chop, with minute iv to end above the target zone, for a couple of sessions.
Then another upwards breakout.
Thanks for the guidance Lara. I added a few long positions today when VIX started tank toward the close. Really tough to know what Mr Market is going pull out of his sleeves next week but I suspect we will make bolt for the top of primary three. Bullish sentiment is absolutely amazing!
I am really looking forward to FINALLY getting a top.
Have a great week-end everyone. Enjoy a Pina Colada with a cherry on top (even if it is a virgin as my wife prefers!) 🙂
Wow! A new 52 week low in VIX!!
Looks like they wanted to keep it propped up till the close. I am still gong to exit my shorts as I think the plan is to complete the decline after hours and ramp futures up overnight. This is what they did on election night and we are about to see a repeat. Most traders do not use futures so it is a clever scheme to keep folk off balance. I am keeping powder dry for the final wave up.
I’ll have two hourly charts for the main wave count. This is the first, and possibly slightly preferred. Let’s see how volume, VIX and AD line behave today.
Minute ii was an expanded flat and deep. Minute iv could possibly be over, just above the target zone, as a zigzag. They do tend to be quicker structures than flats.
Perfect alternation and both show up at the daily chart level, so at that time frame it looks good now.
Once again my timing is awful! 🙂
I agree with this count and think minute four is done.
🙁 Can’t win them all eh Verne. Hey, you got out of prior longs pretty close to that high though? Take the money and run….
At one point DAX was down almost 2% today. Deep pockets arrested today’s decline and it could be that market makers want to limit big moves because of options expiration. It suggests that minute four will complete next week and not today as I anticipated. I will hold my nose and shorts through the week-end, albeit reluctantly.
The price action in NFLX is beyond manic.
It is hard to believe that buying in some of these already inflated stocks can become any more irrational. We are seeing an unprecedented fourth day at beyond a 2 standard deviation trading range outside the upper B bands. Who are the imbeciles buying this stock??!! 🙂
Looks parabolic to me…
What goes up….
If we close today’s gap, I am going to think 2465 may have been all she wrote for 4.
However, could also retest the channel and fall back off. SPX really throwing me for loops lately.
These shallow corrections have become quite common. I really don’t like what I am seeing so far and just about ready to pull the trigger on my short trades. Not looking too good for more downside….I agree about the gap. That’s my line in the sand.
I don’t think the correction is as shallow as the charts make it seem right now. RUT’s reversal and repeated long upper wicks on the hourly chart suggest to me the pullback will last into Monday. I could be wrong, but I think extreme weakness in the dollar bodes poorly for the Asian markets come Sunday night.
I think panic buying in anticipation of a stellar tech earnings is giving the Nasdaq internal strength, and technicals suggest the support is backed up by breadth and volume. But weakness in the dollar is going to weigh on financials and I don’t think there is as much anticipation of out-of-the-ballpark earnings outside of tech. Also, Nasdaq volatility (VXN) for today looks like it’ll end in a strong hammer which could manifest itself in a selloff early next week if GOOG and FB don’t deliver.
Possibly a flat correction for a second wave; if so this morning’s lows should be taken out next wave down. Not too fond of all the chop…. 🙁
Looks like another famed rising wedge again. So tortuous but par for the course….
Yep. The resistance to any decline in the market is completely nuts. Lots of markets now sporting rising wedges at multiple degrees, just as we are once again seeing in price action today.
Algos trying to buy the dip as a bottom…it barely got into the area of Lara’s target so probably still more downside to complete C; should be evident within the hour…
New low under 2464.55 will confirm five down three up start of impulse down. It is looking that it will indeed end today at this rate unless we get a very extended third wave….opening sell to close order on my short positions with contingent order once we get below 2460.00
I agree if we get below 2460 we will see a very quick end but at this rate I don’t know if it will get there today. The buyback lacks volume and breadth. The weakest of the indices is RUT which had a sharp shooting star reversal this morning compared to the Nasdaq’s strong hammer. Unless we get a big reversal by the end of the day, the strong rejection of an upwards channel breakout for RUT suggests to me that this fourth wave down will last into next week. The pivot point could be earnings for GOOG and FB. NFLX’s beat induced a lot of panic buying.
The people buying apparently don’t read the fine print. The “beat” was on the increase in the subscriber base. What everyone is ignoring is the no-end-in-sight hemorrhaging of cash to the tune of billions. I guess it has worked for Amazon for so long who is to say it won’t for NFLX. I maintain a small short position. The longer it stays elevated outside the B bands, the more dramatic the return to reality will be. Glad I got August puts as it seems to be quite comfy is such rarefied air!
I will be on the look-out for a swift completion to this probable minuette C down with an intra-day reversal and start up for minute five.
VIX indicating market participants are still wildly bullish and feverishly buying the dips so corrective waves are completing rapidly. This should set things up for a final blast higher to conclude primary three early next week. Seasonal weakness of the Fall and the historic declines of years ending in seven are now starting to loom large. I have to abandon my thesis of us seeing a top before the Fall as there is simply not enough time to complete a primary wave correction, embark on and complete a primary wave to the top, AND have an initial impulsive wave down and second wave up to set up the third wave that would be expected in the even of some kind of market crash typical of years ending in seven, and portended by the seven Hindenburg Omens. Sometimes these signals simply do not result in any kind of spectacular market movement, and based on the timing questions this one may end up being a dud. Even if the primary fourth wave is deep, I doubt it will qualify as a crash. I am starting to think that Lara is right and that we are looking at next year for a market top.
Of course, Mr. Market could also do something that absolutely no one is expecting….! 🙂
Didn’t you say you expect the pullback to hit the 21-day EMA at 2443? Do You think it will get there today?
I also think the reversal could be intraday but I could also see it lasting until Monday. Technically minute 4 started at the open yesterday so in order for it to be around the same as length as wave 2 we would expect it to end by the end of today or by very early Monday. Since it took wave 3 a little longer to top out I could see wave 4 lasting a little longer though based on the fact that yesterday’s morning pullback reversed back nearly to the morning high.
RUT gapped way above its channel dating back to December and then *very* rapidly reversed back inside the channel, which is pretty bearish. Both the S&P and Nasdaq are holding support from last morning so if that breaks at some point this morning the swoon could cut deeper and get us to that 2464-2450 level Lara has mentioned. I think it would take >1 day to get us to 2443.
I was looking at the way C waves have been behaving the last few weeks. In most cases they are getting done fairly quickly. If it does reverse today I think it will be close to the end of the session just as everybody is piling in on the short side. I plan on exiting most of my short positions just before the close if we get close to Lara’s downside targets.
New highs 86, new lows 4 right now. The new highs have been holding up lately in this surge higher. Should see lots of new lows near top ….along with new highs.
For what it’s worth Verne, I believe the next high is the final high. Too much complacency, and utter destruction occurs with a break below 2300 and VIX at 20.
My one half cent.
I have to say that is something I have also been seriously considering.
Ha!
darn wabbit
Nyah! nyah nyah nyah, nyah!
Hey Doc…I was foist AND second!! 🙂
(Actually when the first post went into moderation I just re-posted)