
A very small inside day leaves the Elliott wave counts mostly unchanged.
Summary: In the short term, volume and divergence with the AD line suggest a green daily candlestick tomorrow and a new all time high.
The profit target is at 2,478. The upwards trend has internal strength and health. Use corrections as an opportunity to join the trend. Any members not currently long this market may have another opportunity this week when a small fourth wave unfolds, which should remain above 2,430.98.
Always use stops. They should be set at this time just below 2,430.98, or for profitable positions use a trailing stop. Invest only 1-5% of equity on any one trade.
New updates to this analysis are in bold.
Last monthly and weekly charts are here. Last historic analysis video is here.
MAIN ELLIOTT WAVE COUNT
WEEKLY CHART
Click chart to enlarge.
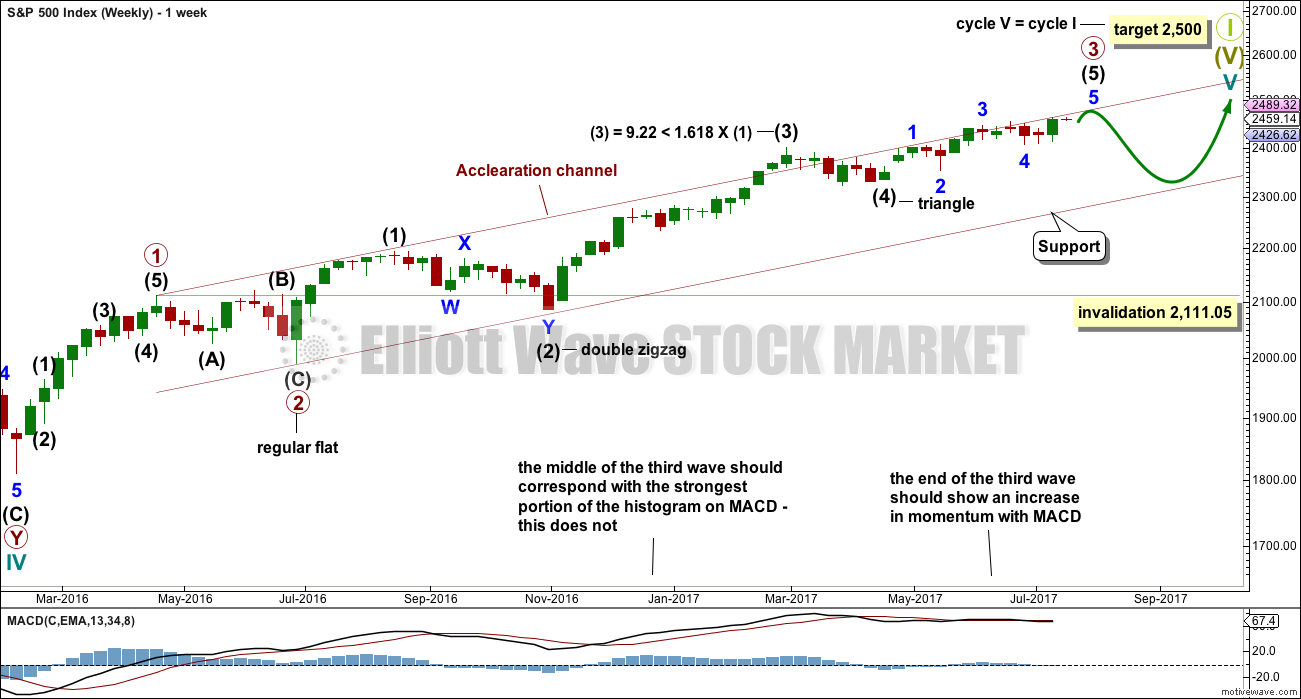
This wave count is identical to the alternate wave count up to the high labelled minor wave 3 within intermediate wave (5) within primary wave 3.
This alternate wave count sees primary wave 3 as incomplete, but close to completion.
Within primary wave 3 impulse, the final wave of intermediate wave (5) is seen as incomplete. Intermediate wave (5) is subdividing as an impulse.
When intermediate wave (5) is complete, then primary wave 3 would be complete. Primary wave 4 may not move into primary wave 1 price territory below 2,111.05.
If price reaches the target at 2,500 and either the structure is incomplete or price keeps rising, then the next target would be the next Fibonacci ratio in the sequence between cycle waves I and V. At 2,926 cycle wave V would reach 1.618 the length of cycle wave I.
DAILY CHART
Click chart to enlarge.
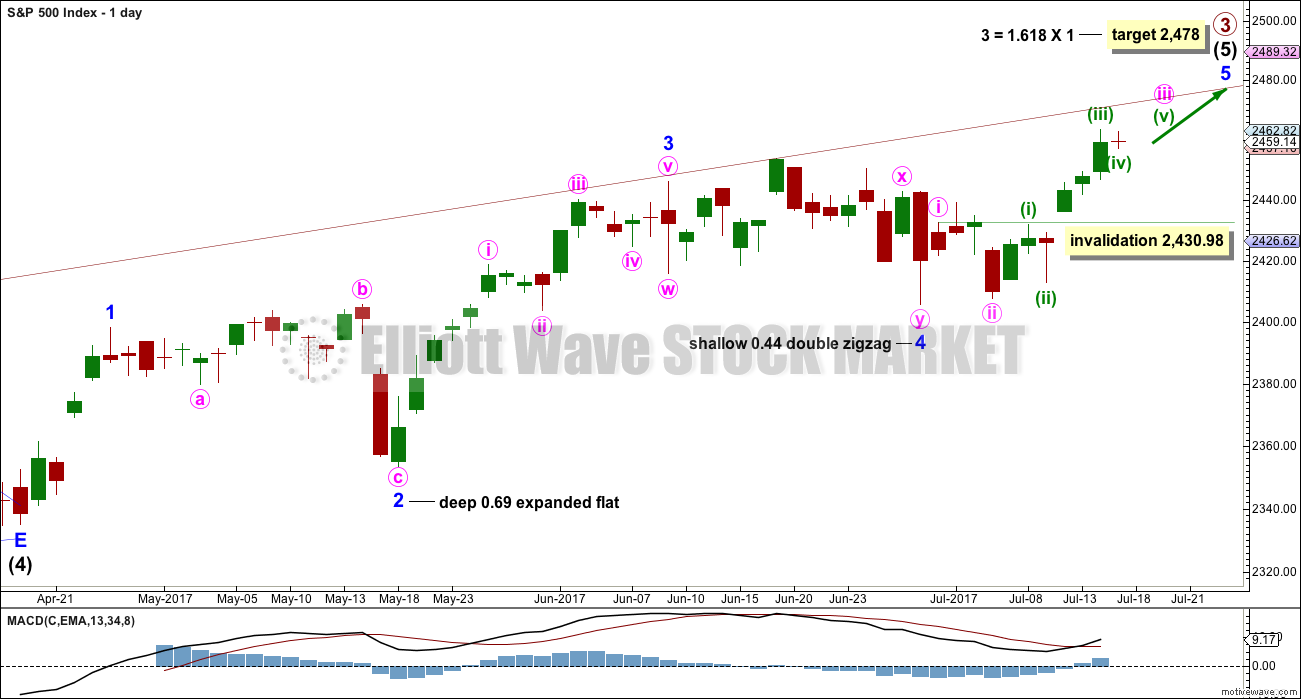
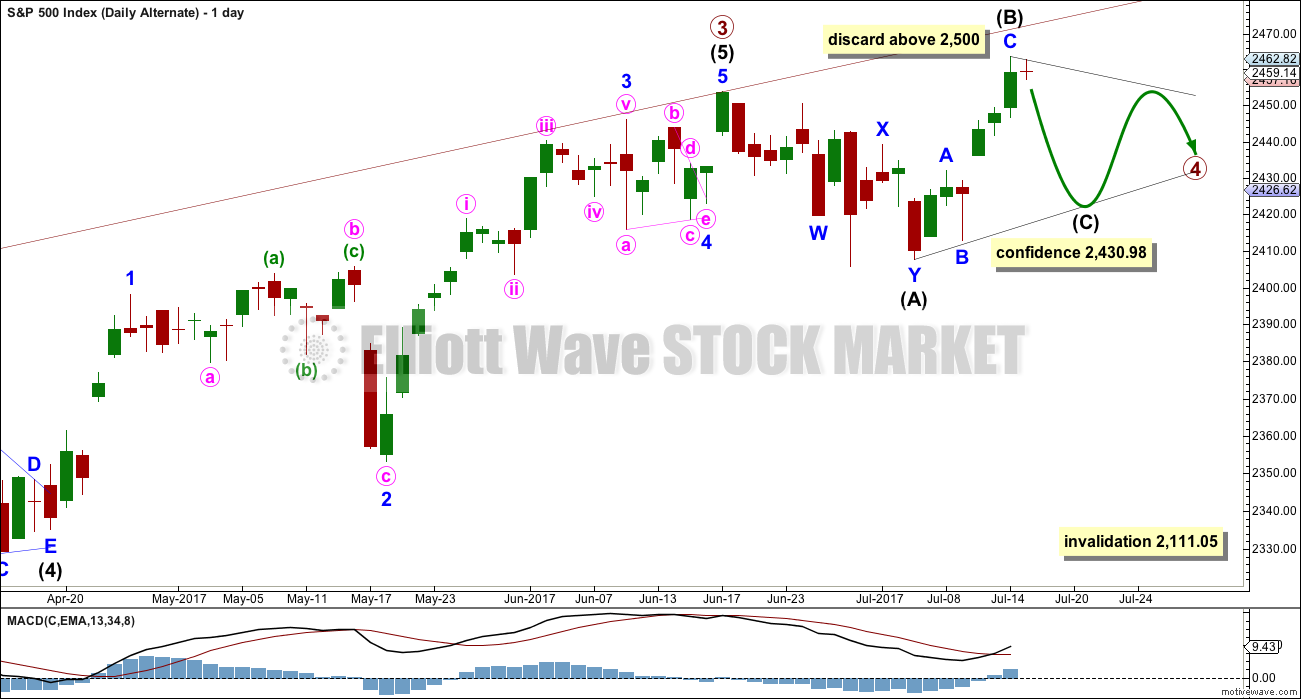
The daily chart shows only the structure of intermediate wave (5); this structure is an impulse.
Within intermediate wave (5), minor waves 1 through to 4 are now complete. The final fifth wave of minor wave 5 should now be underway. Within minor wave 5, the upcoming correction for minute wave iv may not move into minute wave i price territory below 2,430.98.
Minor wave 5 looks like it is extending. When waves extend, they show their lower degree subdivisions at higher time frames and here, within minor wave 5, minute wave ii is clear and minute wave iv should be also. That means that when it arrives minute wave iv may last two or so days.
Within minute wave iii, the subdivisions of minuette waves (ii) and (iv) now look clear on the daily chart. For this reason the end of minuette wave (iii) today is moved up on the hourly chart.
There is perfect alternation between the deep expanded flat of minor wave 2 and the shallow double zigzag of minor wave 4.
HOURLY CHART
Click chart to enlarge.
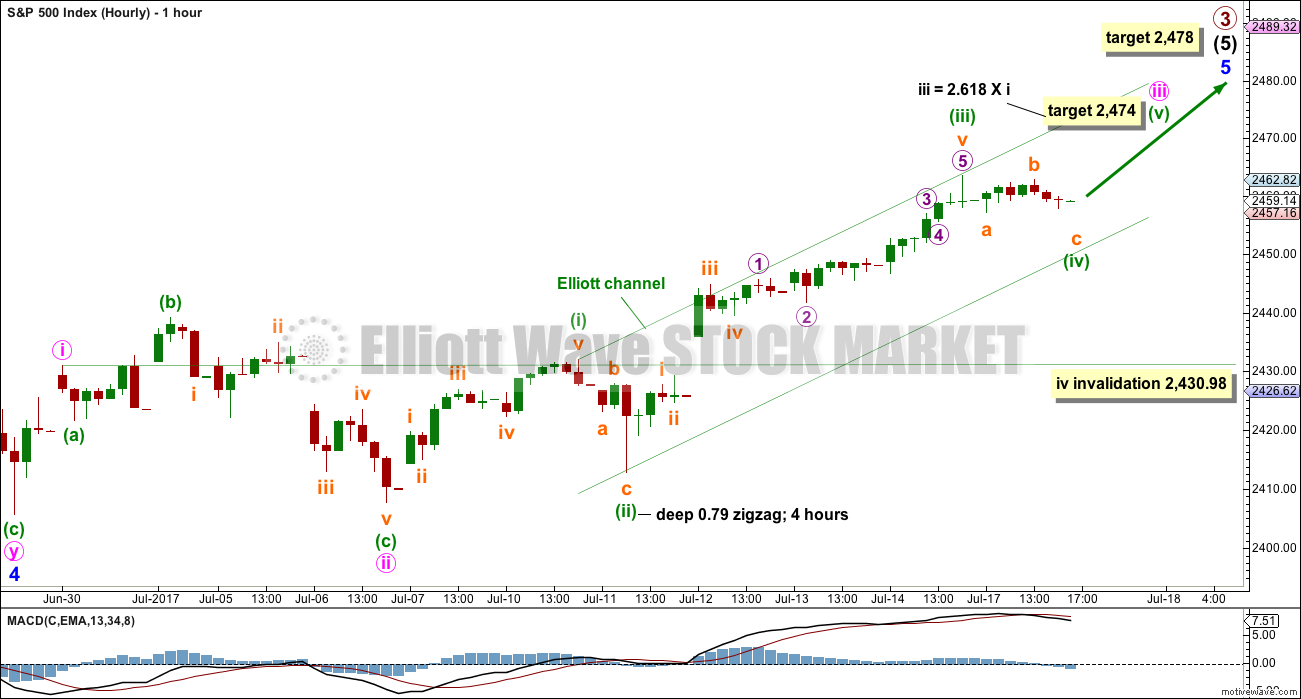
Minor wave 5 may be subdividing as an impulse so far. The middle of the third wave is showing an increase in upwards momentum.
There is no Fibonacci ratio between minuette waves (i) and (iii). Minuette wave (iii) exhibits stronger momentum than minuette wave (i). This wave count fits with MACD.
Minuette wave (iv) may end early tomorrow. If it is time consuming, it may find support at the lower edge of the Elliott channel.
When minute wave iii is complete, then minute wave iv may not move into minute wave i price territory below 2,430.98.
Use the Elliott channel to indicate when minute wave iii is over. When this channel is clearly breached by downwards movement, not sideways, it shall be an early indicator that minute wave iv may possibly be underway. However, the S&P500 has a tendency to form slow rounded tops, breaching channels then continuing on higher before finally turning. This is an early indication of a potential trend change, and should be approached with caution.
ALTERNATE ELLIOTT WAVE COUNT
WEEKLY CHART
Click chart to enlarge.
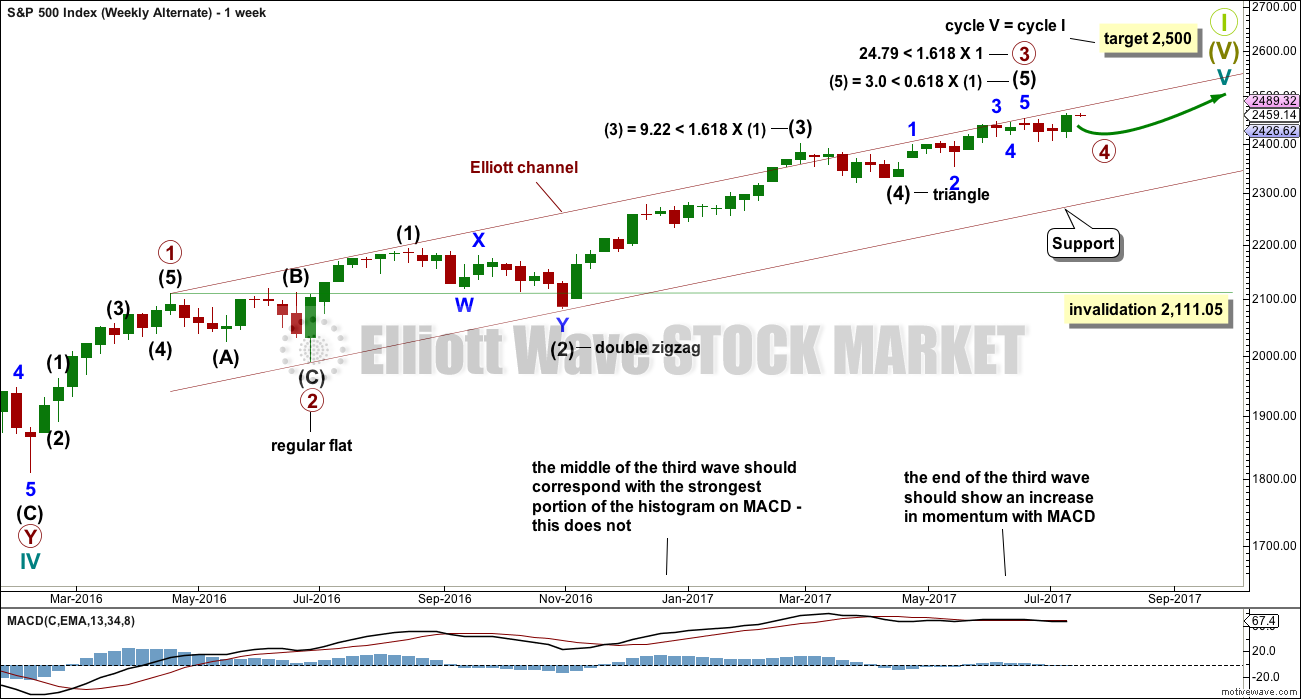
Primary wave 4 may now be underway.
Primary wave 2 was a regular flat correction that lasted 10 weeks. Given the guideline of alternation, primary wave 4 may most likely be a single or multiple zigzag or a triangle and may last about a Fibonacci eight or thirteen weeks, so that the wave count has good proportion and the right look. So far it has lasted three weeks. This is far too brief to be considered complete or even close to complete.
Primary wave 4 may end within the price territory of the fourth wave of one lesser degree. Intermediate wave (4) has its range from 2,400.98 to 2,322.35.
Primary wave 4 may not move into primary wave 1 price territory below 2,111.05.
DAILY CHART
Click chart to enlarge.
A new all time high means a double zigzag for primary wave 4 is still possible but much less likely. A double combination would be more likely but would not offer very good alternation with the flat correction of primary wave 2.
What would still offer good alternation would be a running contracting triangle.
Within the triangle, intermediate wave (A) can be easily seen as a double zigzag. All remaining sub-waves of the triangle should then be simple A-B-C corrections.
There is no rule stating a limit for B waves within running triangles. There is a convention within Elliott wave for flat corrections that states when a possible B wave is more than twice the length of the A wave, the idea of a flat should be discarded based upon a very low probability. That convention will be applied here to the triangle. At 2,500 intermediate wave (B) would reach twice the length of intermediate wave (A). A triangle should be discarded above that point.
HOURLY CHART
Click chart to enlarge.
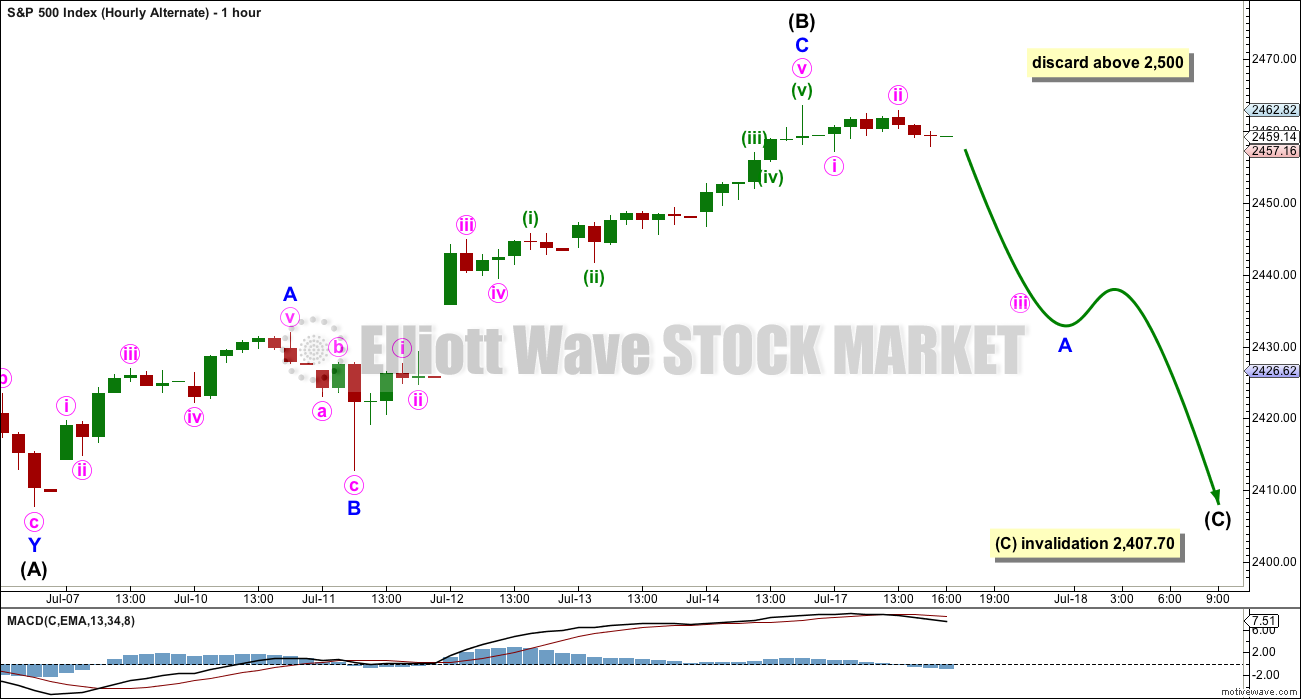
Intermediate wave (C) of a contracting triangle may not move beyond the end of intermediate wave (A) below 2,407.70. Although an expanding triangle would be valid, they are the rarest of Elliott wave structures. In my nine years of daily Elliott wave analysis I have only ever seen one structure which in hindsight was an expanding triangle. If price makes a new low here below 2,407.70, then another scenario would be considered.
TECHNICAL ANALYSIS
WEEKLY CHART
Click chart to enlarge. Chart courtesy of StockCharts.com.
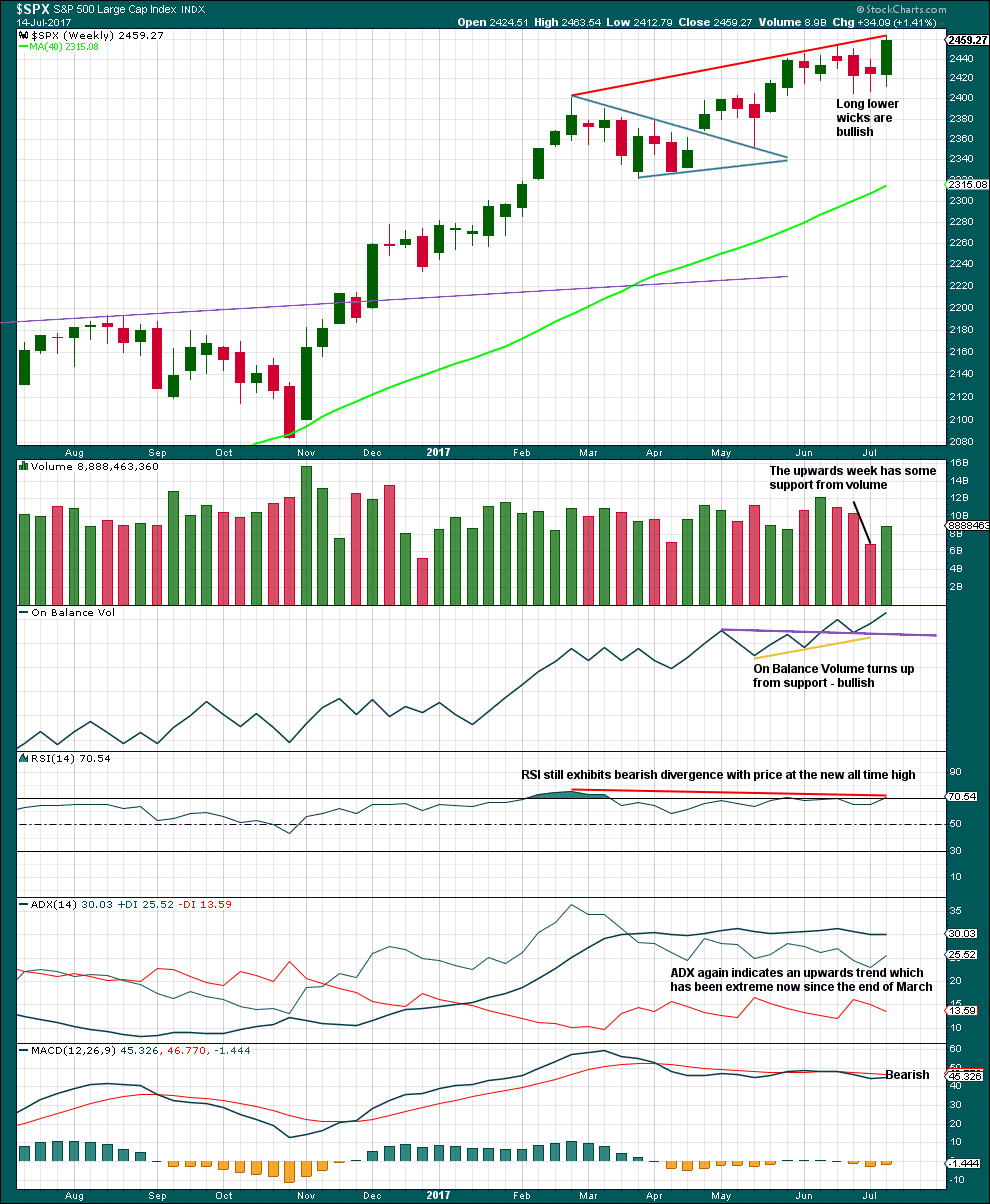
Candlesticks, volume, and On Balance Volume are bullish.
ADX, RSI and MACD are bearish.
Overall, give more weight to volume and On Balance Volume.
DAILY CHART
Click chart to enlarge. Chart courtesy of StockCharts.com.
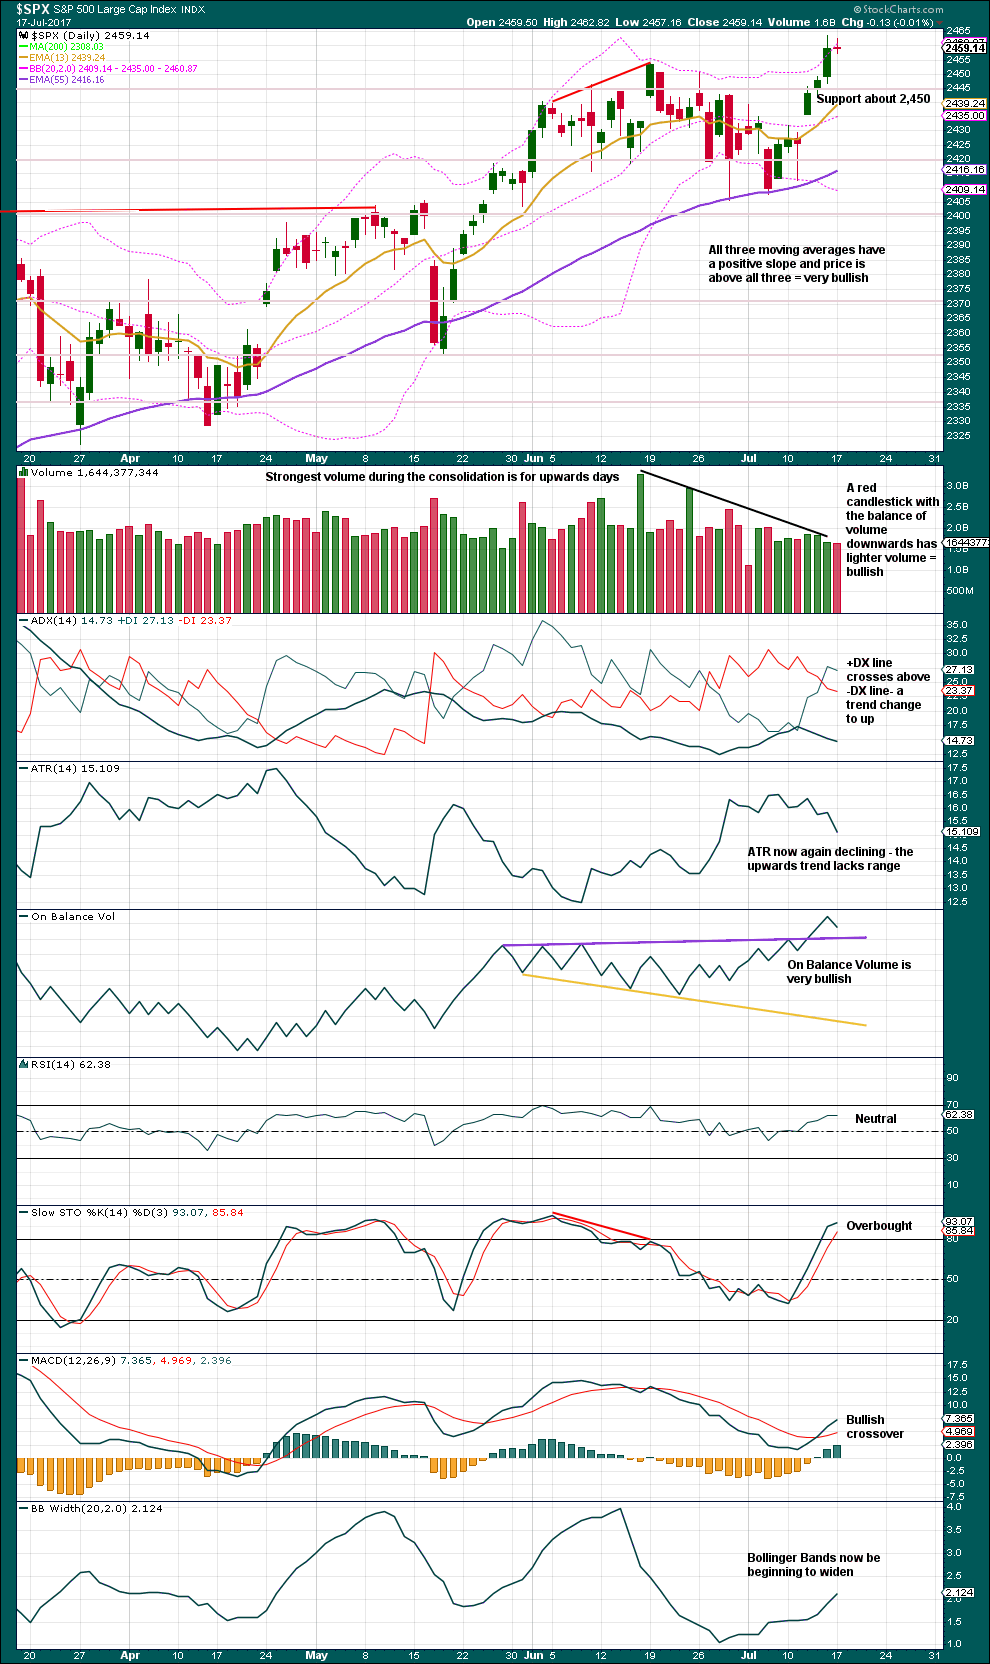
Look now for support about 2,450 for any pullbacks within this upwards trend.
On Balance Volume is very bullish. Give this more weight than other indicators. It correctly predicted the upwards breakout before it happened, as it so often does.
However, the breakout does not have support from volume, so it is suspicious. This signals that another pullback may come sooner rather than later.
A pullback here may be a typical curve around and down of price to find support at prior resistance about 2,450. That may be minute wave iv for the Elliott wave count.
On Balance Volume, ATR, ADX, MACD and Bollinger Bands are all bullish.
Volume today is very slightly bullish.
VOLATILITY – INVERTED VIX CHART
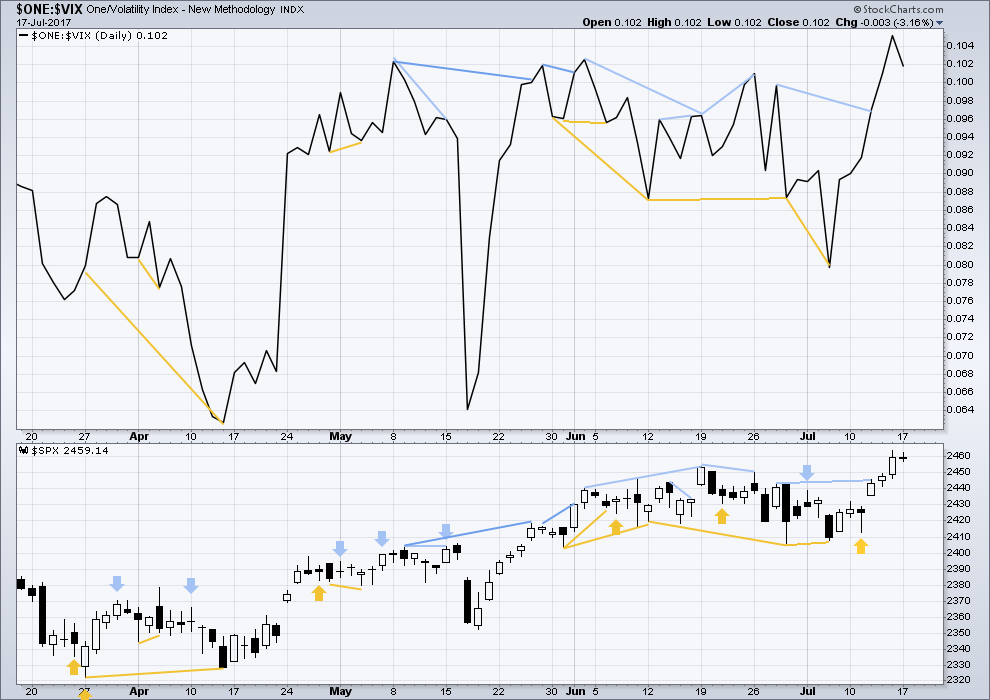
Click chart to enlarge. Chart courtesy of StockCharts.com.
Normally, volatility should decline as price moves higher and increase as price moves lower. This means that normally inverted VIX should move in the same direction as price.
There is no new divergence between price and inverted VIX.
BREADTH – AD LINE
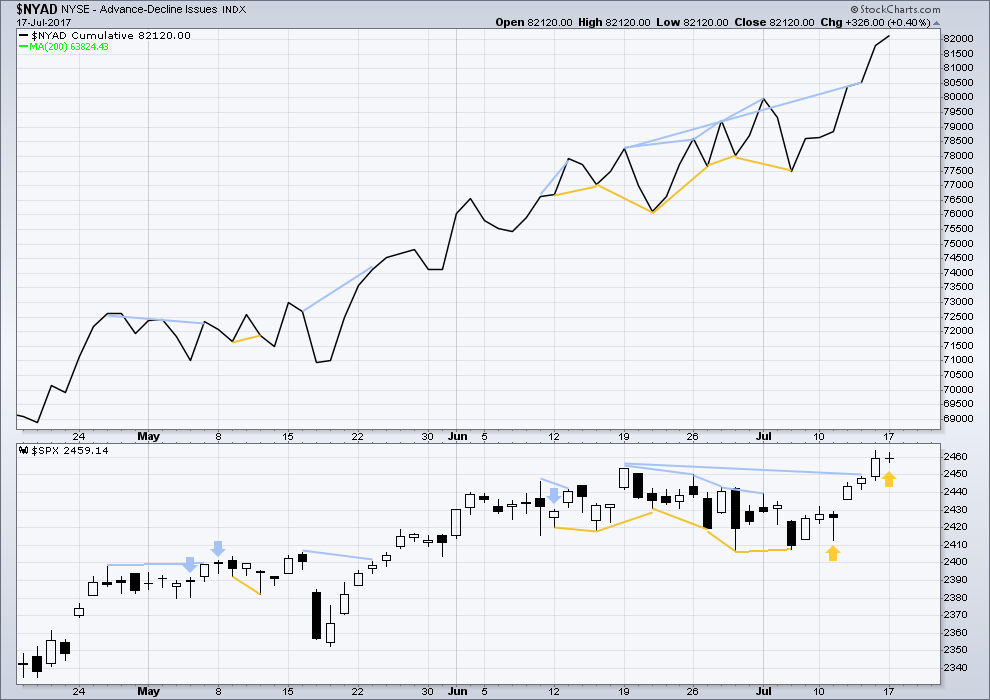
Click chart to enlarge. Chart courtesy of StockCharts.com.
With the last all time high for price, the AD line also made a new all time high. Up to the last high for price there was support from rising market breadth.
There is normally 4-6 months divergence between price and market breadth prior to a full fledged bear market. This has been so for all major bear markets within the last 90 odd years. With no divergence yet at this point, any decline in price should be expected to be a pullback within an ongoing bull market and not necessarily the start of a bear market.
There is new single day divergence today between price and breadth: an inside day closed red with a balance of volume downwards, but during the session price moved lower. This comes with an abnormal increase in market breadth. It is my interpretation that this divergence is bullish and indicates weakness today within downwards movement.
Lowry’s measures of internal market strength and health continue to show a healthy bull market. The rise in price comes with expanding buying power and contracting selling pressure, normal and healthy for a bull market, even an old one.
Historically, almost every bear market is preceded by at least 4-6 months of divergence with price and market breadth. There is no divergence at all at this time. This strongly suggests this old bull market has at least 4-6 months to continue, and very possibly longer.
DOW THEORY
The S&P500, DJIA and DJT have all made new all time highs.
Nasdaq still has not made a new all time high. Modified Dow Theory (adding in technology as a barometer of our modern economy) indicates some weakness at this time within the bull market, but there is zero indication that it is over. What is much more likely is that Nasdaq may too make a new all time high this week. If it does, the ongoing bull market will again be confirmed.
The following lows need to be exceeded for Dow Theory to confirm the end of the bull market and a change to a bear market:
DJIA: 17,883.56.
DJT: 7,029.41.
S&P500: 2,083.79.
Nasdaq: 5,034.41.
Charts showing each prior major swing low used for Dow Theory are here.
This analysis is published @ 08:13 p.m. EST.
Interesting that DJI and Transports not joining the new highs party. Transports down significantly, DJI failing to close open gap from Monday. Will it play catch up, or will the divergence persist? Transports my be leading the way….
Amazing. The S&P behaving itself with trend channels so far. Minuette (iv) ends almost perfectly on the lower edge of the Elliott channel and price bounces up from there.
Minute iii now to end at the target.
Then a multi day pullback (about 2-5 days) for minute wave iv. That may be the curve down to test support at prior resistance.
It’s taking it’s time folks, patience for a perfect set up at the end of minute iv to join the trend is what I’m going to apply.
Nasdaq less than ten points away from making its own new all time highs today. I am really hoping we get a blow-off move into the close so I can take the money and run. I am not at all enamored of holding long positions in this market over-night. I will probably cash in my calls and open a few more conservative put credit spreads a week out…let see how she closes….
These long lower wicks have of late been fairly reliable indicators of impending continuation upward price movement.
I think we may already be in minute four…
That was my very first thought when I opened the hourly chart this morning….
But then I looked at the daily and want now to label it minuette (iv)….
It is a beautiful thing Lara…as is your keen analysis! 🙂
(Already a nice profit in my positions today so I think I will hold them for the move up tomorrow)
Most eeeeexcellent….
(said like Mr Burns rubbing hands together)
Good opportunity to join upward trend with this morning’s small fourth wave pull-back. Loading SPY 245 calls this week’s expiration. Also adding DIA bull put spreads for fifth wave up.
Hi Lara. Re 2430.98. Is that the high on June 30?
If so I have it from many sources as 2432.71
It was actually an intra day point. I’ve taken it from the hourly chart.
Ta got it
Yikes! Bested again!
first again?
Fastest!