
Downwards movement was expected for Monday. This did not happen, but price has remained below the invalidation point on the hourly chart and at the end of Monday’s session has returned to within the channel.
Summary: A strong bullish signal today from On Balance Volume puts doubt on the main wave count. A new high above 2,439.17 would see confidence in the new alternate wave count. The target would then be 2,478.
A new low now below 2,405.70 would add confidence to the main wave count. At that stage, expect the pullback has not ended. The target would be 2,390 in the first instance.
New updates to this analysis are in bold.
Last monthly and weekly charts are here. Last historic analysis video is here.
MAIN ELLIOTT WAVE COUNT
WEEKLY CHART
Click chart to enlarge.
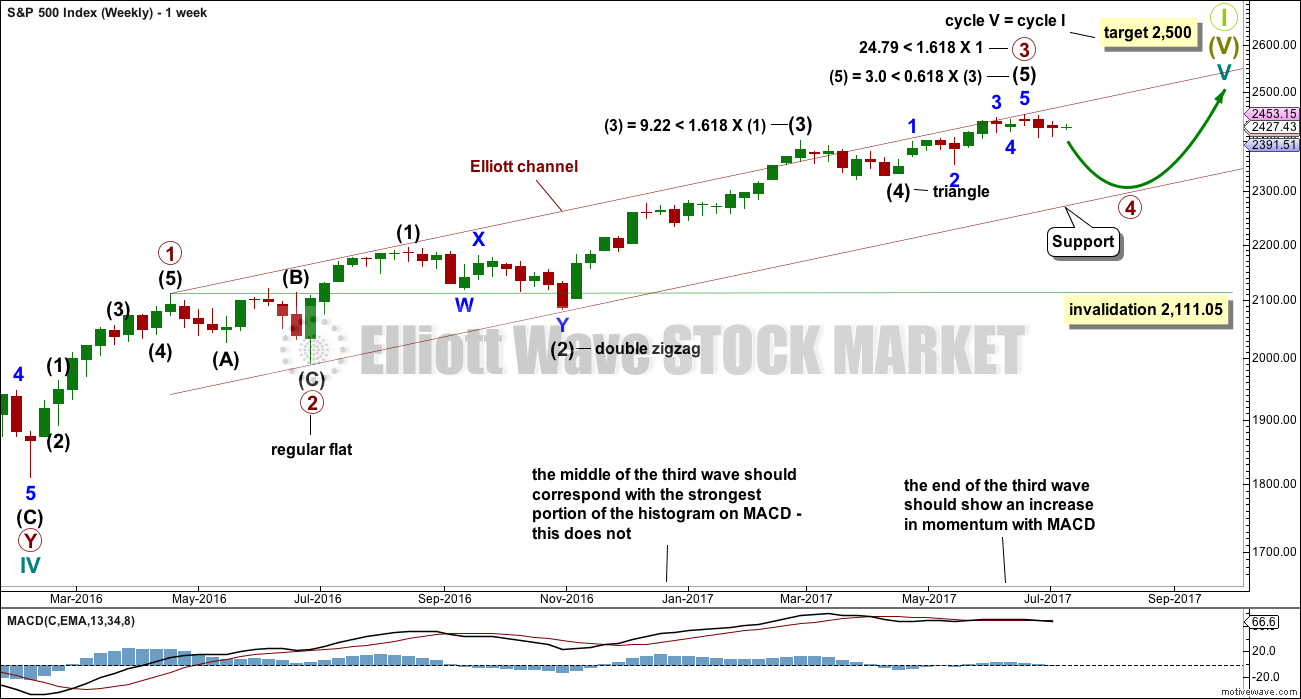
Primary wave 4 may now be underway.
Primary wave 2 was a regular flat correction that lasted 10 weeks. Given the guideline of alternation, primary wave 4 may most likely be a single or multiple zigzag or a triangle and may last about a Fibonacci eight or thirteen weeks, so that the wave count has good proportion and the right look. So far it has lasted only one week. This is far too brief to be considered complete or even close to complete.
Primary wave 4 may end within the price territory of the fourth wave of one lesser degree. Intermediate wave (4) has its range from 2,400.98 to 2,322.35.
Primary wave 4 may not move into primary wave 1 price territory below 2,111.05.
DAILY CHART
Click chart to enlarge.
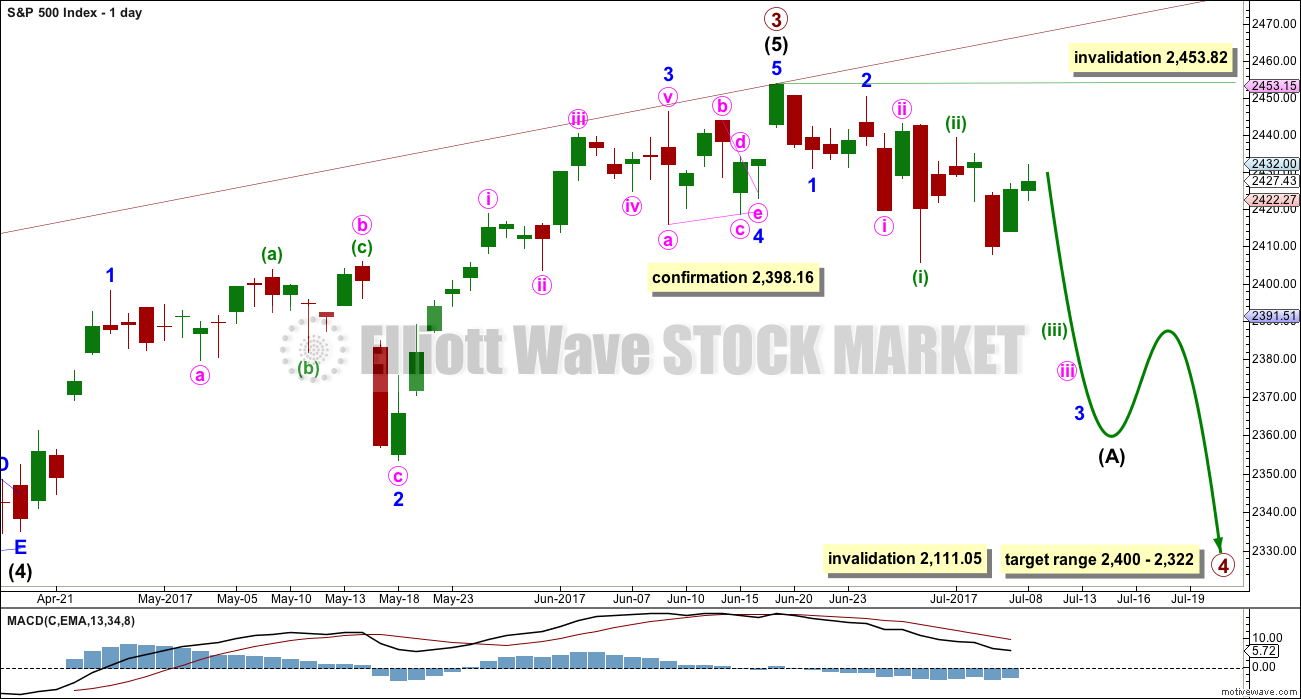
If primary wave 4 unfolds as the more common single or multiple zigzag, then it should begin with a five down at the daily chart level. This is incomplete.
If minor wave 2 is not over, and if it continues any higher (as per the alternate hourly wave count below), then it may not move beyond the start of minor wave 1 above 2,453.82.
When intermediate wave (A) is complete, then intermediate wave (B) should unfold higher or sideways for at least two weeks.
HOURLY CHART
Click chart to enlarge.
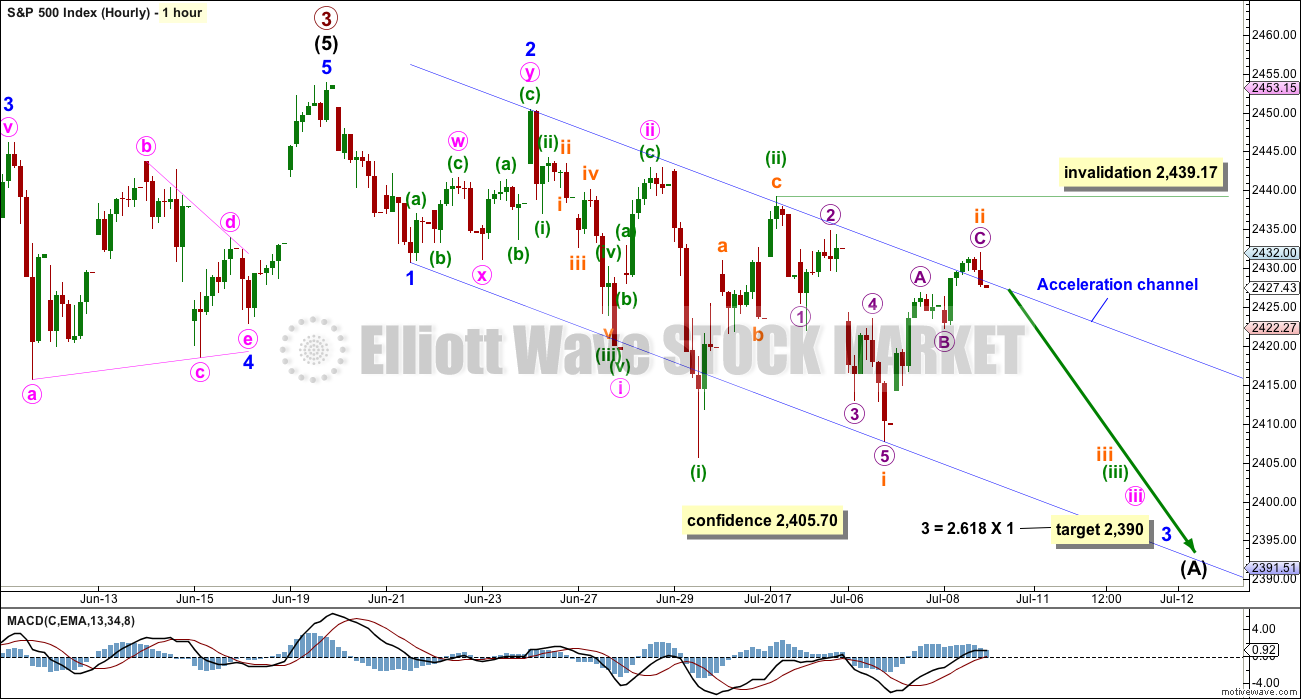
Draw the acceleration channel from the end of minor wave 1 to the last low, then place a parallel copy on the end of minor wave 2. The upper edge should provide resistance along the way down. This has not worked perfectly during Monday’s session, but the S&P just does not always fit neatly within channels. The small breach is acceptable now that price has returned to within the channel at the end of the session.
Keep redrawing the channel as price moves lower. When minor wave 3 is complete, then it will be an Elliott channel that shows where minor wave 4 may find resistance.
There are now four first and second waves complete.
This wave count expects now to see a strong increase in downwards momentum this week as the middle of a third wave passes. Fourth wave corrections should be shallow and must remain below their corresponding first wave’s territory.
At 2,392 minute wave iii would reach 1.618 the length of minute wave i.
A new alternate below would now be invalidated if price makes a new low below 2,405.70. At that stage, some confidence may be had in this main wave count.
ALTERNATE ELLIOTT WAVE COUNT
WEEKLY CHART
Click chart to enlarge.
This idea is new today.
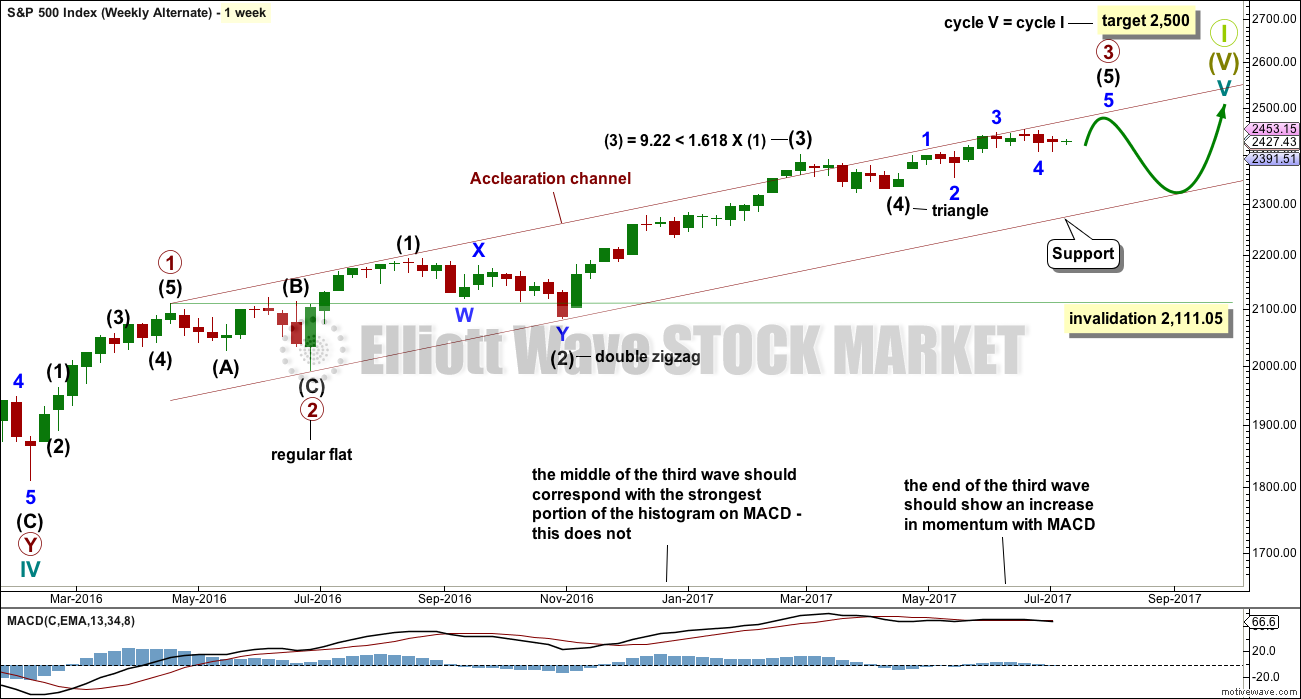
This wave count is identical to the main wave count up to the high labelled minor wave 3 within intermediate wave (5) within primary wave 3.
This alternate wave count sees primary wave 3 as incomplete, but close to completion.
Within primary wave 3 impulse, the final wave of intermediate wave (5) is seen as incomplete. Intermediate wave (5) is subdividing as an impulse.
When intermediate wave (5) is complete, then primary wave 3 would be complete. Primary wave 4 may not move into primary wave 1 price territory below 2,111.05.
DAILY CHART
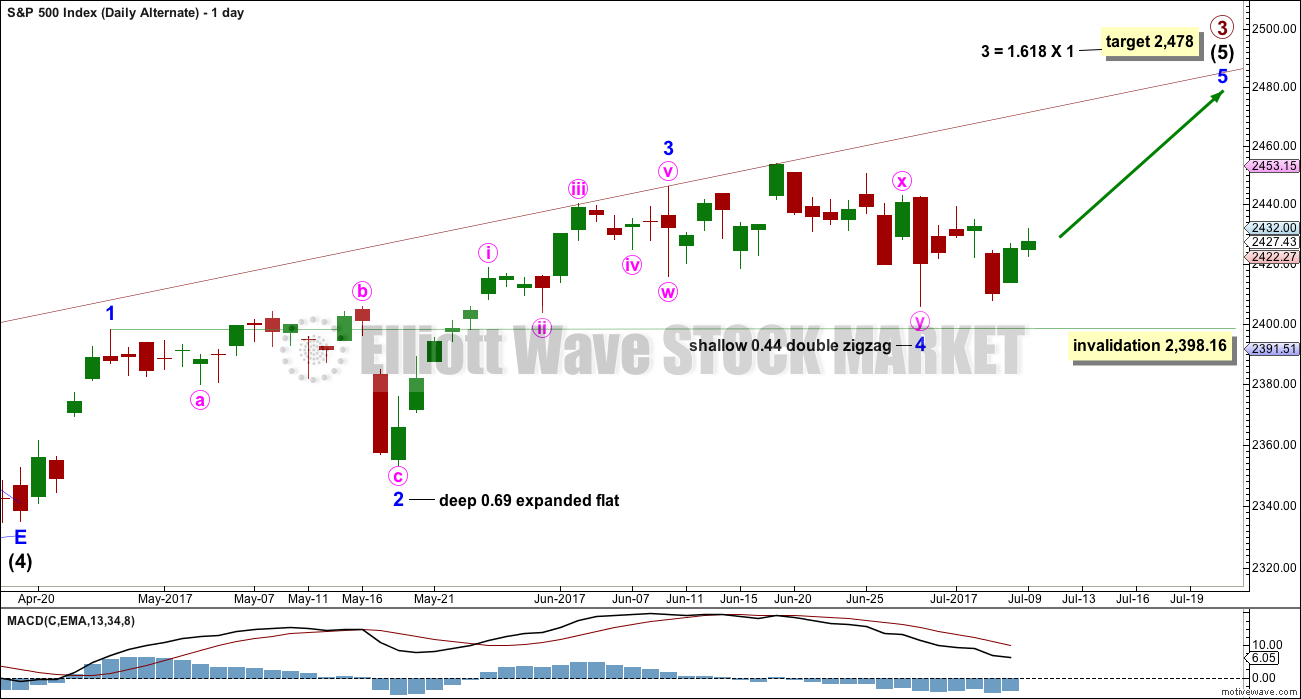
Click chart to enlarge.
The daily chart shows only the structure of intermediate wave (5); this structure is an impulse.
Within intermediate wave (5), the correction of minor wave 4 may not move into minor wave 1 price territory below 2,398.16.
There is perfect alternation between the deep expanded flat of minor wave 2 and the shallow double zigzag of minor wave 4.
HOURLY CHART
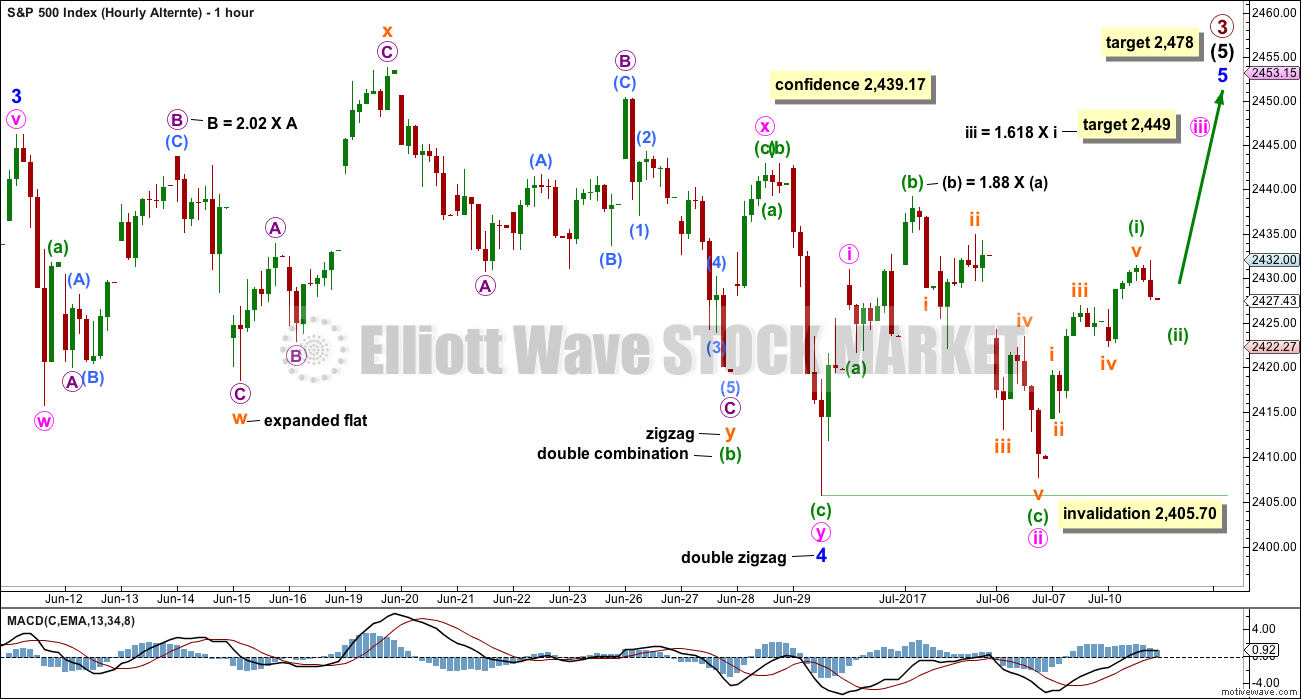
Click chart to enlarge.
Within the double zigzag of minor wave 4, the second zigzag labelled minute wave y has deepened the correction by 10 points; so it has achieved its purpose. Minor wave 4 does have a slight downwards slope even with the middle of it being mostly sideways movement. This is acceptable.
Within the expanded flat of subminuette wave w, micro wave B is slightly longer than the maximum convention of 2 times the length of micro wave A. This does not violate any Elliott wave rule, but it does reduce the probability of this wave count.
Some confidence may be had in this wave count if price makes a new high above 2,439.17. At that stage, expect it is more likely that price shall make new all time highs by the end of this week or next week.
This wave count expects to see an increase in upwards momentum.
Minute wave ii may not move beyond the start of minute wave i below 2,405.70.
TECHNICAL ANALYSIS
WEEKLY CHART
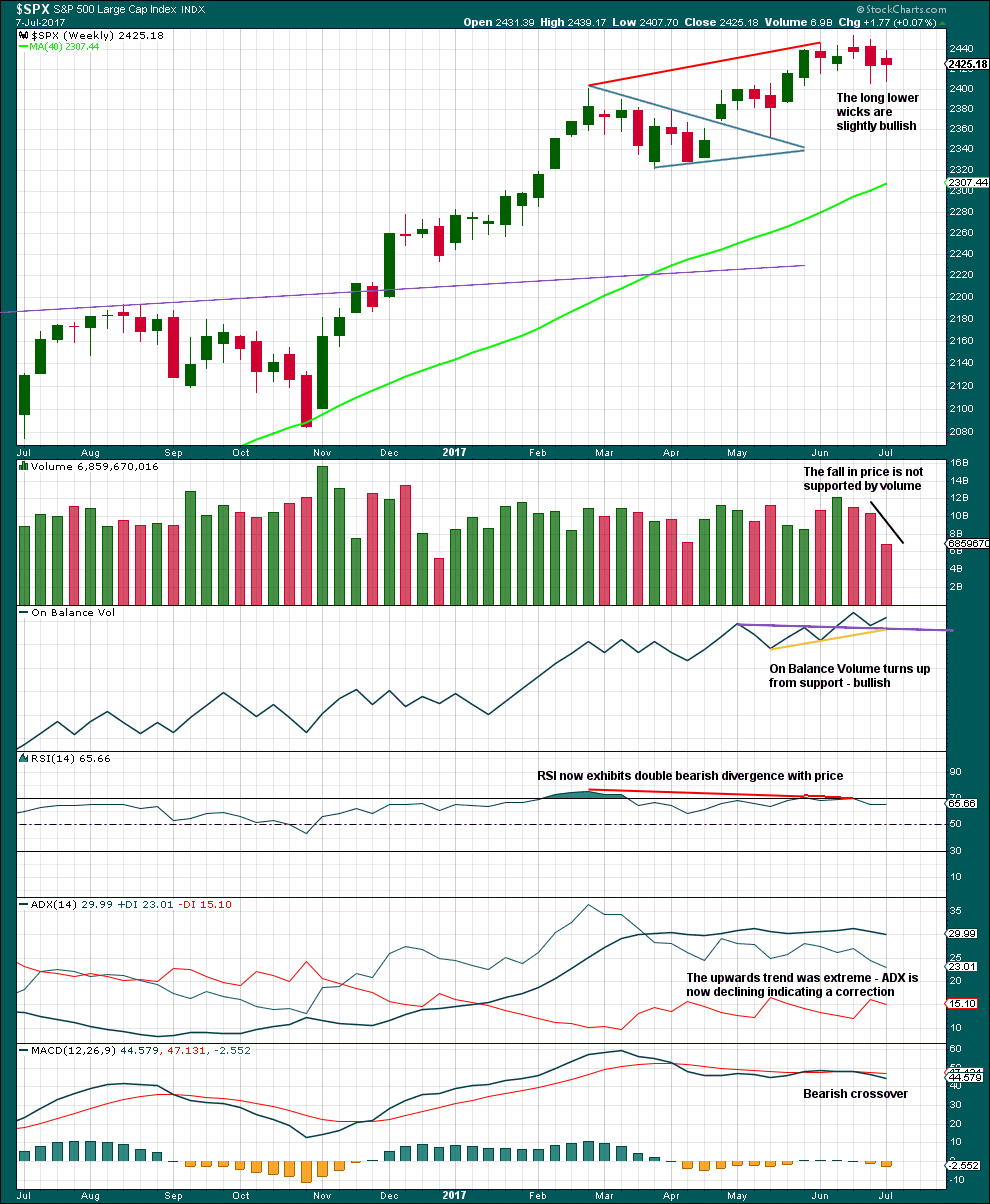
Click chart to enlarge. Chart courtesy of StockCharts.com.
Volume, candlesticks and On Balance Volume are bullish. This does not support the main Elliott wave count.
ADX, RSI and MACD still are bearish, and point to lower prices in the next few weeks.
DAILY CHART
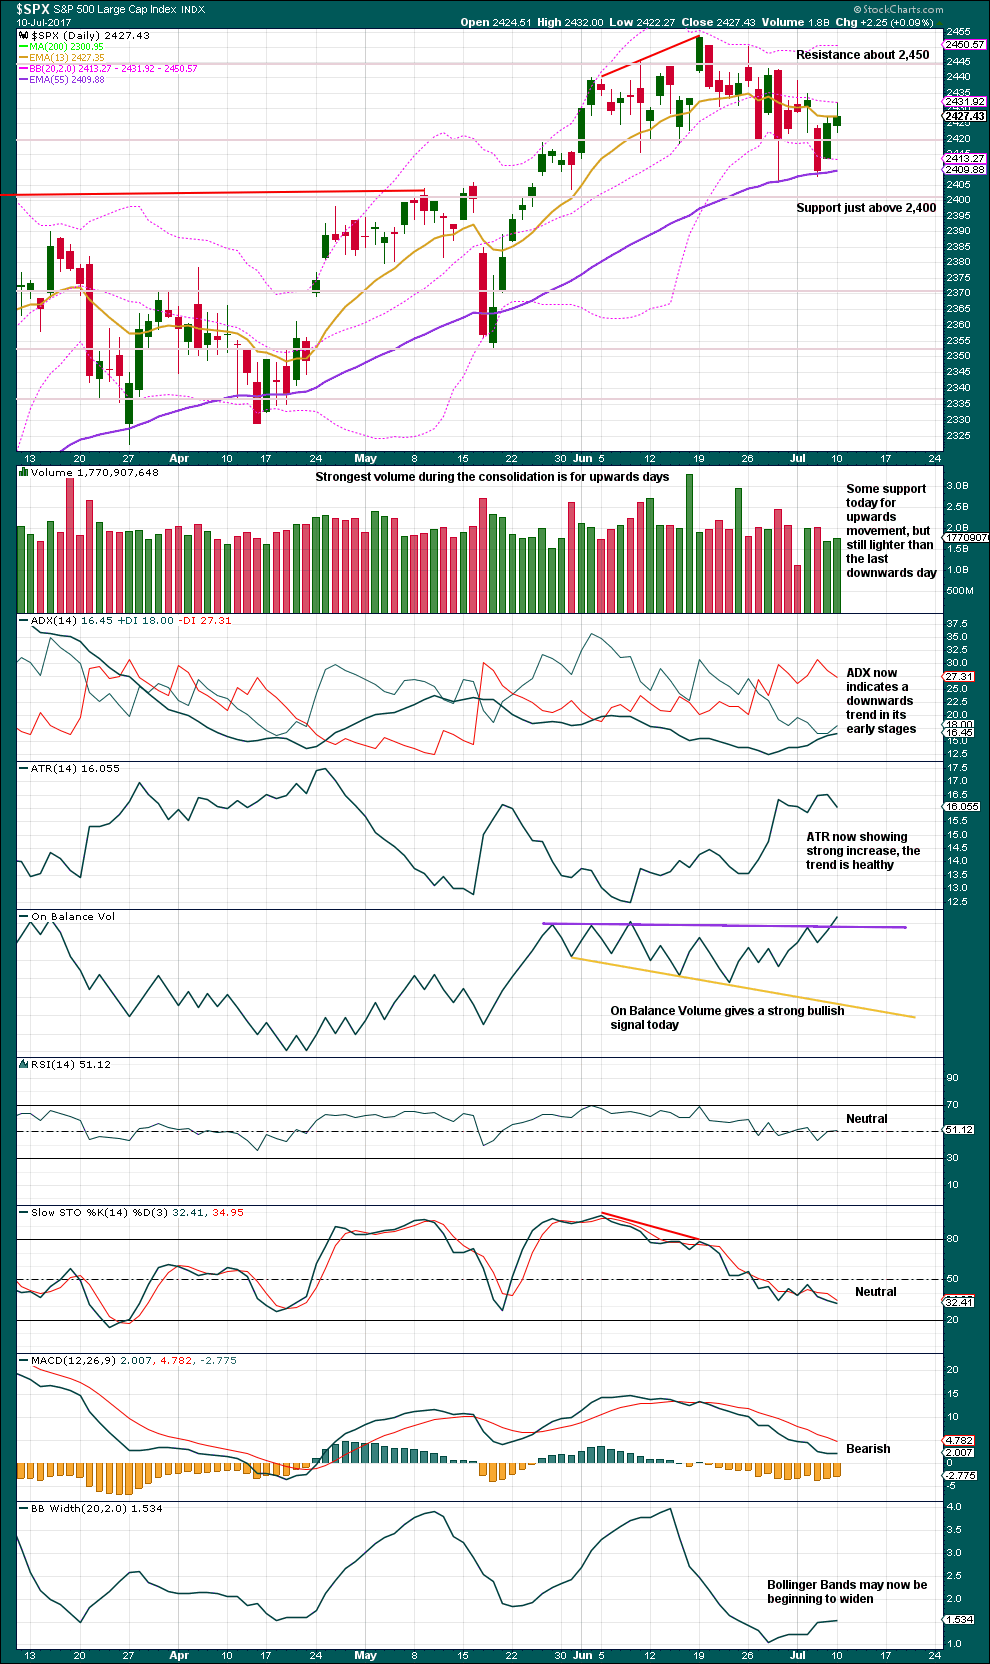
Click chart to enlarge. Chart courtesy of StockCharts.com.
The strong bullish signal from On Balance Volume today should be taken very seriously. Members with short positions are strongly advised to either exit or protect positions with stops. It is possible we may see new all time highs by the end of this week.
It looks like the pullback may be over at support from the Fibonacci 55 day moving average.
VOLATILITY – INVERTED VIX CHART
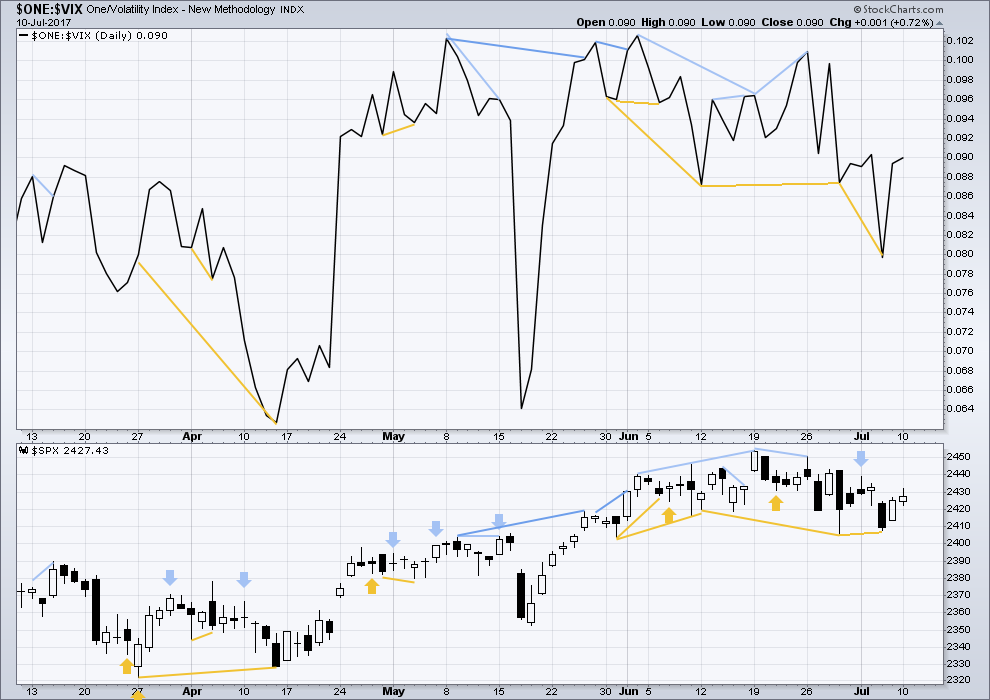
Click chart to enlarge. Chart courtesy of StockCharts.com.
Normally, volatility should decline as price moves higher and increase as price moves lower. This means that normally inverted VIX should move in the same direction as price.
Hidden bullish divergence noted after Thursday’s session has been followed by two upwards days. It may be resolved here.
There is no new divergence today between price and inverted VIX.
BREADTH – AD LINE
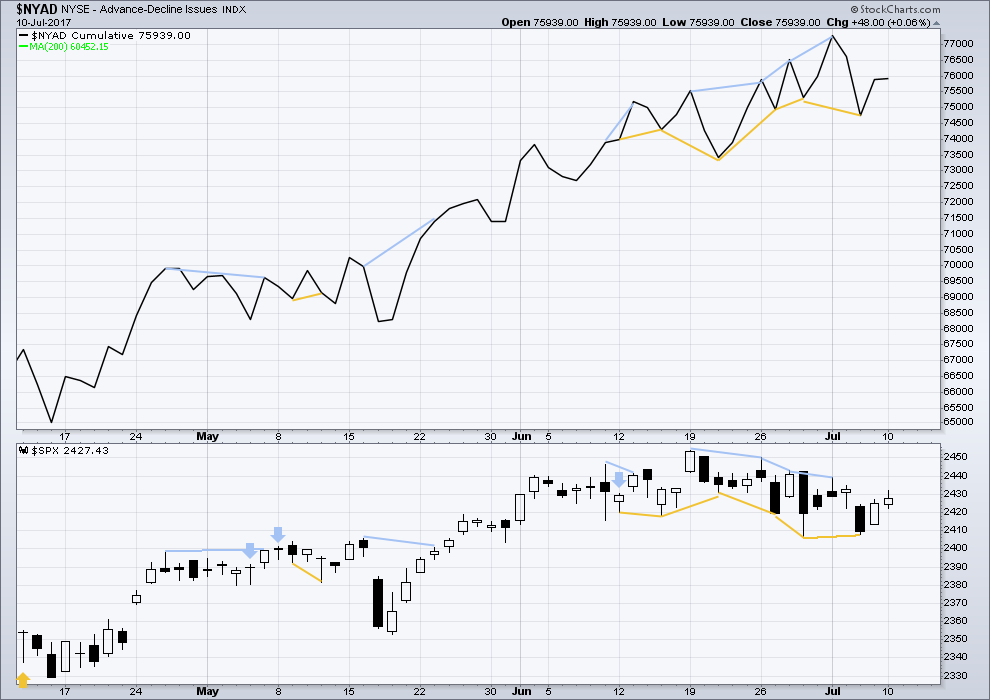
Click chart to enlarge. Chart courtesy of StockCharts.com.
With the last all time high for price, the AD line also made a new all time high. Up to the last high for price there was support from rising market breadth.
There is normally 4-6 months divergence between price and market breadth prior to a full fledged bear market. This has been so for all major bear markets within the last 90 odd years. With no divergence yet at this point, any decline in price should be expected to be a pullback within an ongoing bull market and not necessarily the start of a bear market.
Hidden bullish divergence noted after Thursday’s session has now been followed by two upwards days. It may now be resolved here.
There is no new divergence today between price and the AD line.
The mid caps and small caps have made new all time highs along with recent last all time high for large caps. The rise in price is seen across the range of the market, so it has internal strength.
While the market has moved sideways for about a month now, it has been accompanied by new highs in market breadth and improving underlying health as measured by Lowry’s buying power and selling pressure. This sideways correction should be expected to be a normal consolidation within an ongoing healthy bull market.
Historically, almost every bear market is preceded by at least 4-6 months of divergence with price and market breadth. There is no divergence at all at this time. This strongly suggests this old bull market has at least 4-6 months to continue, and very possibly longer.
DOW THEORY
The DJT today has finally made a new all time high. This confirms a continuation of the bull market.
Nasdaq still has not made a new all time high. Modified Dow Theory (adding in technology as a barometer of our modern economy) indicates some weakness at this time within the bull market, but there is zero indication that it is over.
The following lows need to be exceeded for Dow Theory to confirm the end of the bull market and a change to a bear market:
DJIA: 17,883.56.
DJT: 7,029.41.
S&P500: 2,083.79.
Nasdaq: 5,034.41.
Charts showing each prior major swing low used for Dow Theory are here.
This analysis is published @ 11:30 p.m. EST.
That SPX chart today is uber freaky. I just got done taking a long look at it on the 15 min chart and that spike down and immediate movement up off this morning’s low is really ghoulish in how un-natural and contrived it looks. Machines at work?
It is, as I opined, beacoup freakish.
I’ve got a bad feeling about this… 🙂
Lara, is it possible that wave 4 could be unfolding as a zig zag-x-triangle?
I might be wrong on this, but it seems to me that a triangle cannot be the terminal structure in a larger structure. In this case it would be the Y wave in a W-X-Y correction.
Lara?
according to elliott ” A triangle always occurs in a position prior to the final actionary wave in the pattern of one larger degree…..A triangle may also occur as the final actionary pattern in a corrective combination…
I think there is some sort of triangle being formed and I expect the move out of it to be sharp. I picked up a few bullish put spreads to hedge my open order in the event of a thrust up out of this sideways movement which could come tomorrow. I seriously doubt we are in a third wave down with the kind of over-lapping price action we are seeing, despite the sharp move down this morning. SPX 2420 remains intact and the longer that remains the case, the more likely an upside resolution it seems to moi.
Ahhh… good clarity on this. Thank you!
You guys are awesome. You’ve answered your own question.
In short, yes. It could be a triangle for Y.
For the alternate you have to see minor 3 ending earlier though, on the high of 9th July.
If you try and see minor 3 ending later, then the lows of the 9th of July and also the 15th of July are overlapping into minute i price territory. Chart attached.
So my exercise for the structure of minor 4 can’t begin there.
Let’s see if we can take out this morning’s lows and then 2400 on high volume. I am still waiting for Mr. market to show his hand.
Nice move down but it still did not pierce the 2400 shelf. Until it does nothing but sound and fury…could be C of an ABC corrective move as long as it stays above 2400 methinks…
Some risk parity, short vol, and smart beta funds are very near to their breaking point. The short covering on the VIX is going to be fun to watch.
The ability of the big indexes to produce that sharp a V in that short a time frame highlights how broken and near the ending the market is.
Exactly. That was no thinly traded instrument taking that kind of dive. Frankly that is the kind of thing that has me really worried; and could be an indication of how this thing is going to be ultimately resolved.
Yeah, I spoke with a few Financial Advisors today who invested in our AI Fund, and they were concerned that the next down turn would be so violent that they’d be out of business. Their clients are unhappy if they’re in a model that didn’t do as well as the index, and they’re unhappy if they’re on the sidelines in Money Market funds, waiting for a better buying opportunity. Either way it highlights the emotional state; this is exactly what was being said in 2007 when I just started. Same as it ever was…….
I could not in good conscience be responsible for funds in this market that were not fully hedged against some serious downside potential. I am curious if these guys employ stop losses and how tightly they apply them, especially in the current environment. I find it hard to believe that these guys care only about transaction fees as they indeed are likely to loose their client base with the kinds of decline we would see in a bear market, unless of course they were fully hedged against that eventuality.
Interesting exchange between Verne and Chris because I am a financial advisor who does financial planning and investment management. I trade SPX index spreads for my own account and cannot do that for clients.
You’re both right about clients wanting to be along for the ride when the markets are going up but are heedless of caution to protect against downturns. So I force them to be cautious. We don’t try to beat the market because no one can do that consistently. Instead, we determine their personal target rate of return and strive to meet that target.
As for hedging, that’s impossible to do. Our approach is to allocate sufficiently to the best tools at hand which are guaranteed investments such as bonds and annuities.
By the way, one of the largest positions in our book of business is WATER. Almost every one of our clients owns an ETF of the Water industry. We’ve been buying this ETF since 2008 and it has been a consistent winner. You can live without oil and gas … but not without water.
Okay, I’ll shut up now….
Thanks for the comments Lance. I did remember reading about the limitations on the kinds of trades that Advisors can make for their clients and always thought it somewhat strange that retail investors would not have all the available hedging tools at their disposal.
A friend of mine told me a few weeks ago that he had sold everything and put his entire stake in the fab five in the Nasdaq. I saw him shortly after that nasty June 9 candle and he was still fully invested. Yikes!
Speaking of water, I have been quite surprised at how far PICO has fallen from its 2008 highs but I think it is headed back in that direction. I think it is one of today’s most under-valued stocks.
Yeah baby! 🙂
Something is definitely starting to smolder…
Here’s the way I am trading the new count. I am selling to open, the August 248/250 bear call spread with a bid limit that expects to get filled when SPX gets reasonably close to the upside target of 2478. The current bid/ask on the spread is 27/29 and my limit is 0.50
I anticipate the reversal at the end of minor five up will be decisive and the first impulse down of a trend change at that degree will summarily take out the 2400 pivot.
Also nibbling on SPY 244 July 21 calls at market with a buy stop at SPX 2440
The alternate explains the price action perfectly and has my vote!
I agree Verne. I feel minor wave 4 in preferred is too short – didn’t “look “right compared to minor 2.
I was hesitating re the length of 4 in the new alternate but 4s can be longer than 2s and is far easier to allow than the look of the very short 4.
Good job Lara
Thank you very much Peter and Verne.
I’m going to take that signal from OBV very seriously. It looks like we shall see new ATHs this week now.