
Last analysis concluded the situation was unclear for the short term. A smaller range inside day mostly fits expectations. Upwards movement during Friday’s session remains well below the invalidation point on the hourly chart.
Summary: Expect now a multi week to multi month pullback has begun. The target zone for it to end is about 2,400 to 2,322.
Short term bearishness in classic technical analysis this week supports the main Elliott wave count. The short term target is at 2,390.
If choosing to trade this correction, remember to always use a stop and invest only 1-5% of equity on any one trade. Less experienced members should reduce equity to only 1-3%.
New updates to this analysis are in bold.
Last monthly and weekly charts are here. Last historic analysis video is here.
MAIN ELLIOTT WAVE COUNT
WEEKLY CHART
Click chart to enlarge.
Price has indicated that this should be the main wave count.
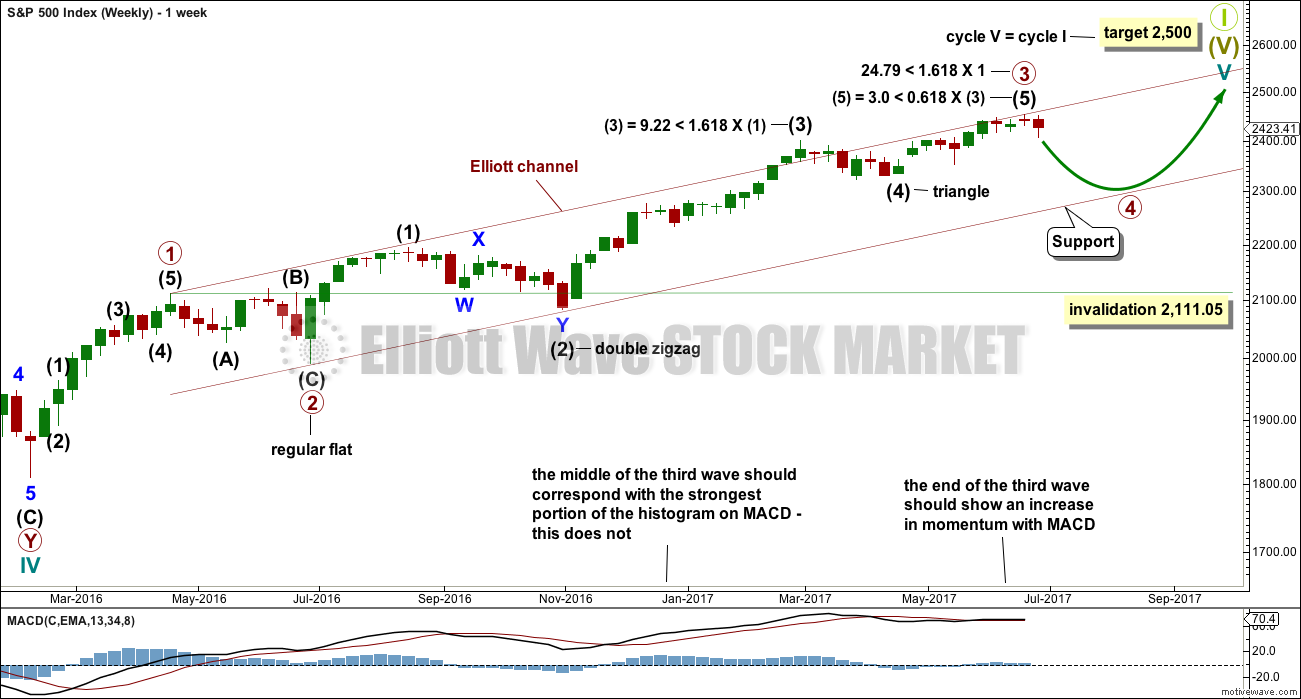
Primary wave 4 may now be underway.
Primary wave 2 was a regular flat correction that lasted 10 weeks. Given the guideline of alternation, primary wave 4 may most likely be a single or multiple zigzag or a triangle and may last about a Fibonacci eight or thirteen weeks, so that the wave count has good proportion and the right look. So far it has lasted only one week. This is far too brief to be considered complete or even close to complete.
Primary wave 4 may end within the price territory of the fourth wave of one lesser degree. Intermediate wave (4) has its range from 2,400.98 to 2,322.35.
Primary wave 4 may not move into primary wave 1 price territory below 2,111.05.
DAILY CHART

Click chart to enlarge.
If primary wave 4 unfolds as the more common single or multiple zigzag, then it should begin with a five down at the daily chart level. This is incomplete.
So far minor waves 1 and 2 may be complete. Minute wave ii may not move beyond the start of minute wave i above 2,450.42.
When intermediate wave (A) is complete, then intermediate wave (B) should unfold higher or sideways for at least two weeks.
HOURLY CHART
Click chart to enlarge.
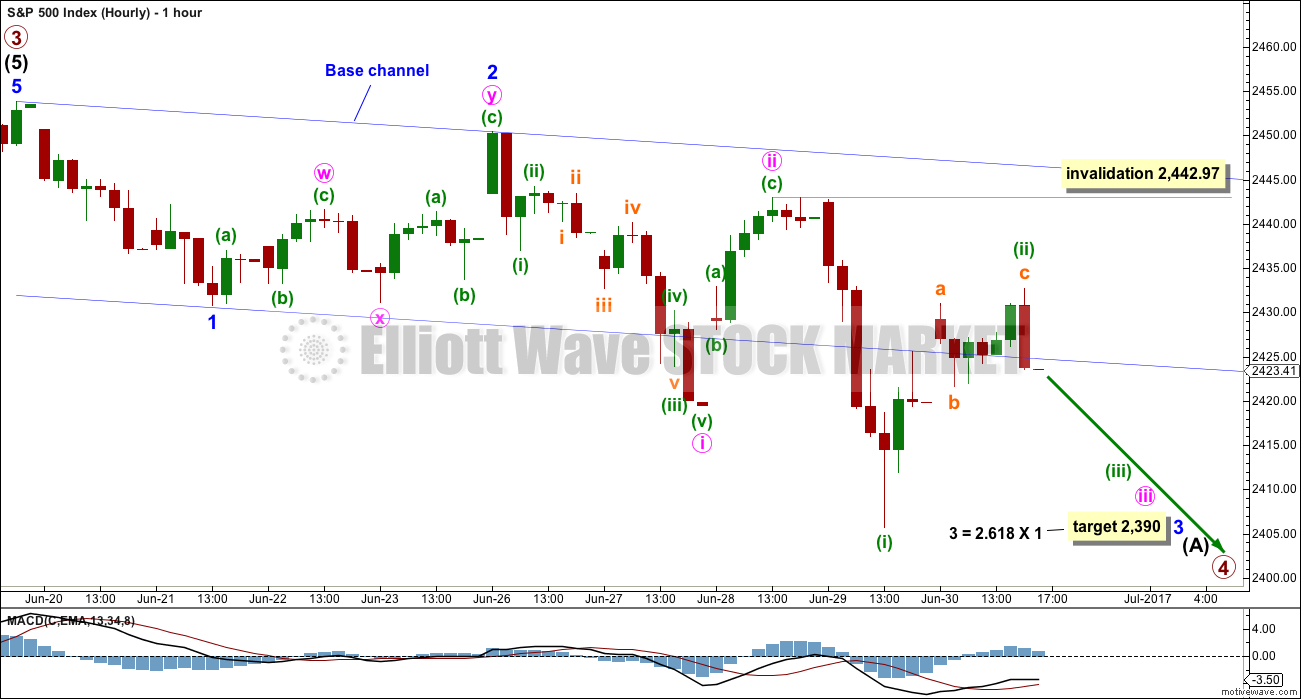
Price again moved back to within the base channel during Friday’s session. Minuette wave (ii) is another very deep correction.
There are now three overlapping first and second waves downwards. This indicates an increase in downwards momentum should happen next week, if this wave count is correct.
Minuette wave (ii) may not move beyond the start of minuette wave (i) above 2,442.97.
At 2,392 minute wave iii would reach 1.618 the length of minute wave i.
ALTERNATE ELLIOTT WAVE COUNT
WEEKLY CHART
Click chart to enlarge.
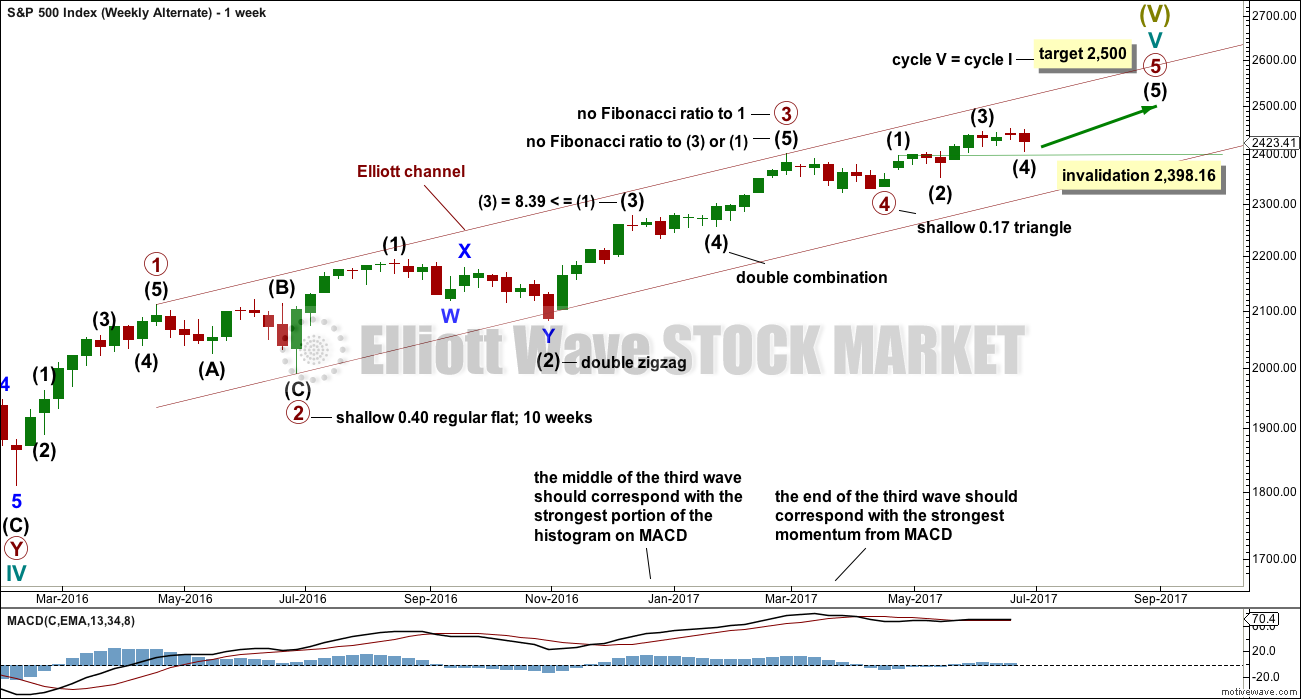
This wave count is an unlikely alternate.
Primary wave 3 may be complete. Primary wave 5 may be close to an end. Within primary wave 5, intermediate wave (4) may not move into intermediate wave (1) price territory below 2,398.16.
DAILY CHART
Click chart to enlarge.
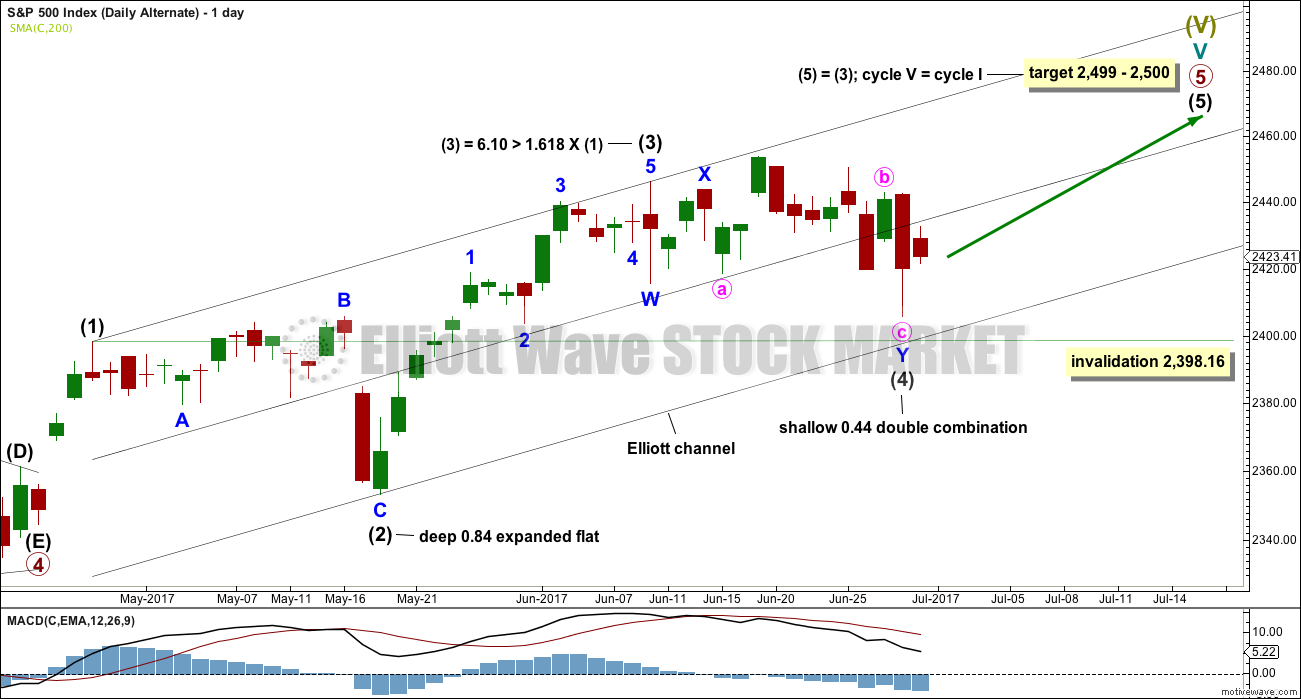
It is possible now for this alternate that intermediate wave (4) is now complete. There is alternation in depth between intermediate waves (2) and (4), but inadequate alternation in structure; they look very similar.
This alternate wave count still does not allow for enough time for market breadth to diverge from price before the final high. This is very unlikely.
HOURLY CHART
Click chart to enlarge.
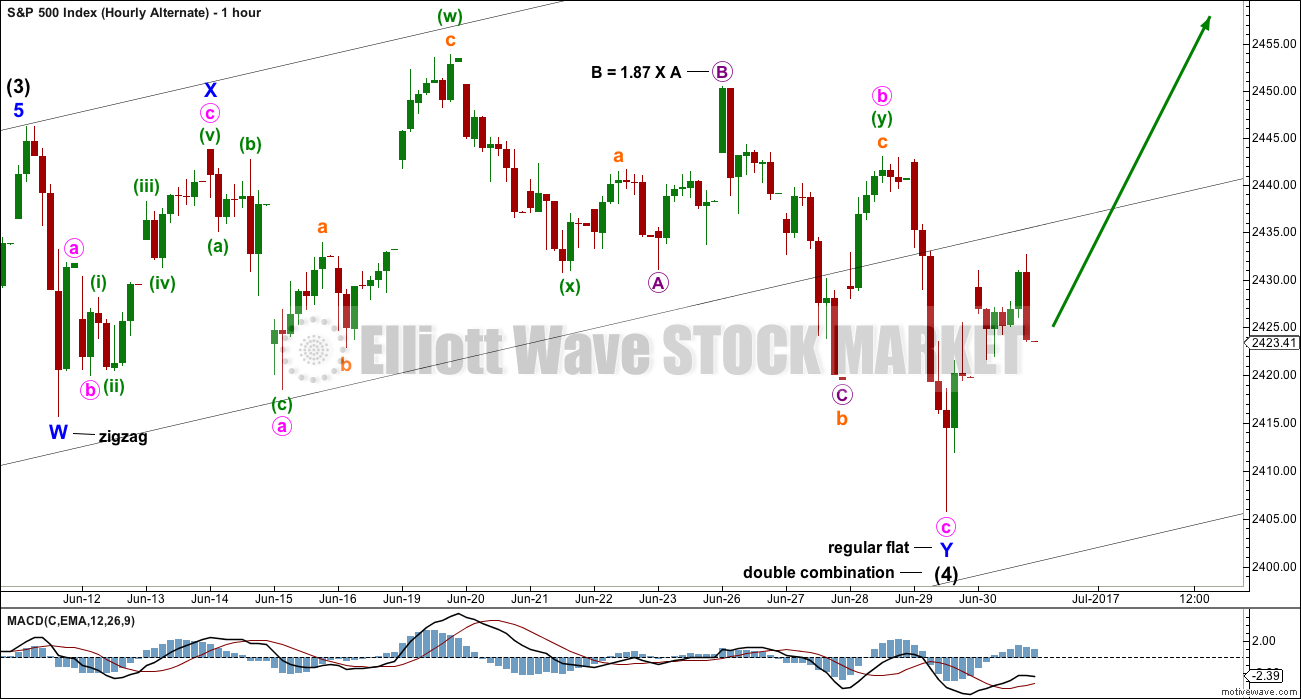
This hourly chart is presented to show the subdivisions of intermediate wave (4).
TECHNICAL ANALYSIS
WEEKLY CHART
Click chart to enlarge. Chart courtesy of StockCharts.com.
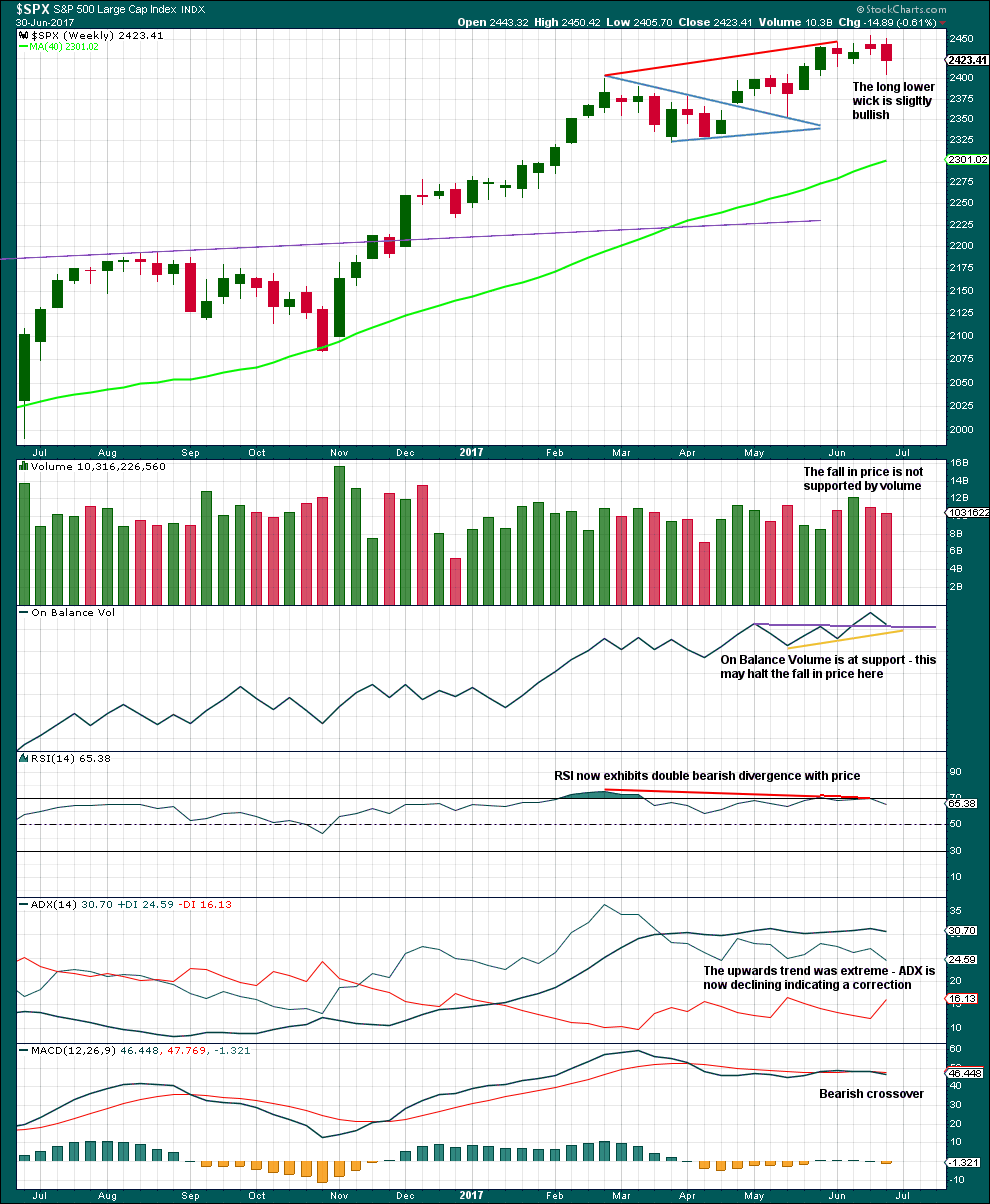
Volume and On Balance Volume this week suggest upwards movement from here. But the purple trend line for On Balance Volume has only been tested twice before, so its significance is only weak.
ADX, RSI and MACD this week point to lower prices in the next few weeks.
DAILY CHART

Click chart to enlarge. Chart courtesy of StockCharts.com.
2,420 is still offering support.
A smaller range inside day looks like a small pause after the bullishness of the long lower wick on Thursday’s candlestick.
Volume and On Balance Volume suggest for the short term lower prices next week.
Overall, this chart is predominantly bearish and supports the Elliott wave count.
VOLATILITY – INVERTED VIX CHART
Click chart to enlarge. Chart courtesy of StockCharts.com.
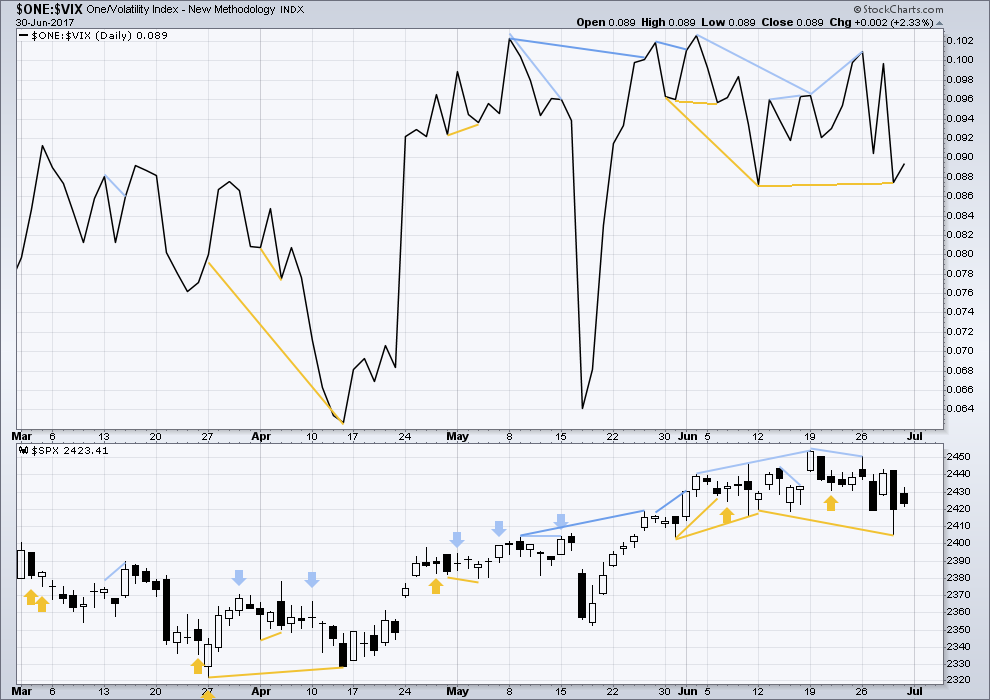
Normally, volatility should decline as price moves higher and increase as price moves lower. This means that normally inverted VIX should move in the same direction as price.
Short term bullish divergence noted in last analysis has now been followed by a day with the balance of volume upwards. It may be resolved here, or it may need one more upwards day to resolve it.
BREADTH – AD LINE
Click chart to enlarge. Chart courtesy of StockCharts.com.
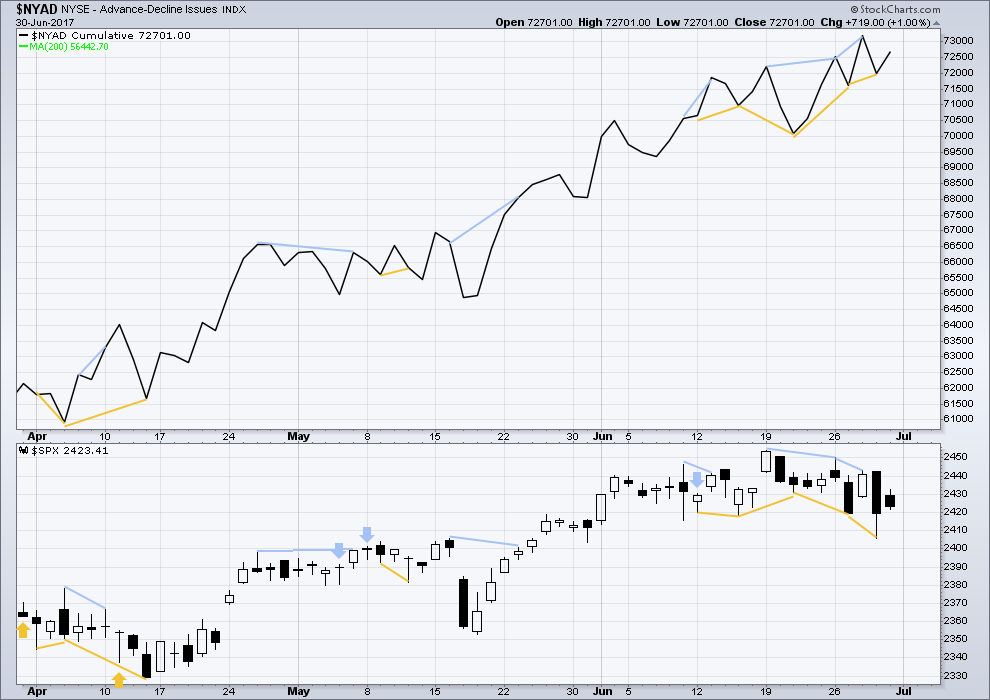
With the last all time high for price, the AD line also made a new all time high. Up to the last high for price there was support from rising market breadth.
There is normally 4-6 months divergence between price and market breadth prior to a full fledged bear market. This has been so for all major bear markets within the last 90 odd years. With no divergence yet at this point, any decline in price should be expected to be a pullback within an ongoing bull market and not necessarily the start of a bear market.
Bullish divergence noted in last analysis has now been followed by one day with a balance of volume upwards. It may be resolved here, or it may need one more upwards day to resolve it.
The mid caps and small caps have made new all time highs along with recent last all time high for large caps. The rise in price is seen across the range of the market, so it has internal strength.
However, there is now some weakness becoming evident within small and mid caps. The number of equities down 20% or more from their all time highs is greatest in small caps, next in mid caps, and least in large caps. This is only an early sign of weakness developing.
Historically, almost every bear market is preceded by at least 4-6 months of divergence with price and market breadth. There is no divergence at all at this time. This strongly suggests this old bull market has at least 4-6 months to continue, and very possibly longer.
DOW THEORY
At the end of last week, DJIA and the S&P500 have all made new all time highs. DJT and Nasdaq last week did not make new all time highs. However, at this stage, that only indicates some potential weakness within the ongoing bull market and absolutely does not mean that DJT and Nasdaq may not yet make new all time highs, and it does not mean a bear market is imminent.
The following lows need to be exceeded for Dow Theory to confirm the end of the bull market and a change to a bear market:
DJIA: 17,883.56.
DJT: 7,029.41.
S&P500: 2,083.79.
Nasdaq: 5,034.41.
Charts showing each prior major swing low used for Dow Theory are here.
This analysis is published @ 11:08 p.m. EST on 1st July, 2017.
Minuette (ii) must be continuing higher. Now I can’t see it as a complete structure, it looks like it needs a new high to complete a double zigzag.
TBH now it’s starting to look a bit too deep and a bit too time consuming.
Going to look for an alternate explanation of today’s thrust higher.
Short trading day today with market closed at mid-day.
Hi Lara; I was wondering if the new DJI ATH will materially affect our expectations for the current SPX wave count. I think I already know the answer…. 🙂
Nope 🙂
That’s what you thought, right?
DJT has finally made a new ATH today too. That adds confidence that the bull market continues, via Dow Theory.
That doesn’t mean we can’t see a primary degree correction here. Bull markets have corrections, some of them time consuming.
Yep! 🙂
It is the stuff of very tall tales, yet remarkably is front and center of news reporting today.
I recently mentioned Argentina’s 100 year bond offering and wondered who would buy.
Zero Hedge has reported that the float was 3.5X over subscribed. This is truly head spinning. Consider the following fact: There has been not one single 20 year span in the country’s history that it has not defaulted! How doesn a 100 yr bond offering by a country with this kind of track record garner a 3.5X oversubscription?!
I would require a yield of 100% to even consider such an offering, and would probably still walk away. Global finance and central banks have now entered an era of stark raving madness!
Yep, madness.
Thanks for that bit of info Verne.
Looks like greed to me.
What is truly sad about this is the money managers and other cohort buying this issue (no doubt rated investment grade) are probably using other people’s money, (think pension funds) knowing fully well what the risks are. But hey, at least they will get their transaction commissions up front…
While I’m not defending the money managers, the public is to blame as well. Most of today volumes come from passive/etf managers who’s hands are forced by a public who demands low fees and market performance. Whether it’s auto abs, student loans, Argentinian bonds, or TSLA stock, these folks are forced to put capital to work indescriminately, as that’s what their constituents demand.
I can understand the desire for a reasonable roi. I can even understand the pressure to chase yield, but Argentina??!!!
And 100 years??!!. That is not just reckless. It is INSANE!
Next will be offerings from Puerto Rico and Illinois… 🙂
Haha, followed by NJ, MA, CT and CA. As the great Margaret Thatcher once said; “Eventually you run out of other peoples money….”
A judge in Chicago just ordered the state to increase its pay-down of back-logged medicare bills from 160.00 million per month to 586.00 million per month. Rumors are already swirling that State pension recipients- policemen, firemen, teachers, state employee retirees etc.(and yes! Politicians!!) should brace themselves for a 70% reduction in their benefits. Think about it! If you got a retirement check of 1000.00 per month that would be reduced to 300.00. This is not without precedent entirely, although on a smaller scale when it happened to Detroit. First time for an entire State! As Chris pointed out, probably not the last…
I’ll claim first this week.