
The Elliott wave count expected a continuation of a sideways correction. Price remains range bound. For the short term price was expected to move lower, which has happened.
Summary: Expect a sideways consolidation to continue into next week as well. When it is done, it should offer a good entry point to join the longer term upwards trend.
New updates to this analysis are in bold.
Last monthly and weekly charts are here. Last historic analysis video is here.
MAIN ELLIOTT WAVE COUNT
WEEKLY CHART
Click chart to enlarge.
This wave count has a better fit with MACD and so may have a higher probability.
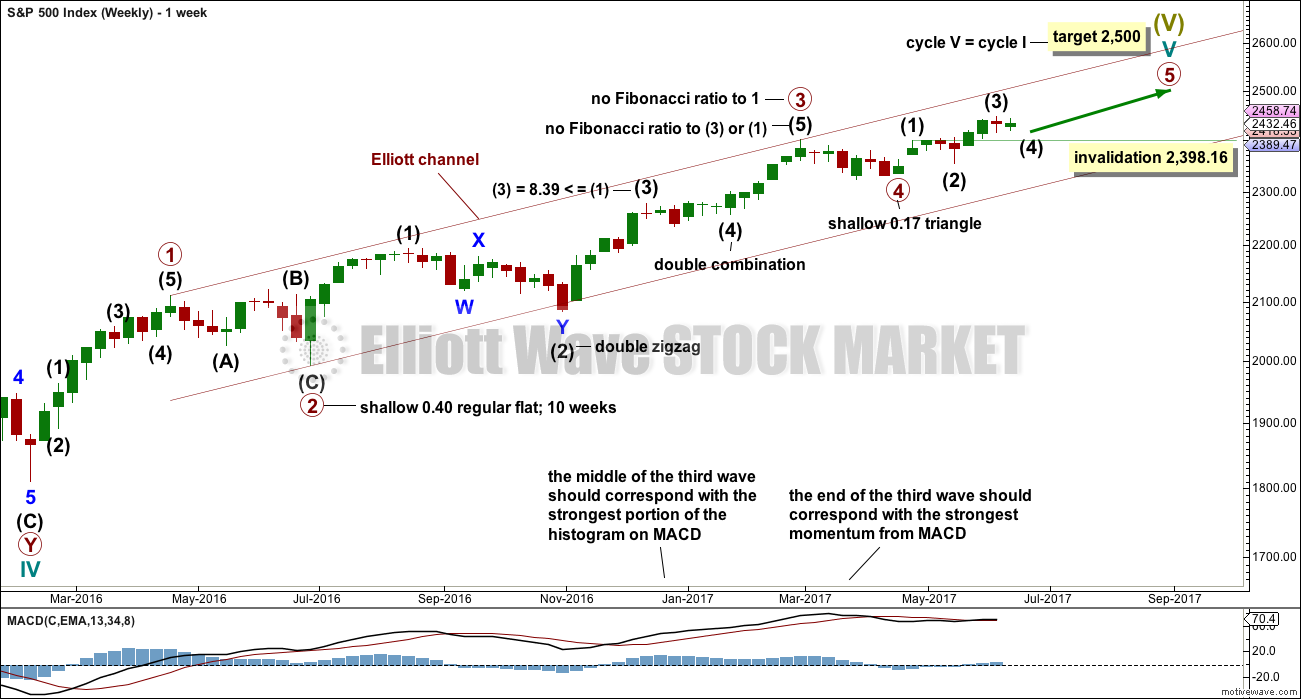
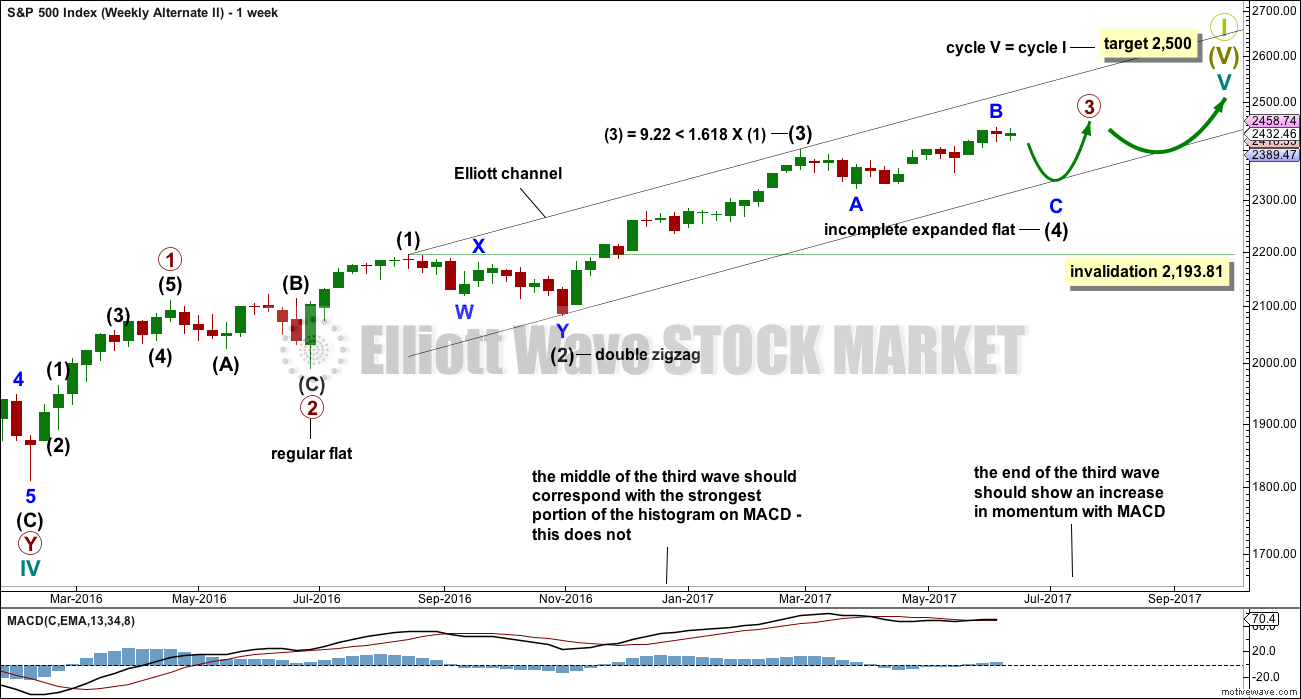
Primary wave 3 may be complete, falling short of 1.618 the length of primary wave 1 and not exhibiting a Fibonacci ratio to primary wave 1. There is a good Fibonacci ratio within primary wave 3.
The target for cycle wave V will remain the same, which has a reasonable probability. At 2,518 primary wave 5 would reach 0.618 the length of primary wave 1. If the target at 2,500 is exceeded, it may not be by much.
There is alternation between the regular flat correction of primary wave 2 and the triangle of primary wave 4.
Within primary wave 3, there is alternation between the double zigzag of intermediate wave (2) and the double combination of intermediate wave (4).
Within primary wave 5, the correction for intermediate wave (4) may not move into intermediate wave (1) price territory below 2,398.16.
DAILY CHART
Click chart to enlarge.
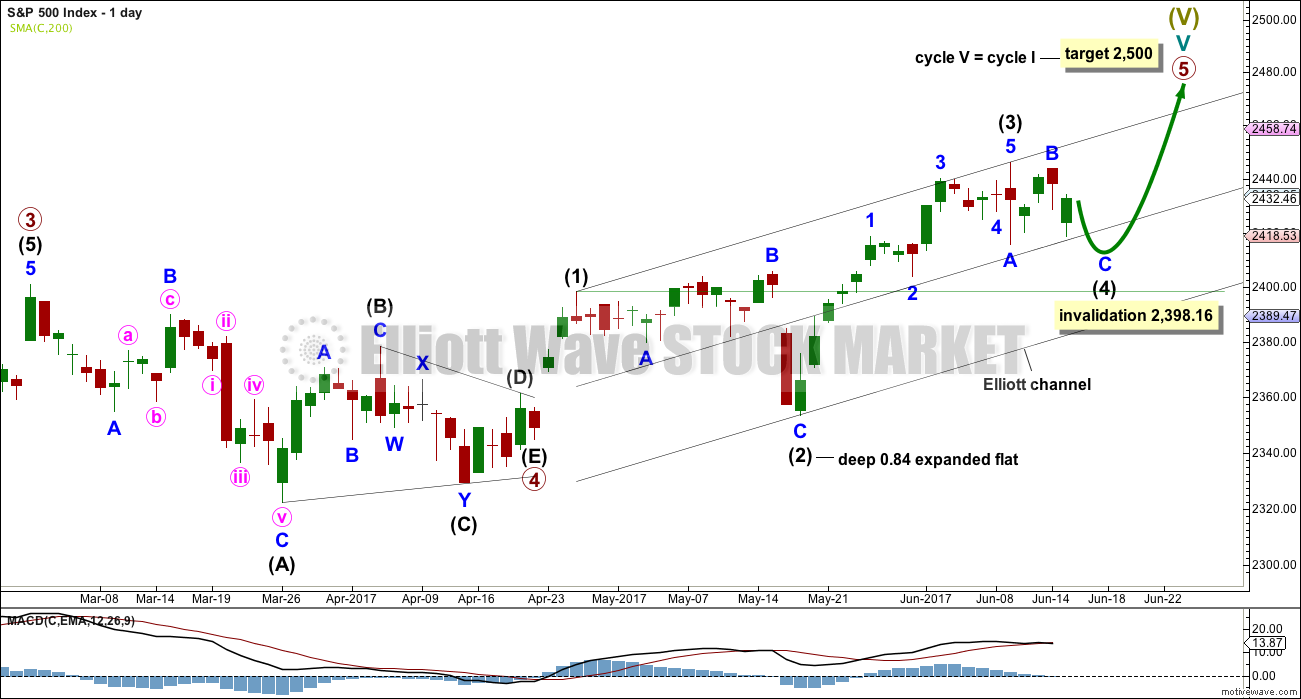
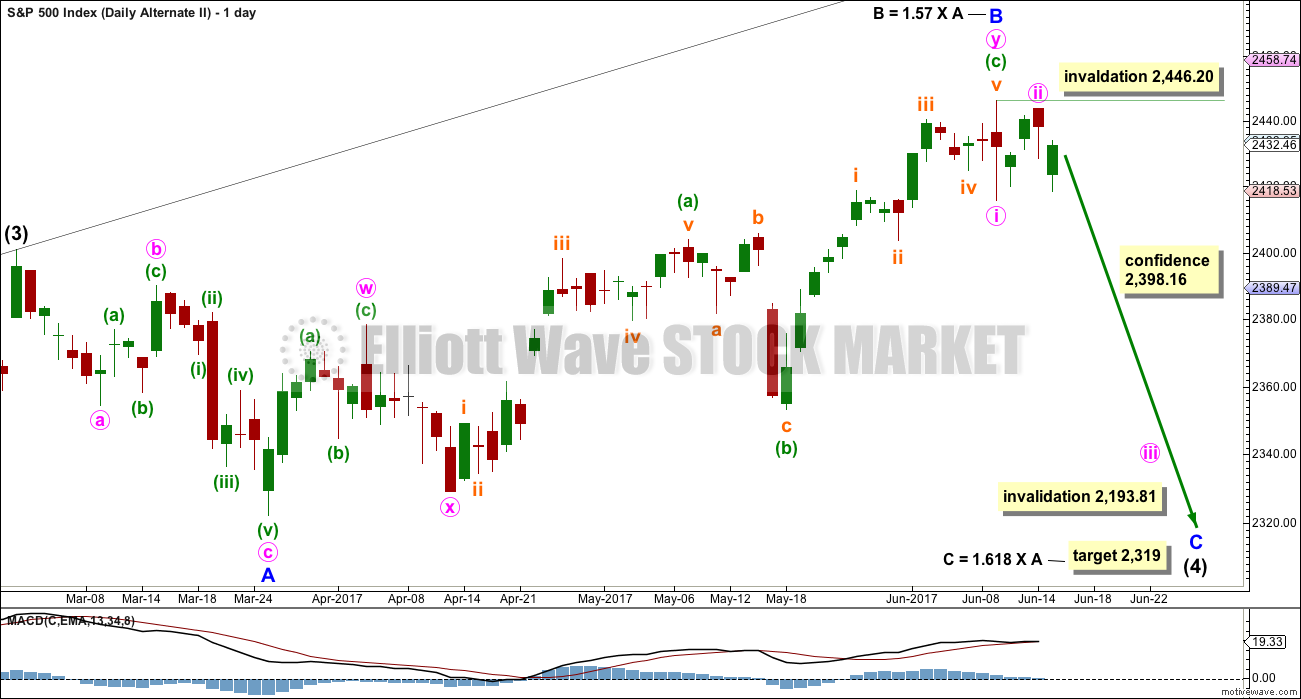
Primary wave 5 must complete as a five wave motive structure, either an impulse (more common) or an ending diagonal (less common). So far, if this wave count is correct, it looks like an impulse.
At the daily chart level, intermediate wave (3) now looks like a complete five wave impulse. With subsequent downwards movement moving into minor wave 1 price territory below 2,418.71, this downwards movement cannot be a continuation of minor wave 4, so minor wave 4 must be over.
Intermediate wave (2) was a very deep 0.84 expanded flat correction. The guideline of alternation tells us to expect a shallow single or multiple zigzag as most likely for intermediate wave (4). It may also be a triangle and achieve alternation in structure.
Intermediate wave (2) lasted 16 sessions. Intermediate wave (4) may be expected to last at least two weeks. Good proportion between corrective waves gives a wave count the right look. If my labelling within intermediate wave (4) so far is wrong, it may be in expecting that minor waves A and B are already over. They may continue further, so labelling within intermediate wave (4) may need to be moved down one degree.
Intermediate wave (4) may end within the price territory of the fourth wave of one lesser degree. Minor wave 4 has its range from 2,440.23 to 2,424.25.
Intermediate wave (4) may not move into intermediate wave (1) price territory below 2,398.16.
HOURLY CHART
Click chart to enlarge.
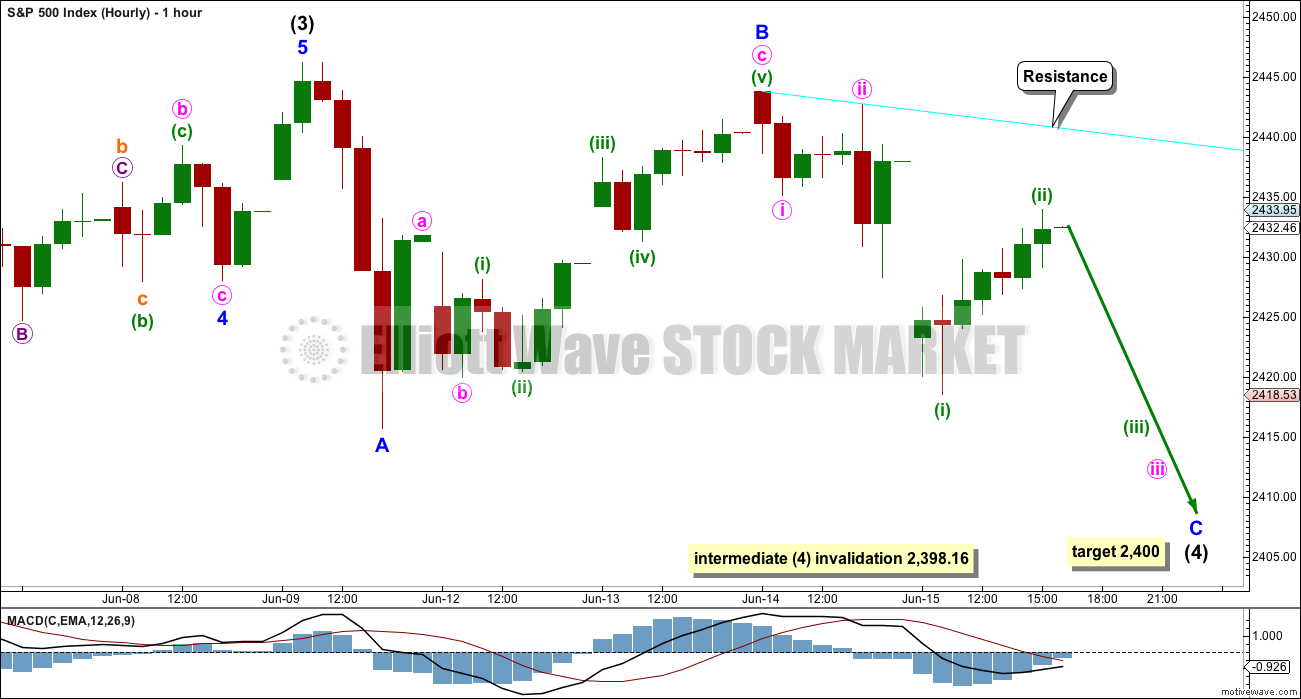
It is impossible to tell if the downwards wave labelled minor wave A is a three wave zigzag or a five wave impulse. It may be either. If it is a three, then minor wave B may make a new all time high as in an expanded flat or running triangle.
It is possible now that minor wave B could be over.
If minor wave B is over as a zigzag, then tomorrow should see price move lower with some increase in momentum.
Depending upon how long it takes, if a five down completes from here, then a zigzag may be complete for intermediate wave (4), or that may only be wave A of a longer lasting triangle for intermediate wave (4).
The target for this hourly wave count is adjusted today to be the round number pivot at 2,400.
If price makes a new low below 2,398.16, then the degree of this correction would be moved up from intermediate to primary. The invalidation point would then be at 2,111.05.
HOURLY CHART – ALTERNATE
Click chart to enlarge.
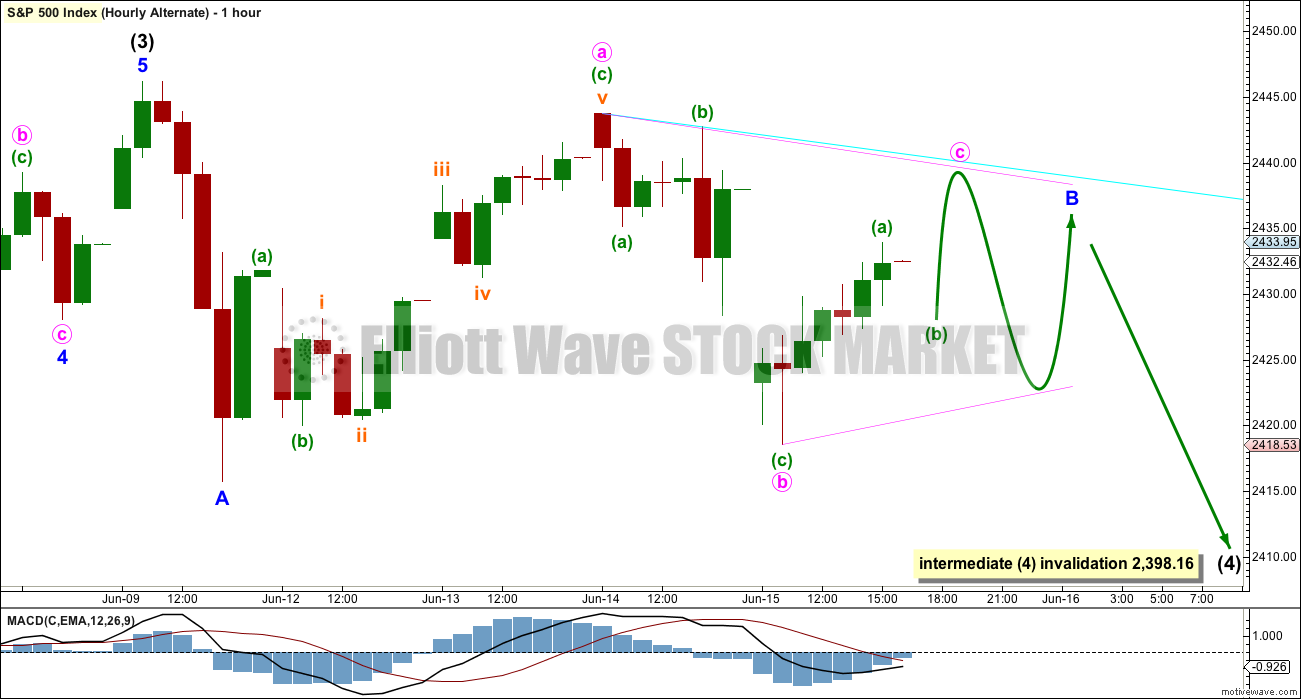
It is also possible that minor wave B is incomplete. It may be continuing sideways as a triangle or a combination. Resistance would still be expected about the same trend line.
If minor wave B continues sideways, it may last all of next week.
ALTERNATE WEEKLY CHART
Click chart to enlarge.
This weekly chart has been published with a slight variation before.
It is still possible that intermediate wave (4) is incomplete and may be continuing as a very common expanded flat correction.
This weekly wave count expects a slow end to Grand Super Cycle wave I at the target at 2,500. Once intermediate wave (4) is over, then intermediate wave (5) would be expected to move above the end of intermediate wave (3) at 2,400.98 to avoid a truncation; it need not make a new all time high (but would be likely to do so).
Thereafter, another multi week sideways correction for primary wave 4 may unfold that must remain above primary wave 1 price territory, which has its extreme at 2,111.05.
Finally, a last upwards wave for primary wave 5 towards the target at 2,500 should show substantial weakness.
This wave count allows for the target at 2,500 to be reached possibly in October.
When looking at upwards movement so far on the monthly chart, the corrections of intermediate waves (2) and (4) show up. This is how the labelling fits best at that time frame.
It is also still possible that the expanded flat correction could be labelled primary wave 4 as per the alternate published here.
ALTERNATE DAILY CHART
Click chart to enlarge.
Expanded flat corrections are very common structures. They subdivide 3-3-5. Within this one, minor wave B would now be beyond the common range of 1 to 1.38 the length of minor wave A.
Within minor wave C, no second wave correction may move beyond its start above 2,446.20. If price makes a new high above this point, at that stage the idea of an expanded flat correction continuing would be discarded.
TECHNICAL ANALYSIS
WEEKLY CHART
Click chart to enlarge. Chart courtesy of StockCharts.com.
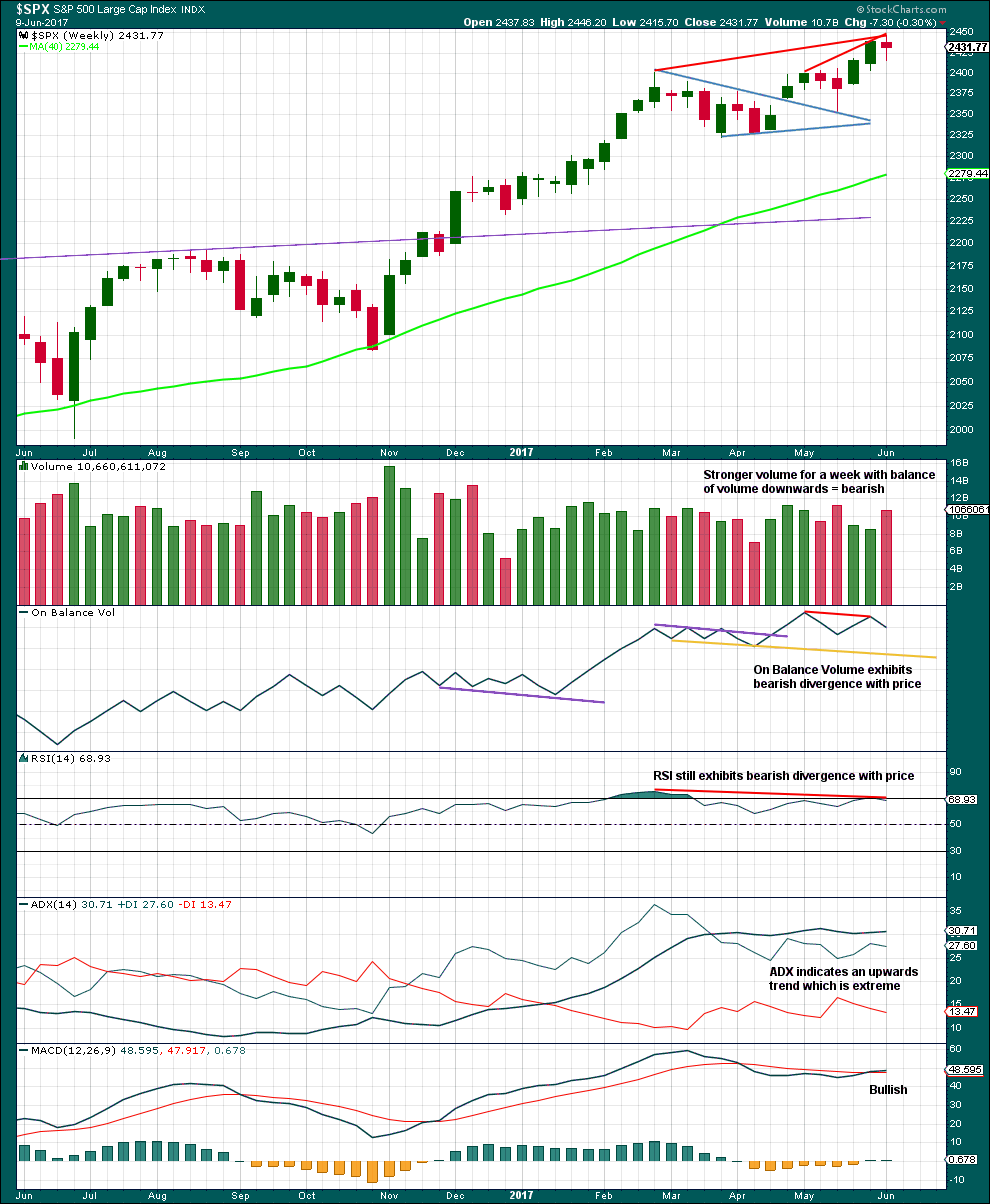
The short term volume profile is bearish.
On Balance Volume gives its last signal as bearish divergence with price.
Divergence with price and RSI is bearish. ADX at extreme is bearish.
Only MACD is bullish.
Look out for a pullback, either here or very soon, within the larger upwards trend to resolve extreme ADX.
DAILY CHART
Click chart to enlarge. Chart courtesy of StockCharts.com.
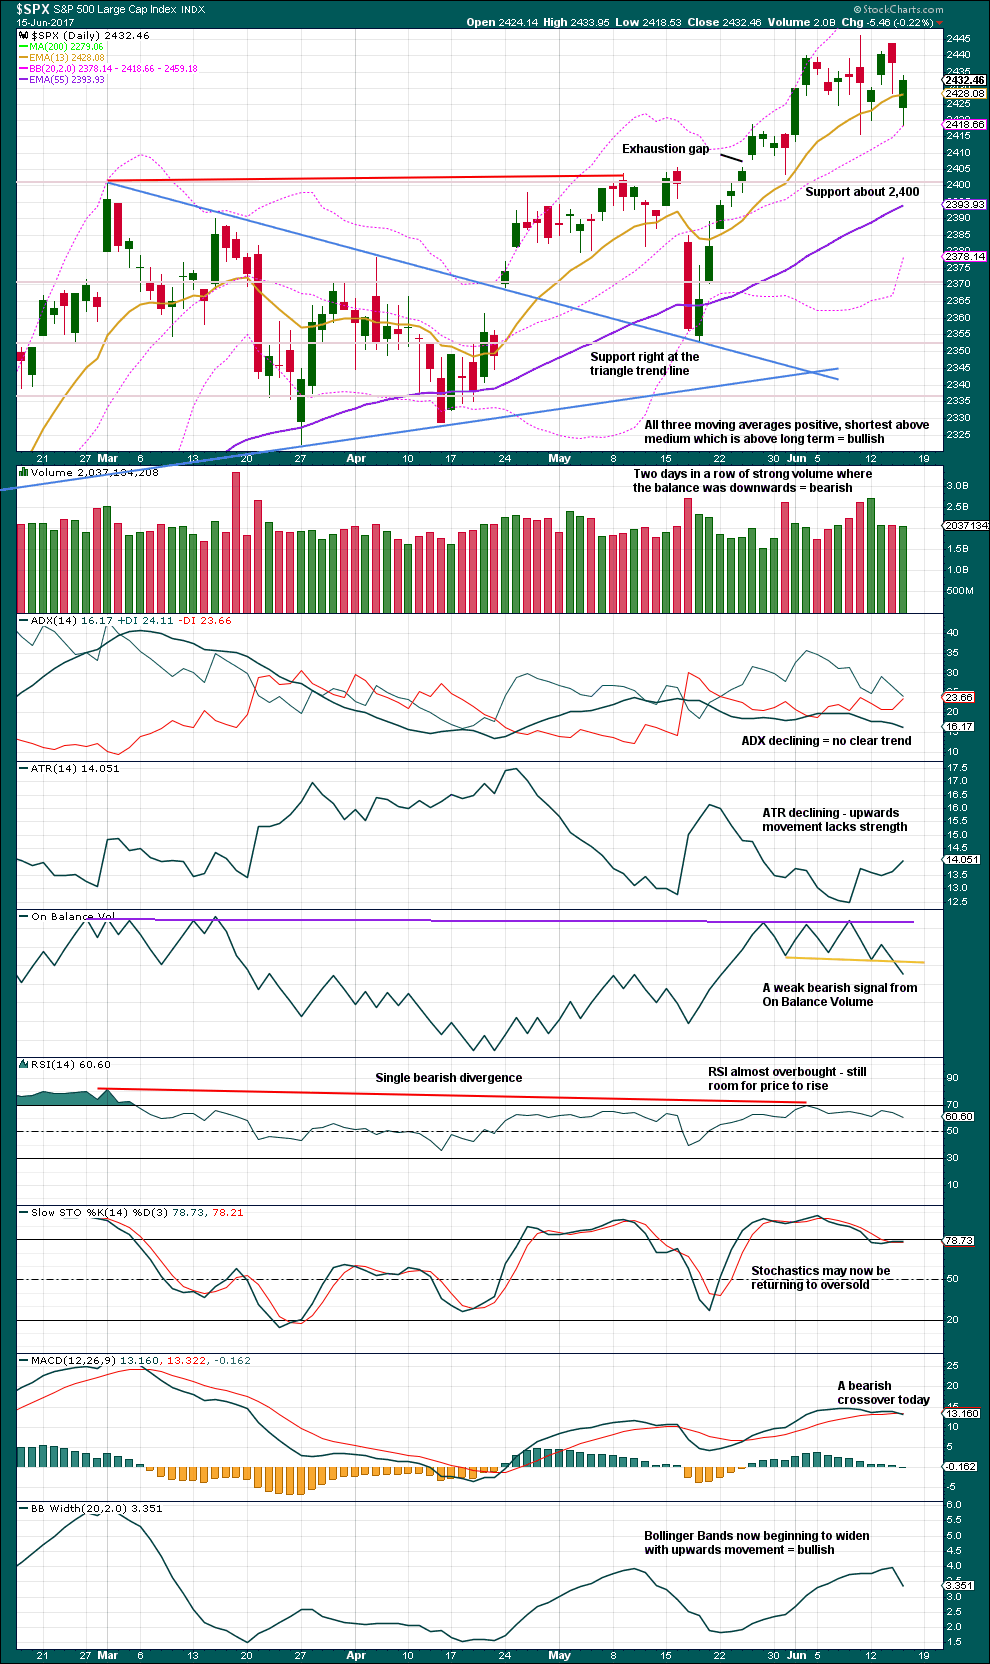
Long lower wicks on the last four daily candlesticks are bullish.
Price is range bound. Volume is now light and very slightly declining. Resistance is about 2,445 and support is about 2,415, with strong support below that at 2,400.
The signal from On Balance Volume today is weak because this line has been tested only three times and is not long held.
With ADX at the weekly chart level indicating an extreme upwards trend, a bearish signal now from On Balance Volume, and daily ADX declining, expect price to continue within a consolidation and possibly a pullback. The consolidation or pullback is not done yet.
Expect an upwards breakout when it is done.
VOLATILITY – INVERTED VIX CHART
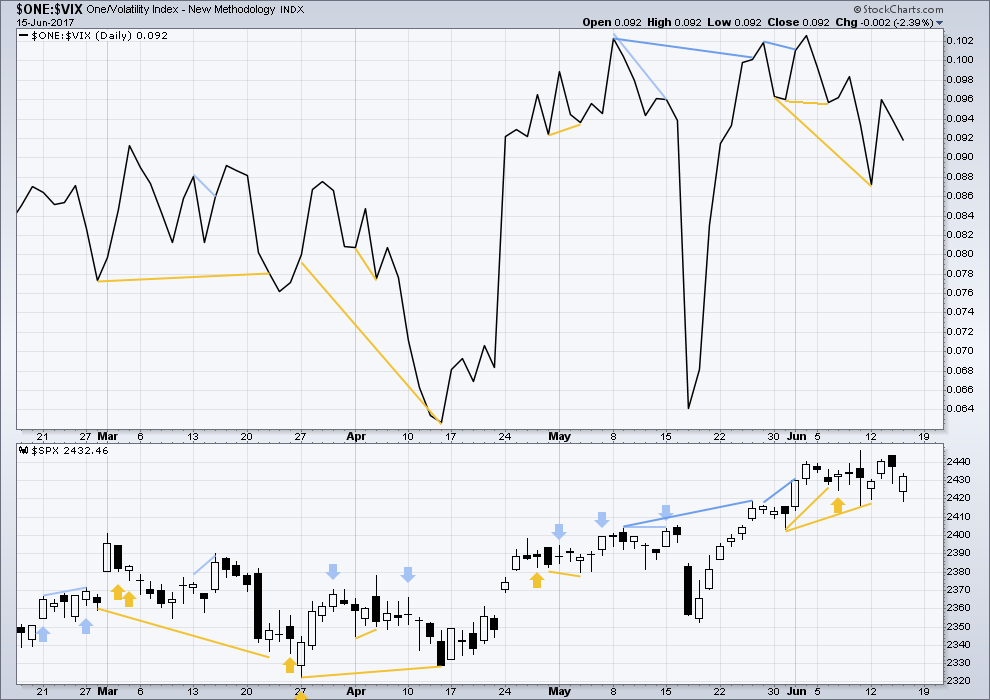
Click chart to enlarge. Chart courtesy of StockCharts.com.
Normally, volatility should decline as price moves higher and increase as price moves lower. This means that normally inverted VIX should move in the same direction as price.
There is no new divergence today between price and VIX.
BREADTH – AD LINE
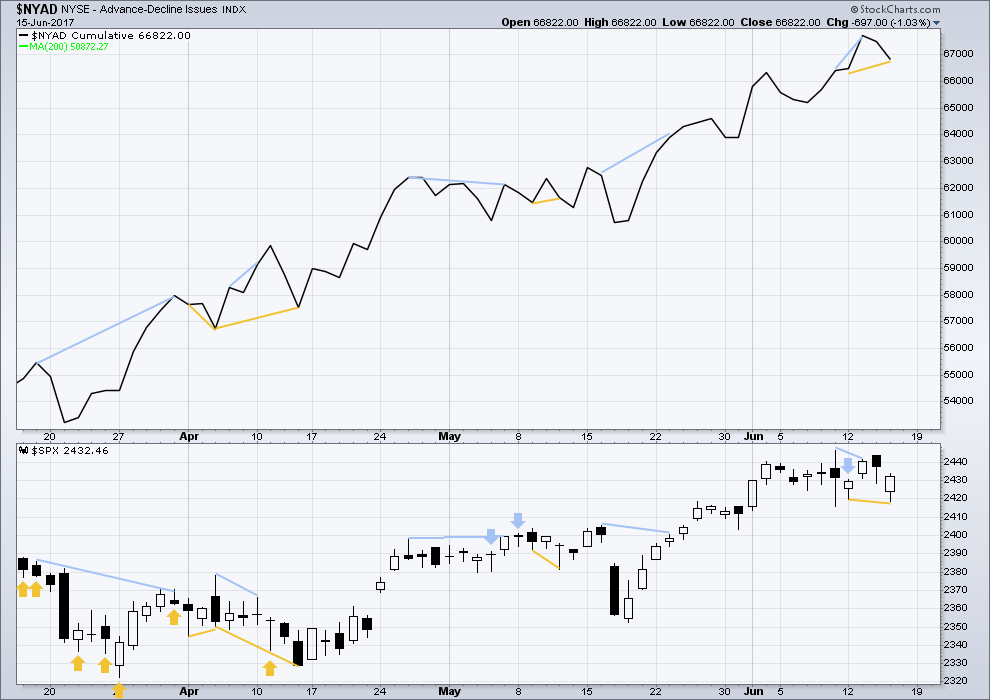
Click chart to enlarge. Chart courtesy of StockCharts.com.
With the last all time high for price, the AD line also made a new all time high. Up to the last high for price there was support from rising market breadth.
There is normally 4-6 months divergence between price and market breadth prior to a full fledged bear market. With no divergence yet at this point, any decline in price should be expected to be a pullback within an ongoing bull market and not necessarily the start of a bear market.
There is new bullish divergence today between price and the AD line: price has made a very slight new low below the low of the 12th of June, but the AD line has not. Downwards movement lacks support from declining breadth. However, this divergence is so very slight it will not be given weight in this analysis.
At the end of last week, it is noted that the mid caps and small caps have now made new all time highs. The rise in price is seen across the range of the market, so it has internal strength.
DOW THEORY
At the end of last week, DJIA, Nasdaq and the S&P500 have all made new all time highs. DJT has failed to confirm an ongoing bull market because it has not yet made new a all time high. However, at this stage that only indicates some potential weakness within the ongoing bull market and absolutely does not mean that DJT may not yet make new all time highs, and it does not mean a bear market is imminent.
The following lows need to be exceeded for Dow Theory to confirm the end of the bull market and a change to a bear market:
DJIA: 17,883.56.
DJT: 7,029.41.
S&P500: 2,083.79.
Nasdaq: 5,034.41.
Charts showing each prior major swing low used for Dow Theory are here.
This analysis is published @ 07:50 p.m. EST.
Another boring day watching paint dry. I did expect this, and I know it’s dull, but at it’s end it’ll provide a nice entry opportunity to join the larger long term upwards trend. We’ll still have to be on our toes to catch that.
I think the alternate hourly is the one, or a variation thereof.
I think you are right on the money with this count Lara. There is a significant Bradley turn date on the 20 so d and e will probably conclude early next week.
The turn date does suggest a significant trend change so it could possibly be a higher degree decline as per one of your earlier alternates.
I am still musing over the utter implausibility of the FED bombast in promising another rate hike as well as a 600 billion per year unwind of their bloated balance sheet. Whatever their political aims, the have to also be fully aware that a deflationary crash ushered in by tightening policy in a slowing, debt smothered economy will bankrupt them as well. They have a very tiny margin of safety with that mountain of assets. The smallest of decline in the value of asset holdings is going to result in a whole world of hurt. Why then would they commit to a clearly suicidal course of action I ask?
It occurred to me that the answer is as plain as the nose on our faces. Does anyone really believe the FED actually reduced their market pumps when they announced “tapering” a few years back. If you do I’ve got a bridge in Brooklyn I’d like to sell ya.
The announcements from the FED are intended to be nothing more than propaganda. Oh, I know they did raise the last time around, but just wait and see what happens the minute the markets begin to tank. They are lying about their intentions, plain and simple. They may be duplicitous, but they are certainly not dumb. I expect a hasty retreat on rates after the first wave down of the coming bear market, and a subsequent announcement of additional Q.E. Not that it is going to make much of a difference….
I agree, they’re probably lying.
Q.E. surely has to end one day? They can’t keep creating a bigger and bigger mountain of debt and pumping the resulting $$ into the markets? Surely one day the population will lose it’s appetite for debt and insist no more?
Hard to see this going on forever and ever.
Maybe they’ll try it… and be lambasted for creating a monster when greed turns to fear and the markets fall.
I don’t know exactly how this is going to play out in the next year to few, but I’m pretty sure it’s going to be very ugly indeed.
Tada!
dat darn wabbit