
Sideways movement was expected for Monday, which is exactly what happened.
Summary: Expect a sideways consolidation to continue this week and likely into next week as well. When it is done, it should offer a good entry point to join the longer term upwards trend.
New updates to this analysis are in bold.
Last monthly and weekly charts are here. Last historic analysis video is here.
MAIN ELLIOTT WAVE COUNT
WEEKLY CHART
Click chart to enlarge.
This wave count has a better fit with MACD and so may have a higher probability.
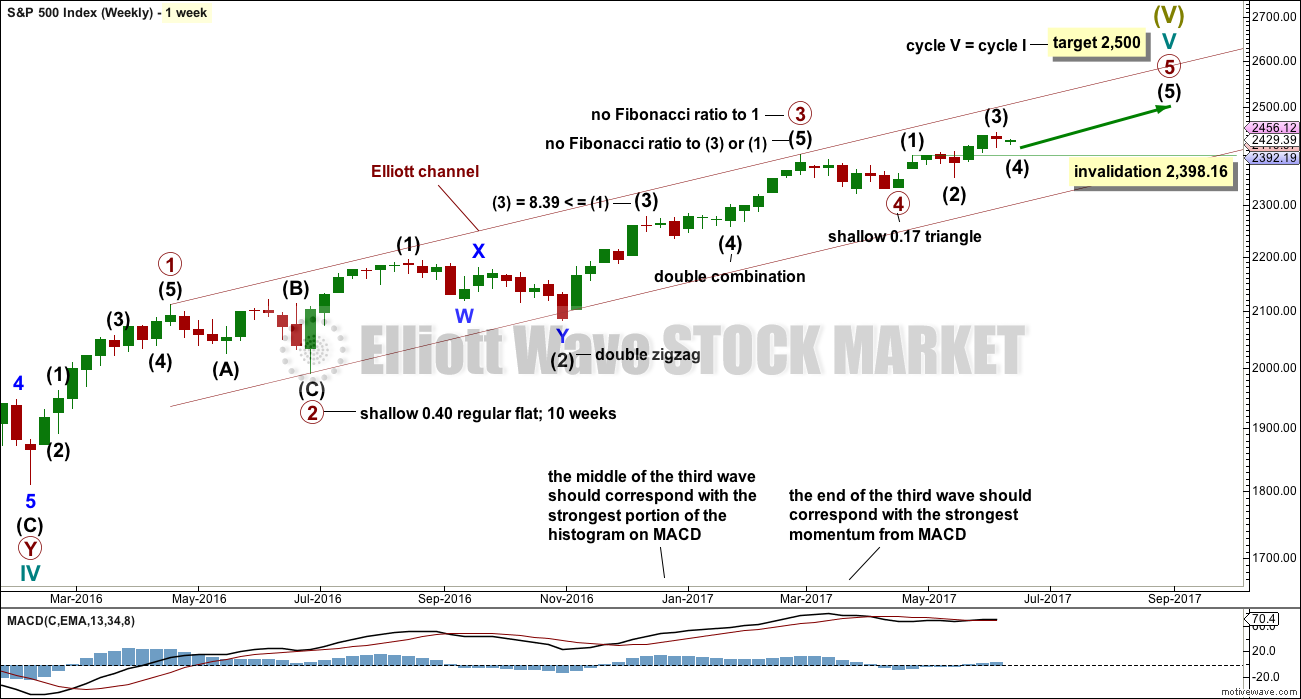
Primary wave 3 may be complete, falling short of 1.618 the length of primary wave 1 and not exhibiting a Fibonacci ratio to primary wave 1. There is a good Fibonacci ratio within primary wave 3.
The target for cycle wave V will remain the same, which has a reasonable probability. At 2,518 primary wave 5 would reach 0.618 the length of primary wave 1. If the target at 2,500 is exceeded, it may not be by much.
There is alternation between the regular flat correction of primary wave 2 and the triangle of primary wave 4.
Within primary wave 3, there is alternation between the double zigzag of intermediate wave (2) and the double combination of intermediate wave (4).
Within primary wave 5, the correction for intermediate wave (4) may not move into intermediate wave (1) price territory below 2,398.16.
DAILY CHART
Click chart to enlarge.
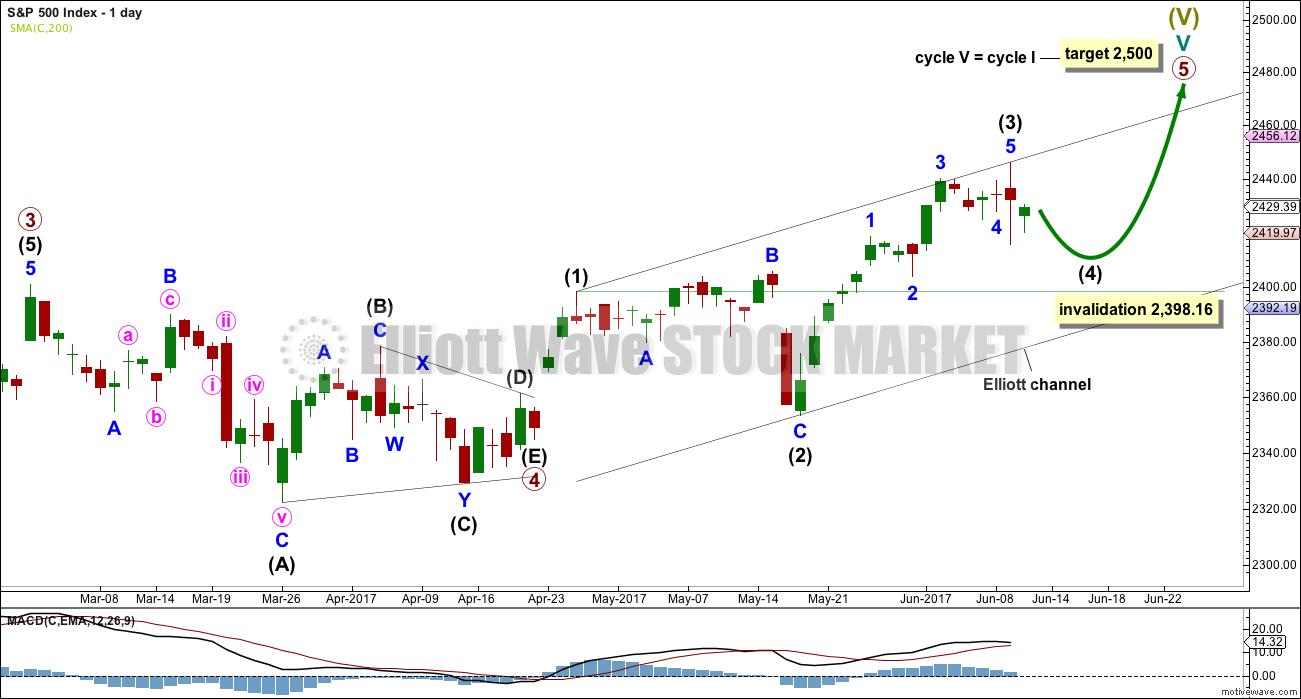
Primary wave 5 must complete as a five wave motive structure, either an impulse (more common) or an ending diagonal (less common). So far, if this wave count is correct, it looks like an impulse.
At the daily chart level, intermediate wave (3) now looks like a complete five wave impulse. With subsequent downwards movement moving into minor wave 1 price territory below 2,418.71, this downwards movement cannot be a continuation of minor wave 4, so minor wave 4 must be over.
Intermediate wave (2) was a very deep 0.84 expanded flat correction. The guideline of alternation tells us to expect a shallow single or multiple zigzag as most likely for intermediate wave (4). It may also be a triangle and achieve alternation in structure.
Intermediate wave (2) lasted 16 sessions. Intermediate wave (4) may be expected to last at least two weeks. Good proportion between corrective waves gives a wave count the right look.
Intermediate wave (4) may end within the price territory of the fourth wave of one lesser degree. Minor wave 4 has its range from 2,440.23 to 2,424.25.
Intermediate wave (4) may not move into intermediate wave (1) price territory below 2,398.16.
HOURLY CHART
Click chart to enlarge.
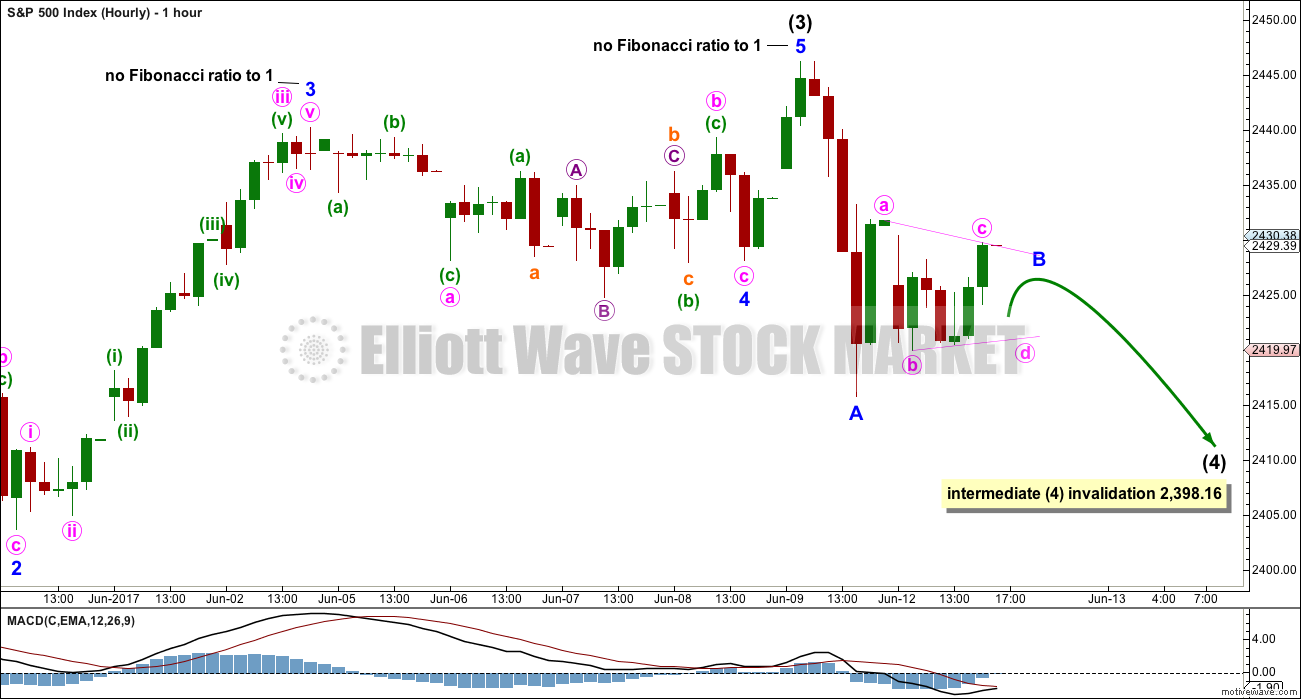
It is impossible to tell if the downwards wave labelled minor wave A is a three wave zigzag or a five wave impulse. It may be either. If it is a three, then minor wave B may make a new all time high as in an expanded flat or running triangle.
Minor wave B may unfold sideways and may last over a week. It may be any one of more than 23 possible corrective structures.
While minor wave B is labelled as a possible incomplete regular contracting triangle on this chart, it may yet morph into a combination or flat correction. The triangle could also be minute wave b within minor wave B.
The labelling within minor wave B will change as it unfolds sideways. Because it is still impossible to tell which corrective structure it may complete as, focus should be on identifying when it may be over rather than figuring out which structure might be unfolding.
Overall, intermediate wave (4) should move lower if it is a single or multiple zigzag, or just sideways if it is a triangle.
ALTERNATE WEEKLY CHART
Click chart to enlarge.
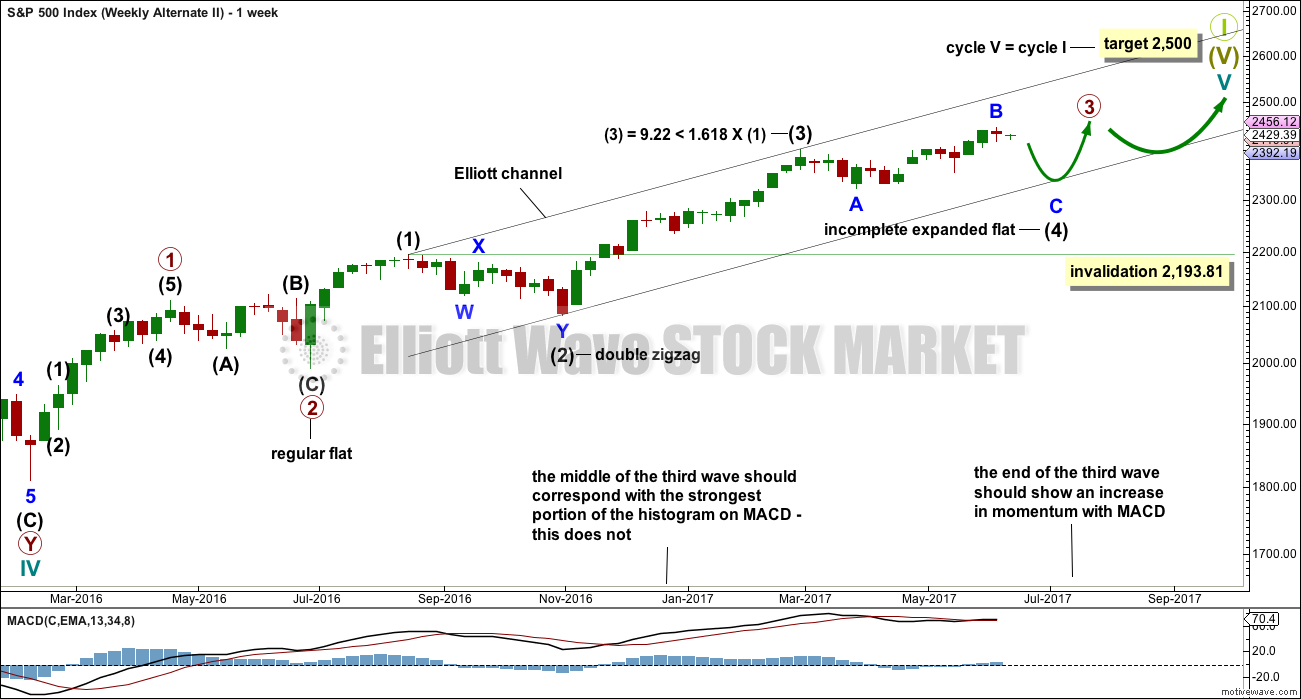
This weekly chart has been published with a slight variation before.
It is still possible that intermediate wave (4) is incomplete and may be continuing as a very common expanded flat correction.
This weekly wave count expects a slow end to Grand Super Cycle wave I at the target at 2,500. Once intermediate wave (4) is over, then intermediate wave (5) would be expected to move above the end of intermediate wave (3) at 2,400.98 to avoid a truncation; it need not make a new all time high (but would be likely to do so).
Thereafter, another multi week sideways correction for primary wave 4 may unfold that must remain above primary wave 1 price territory, which has its extreme at 2,111.05.
Finally, a last upwards wave for primary wave 5 towards the target at 2,500 should show substantial weakness.
This wave count allows for the target at 2,500 to be reached possibly in October.
When looking at upwards movement so far on the monthly chart, the corrections of intermediate waves (2) and (4) show up. This is how the labelling fits best at that time frame.
It is also still possible that the expanded flat correction could be labelled primary wave 4 as per the alternate published here.
ALTERNATE DAILY CHART
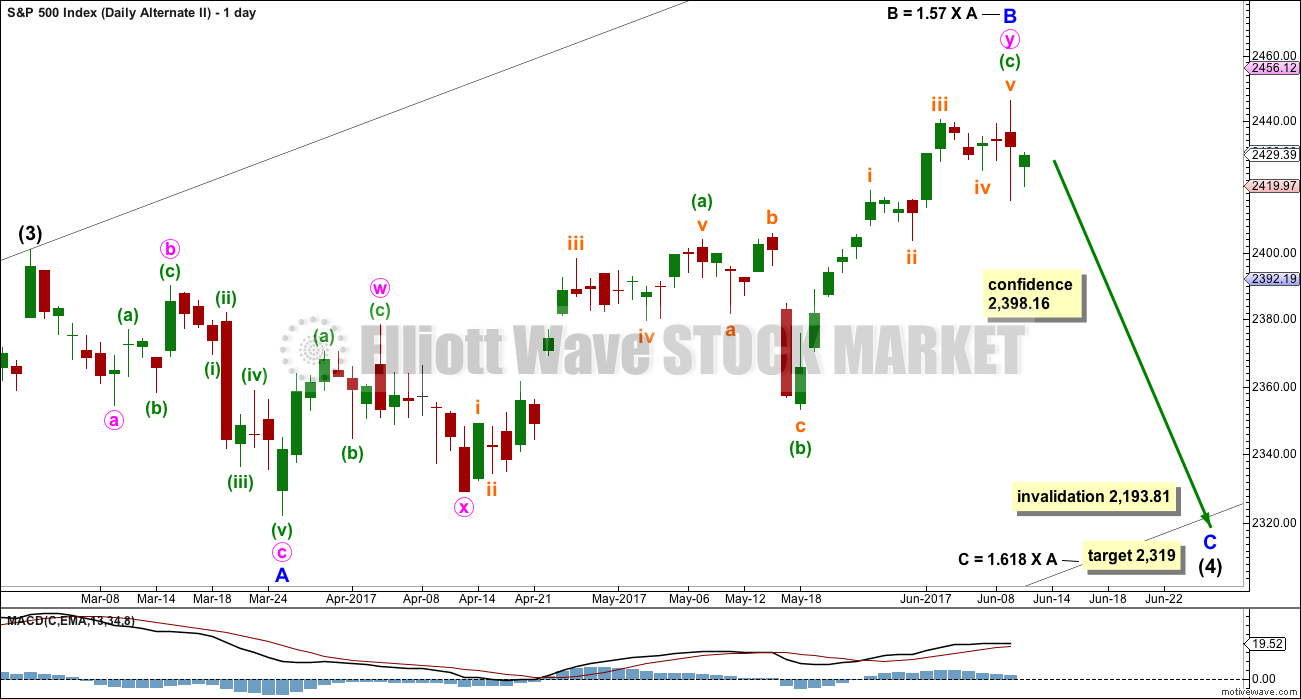
Click chart to enlarge.
Expanded flat corrections are very common structures. They subdivide 3-3-5. Within this one, minor wave B would now be beyond the common range of 1 to 1.38 the length of minor wave A.
The target for minor wave C is recalculated.
The target calculated expects price to find strong support at the lower edge of the black Elliott channel, which is copied over from the weekly chart.
TECHNICAL ANALYSIS
WEEKLY CHART
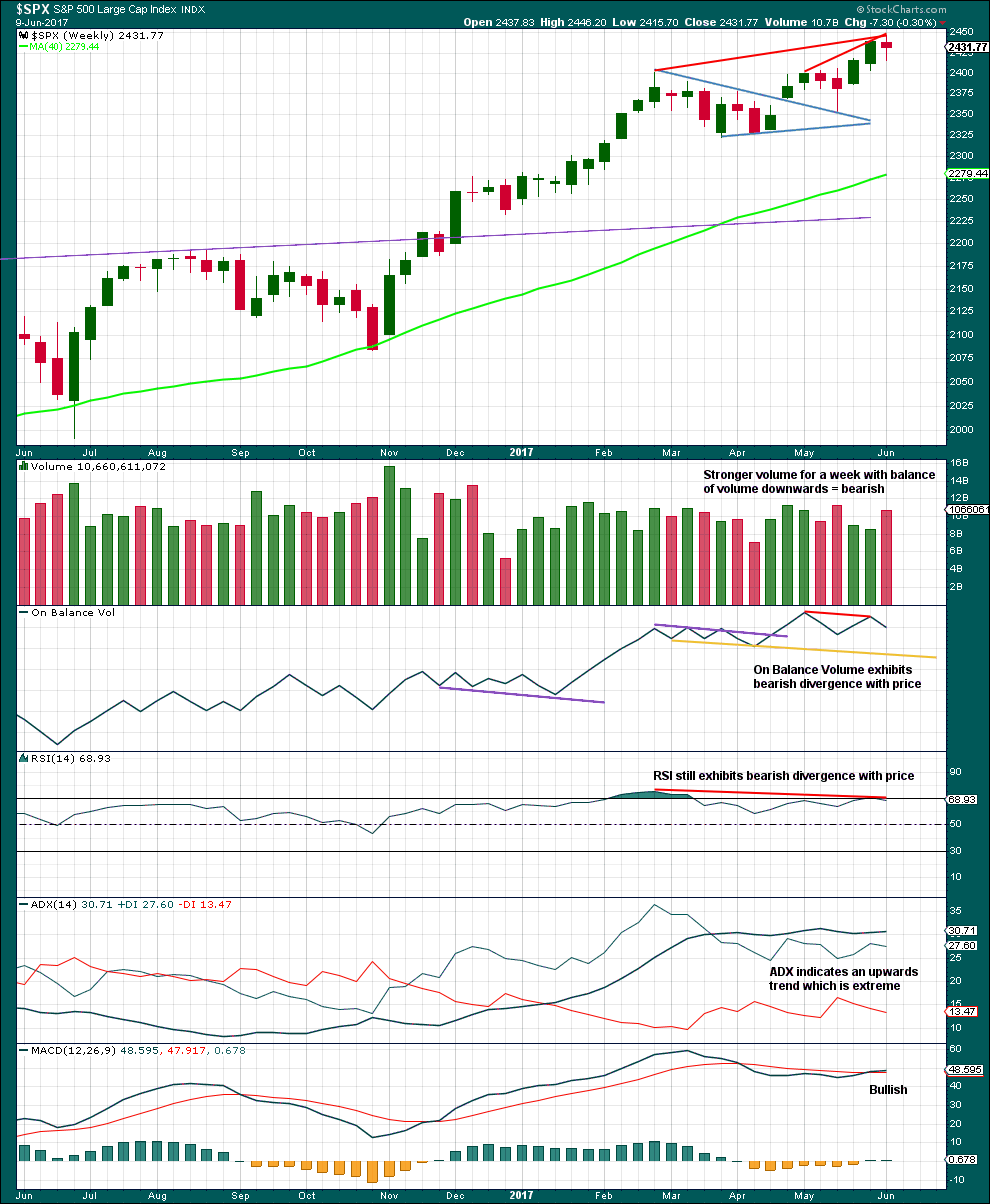
Click chart to enlarge. Chart courtesy of StockCharts.com.
The short term volume profile is bearish.
On Balance Volume gives its last signal as bearish divergence with price.
Divergence with price and RSI is bearish. ADX at extreme is bearish.
Only MACD is bullish.
Look out for a pullback, either here or very soon, within the larger upwards trend to resolve extreme ADX.
DAILY CHART
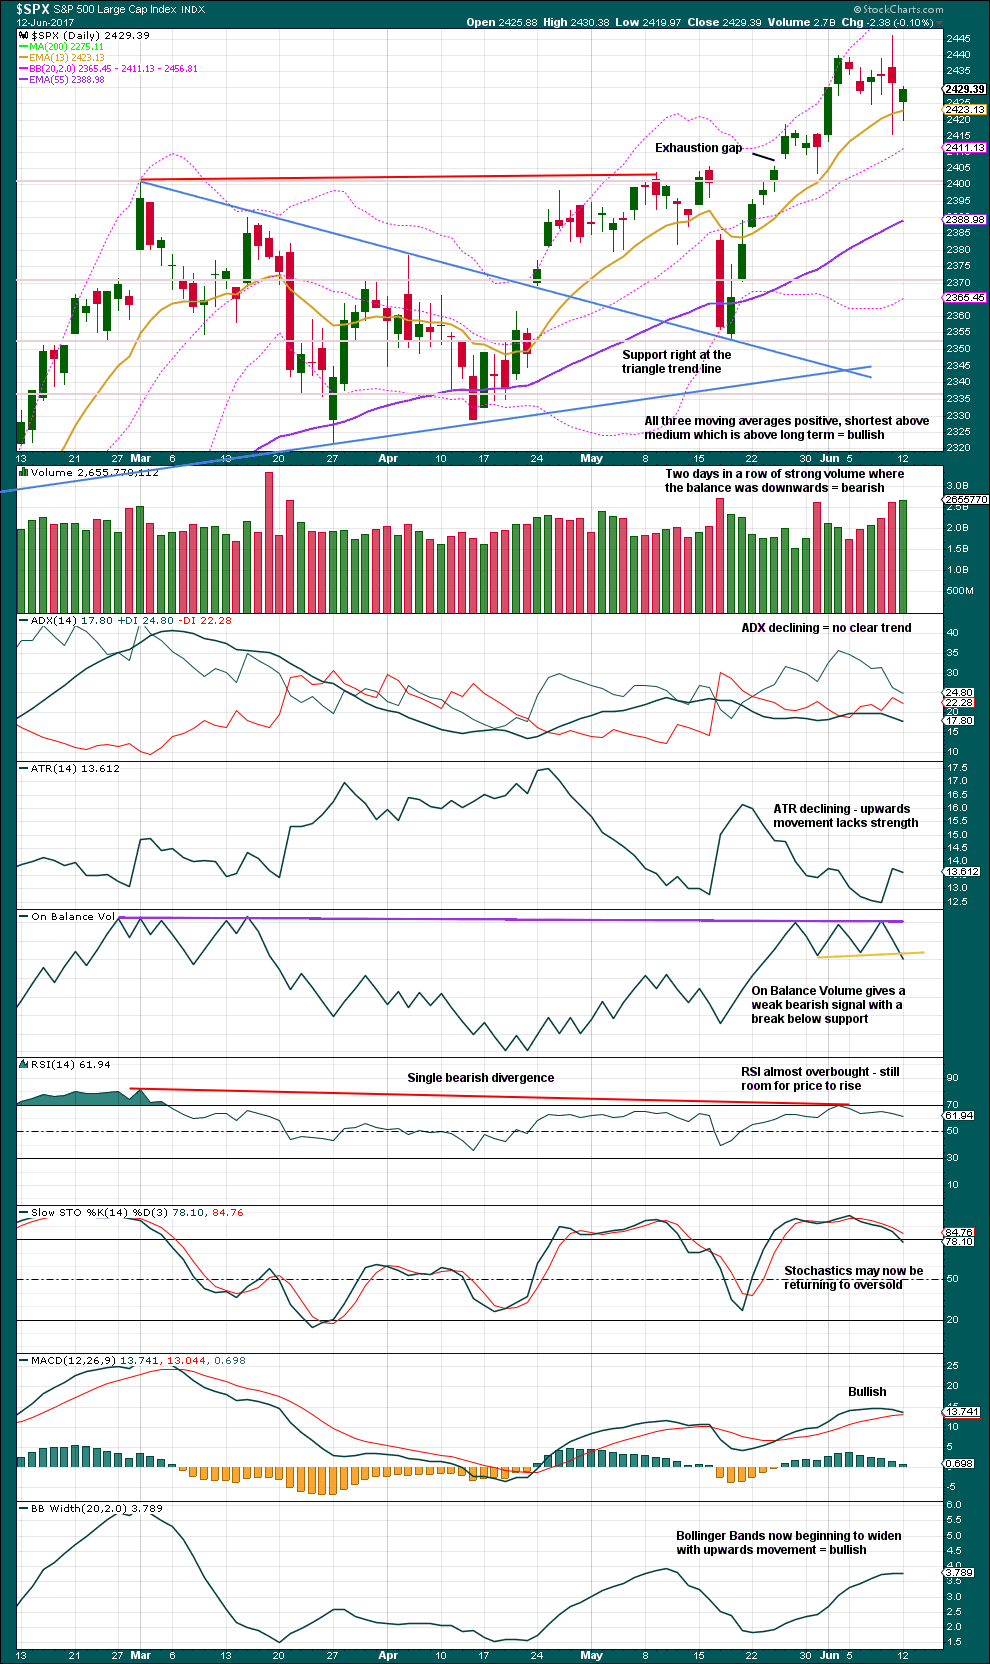
Click chart to enlarge. Chart courtesy of StockCharts.com.
The target about 2,448 given from the measured rule out of the symmetrical triangle was almost reached on Friday. Expect a pullback.
There is strong support about 2,400.
The short term volume profile is bearish. On Balance Volume is bearish.
Expect a sideways consolidation or a pullback to find support about 2,400, and to only end when Stochastics reaches oversold.
VOLATILITY – INVERTED VIX CHART
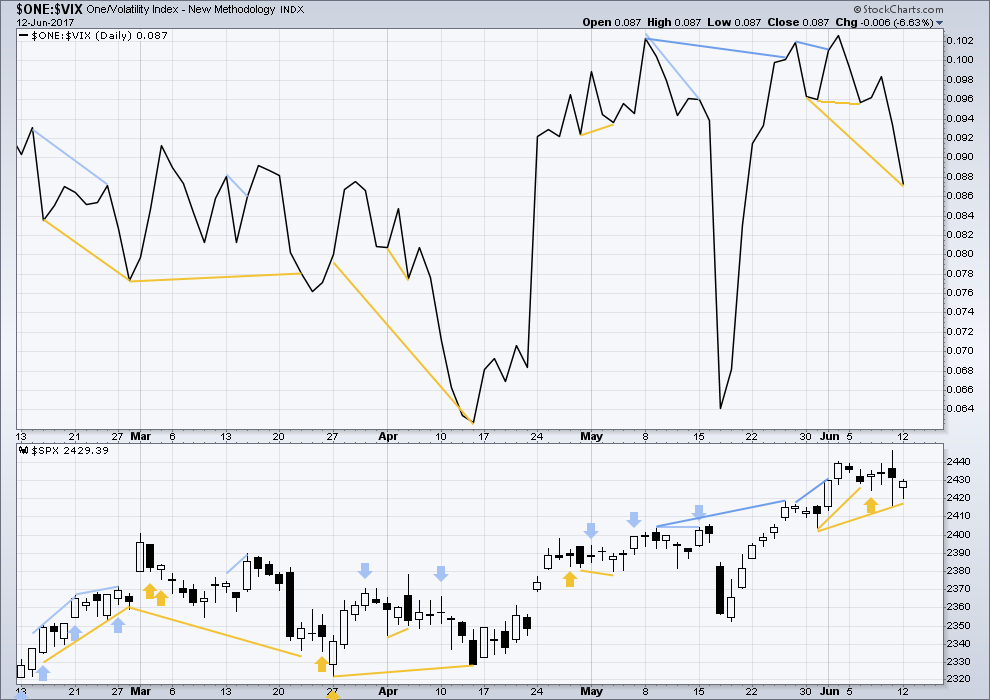
Click chart to enlarge. Chart courtesy of StockCharts.com.
Normally, volatility should decline as price moves higher and increase as price moves lower. This means that normally inverted VIX should move in the same direction as price.
Short term bullish divergence between price and VIX continues and is stronger today. This may be followed by one or two upwards days.
BREADTH – AD LINE
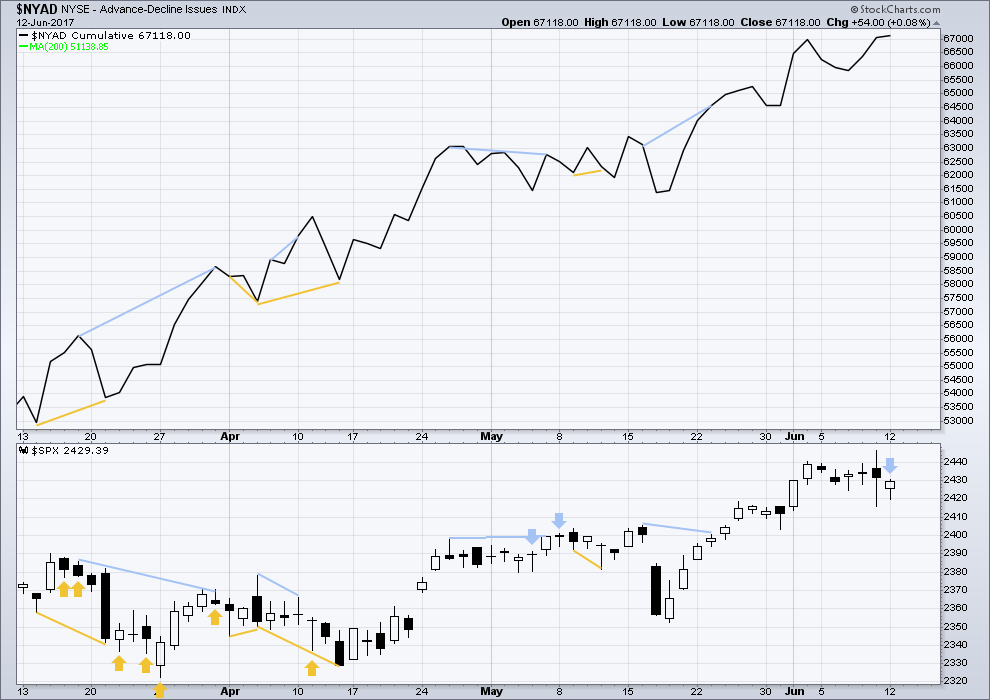
Click chart to enlarge. Chart courtesy of StockCharts.com.
With the last all time high for price, the AD line also made a new all time high. Up to the last high for price there was support from rising market breadth.
There is normally 4-6 months divergence between price and market breadth prior to a full fledged bear market. With no divergence yet at this point, any decline in price should be expected to be a pullback within an ongoing bull market and not necessarily the start of a bear market.
The AD line today made a new all time high but price did not. This divergence is bearish and indicates weakness within price. It may be followed by one or two downwards days to be resolved.
At the end of last week, it is noted that the mid caps and small caps have now made new all time highs. The rise in price is seen across the range of the market, so it has internal strength.
DOW THEORY
At the end of last week, DJIA, Nasdaq and the S&P500 have all made new all time highs. DJT has failed to confirm an ongoing bull market because it has not yet made new a all time high. However, at this stage that only indicates some potential weakness within the ongoing bull market and absolutely does not mean that DJT may not yet make new all time highs, and it does not mean a bear market is imminent.
The following lows need to be exceeded for Dow Theory to confirm the end of the bull market and a change to a bear market:
DJIA: 17,883.56.
DJT: 7,029.41.
S&P500: 2,083.79.
Nasdaq: 5,034.41.
Charts showing each prior major swing low used for Dow Theory are here.
This analysis is published @ 08:40 p.m. EST.
It wasn’t a triangle. Minor B turned into a zigzag.
This may be minor B in its entirety, or it may only be minute a of minor B to continue sideways.
There are still multiple structural options for minor B and intermediate (4).
Down now at least short term most likely. First, we need to see the Elliott channel breached to know minuette (v) is over.
I have the same. We have the rare “southern hemi” swell hitting FL tomorrow from the very large storm off of South Africa last week.Nothing special but worth hitting the waves early!
Awesome 🙂 No surf for me here this week, the Pacific is confused. It thinks it’s a lake 🙁
Hi Lara, I was hoping for a favor. I top ticked the NASDAQ short and am sitting on very nice gains, I’m leaving my stop just above the high to let it run further, but was curious of your analysis on it. I believe the final high is in based on the divergences, or we are due for a high degree 4th wave, targeting the 5800 range.
Thanks!
I have it in it’s last big fourth wave for intermediate (4).
Intermediate (2) was a flat, so the most likely structure for (4) would be a zigzag or zigzag multiple. If it does that then it shouldn’t make a new ATH as part of it’s correction.
BUT
It could also be a running triangle with a new ATH and still exhibit alternation.
It should last a few weeks.
Thank you!
Doc, where are you? I cannot comment until you claim 1st post. Oh well, I guess I need to wait.
It’s all yours Rodney. Take it away…