
Upwards movement to a target at 2,448 to 2,450 was expected. Price moved higher to reach 2,446.20 before turning strongly downwards on Friday. Price fell just 1.8 points short of the 2 point target zone.
Summary: Expect a sideways consolidation now for at least a week, most likely longer. When it is done, it should offer a good entry point to join the longer term upwards trend.
New updates to this analysis are in bold.
Last monthly and weekly charts are here. Last historic analysis video is here.
MAIN ELLIOTT WAVE COUNT
WEEKLY CHART
Click chart to enlarge.
This wave count has a better fit with MACD and so may have a higher probability.
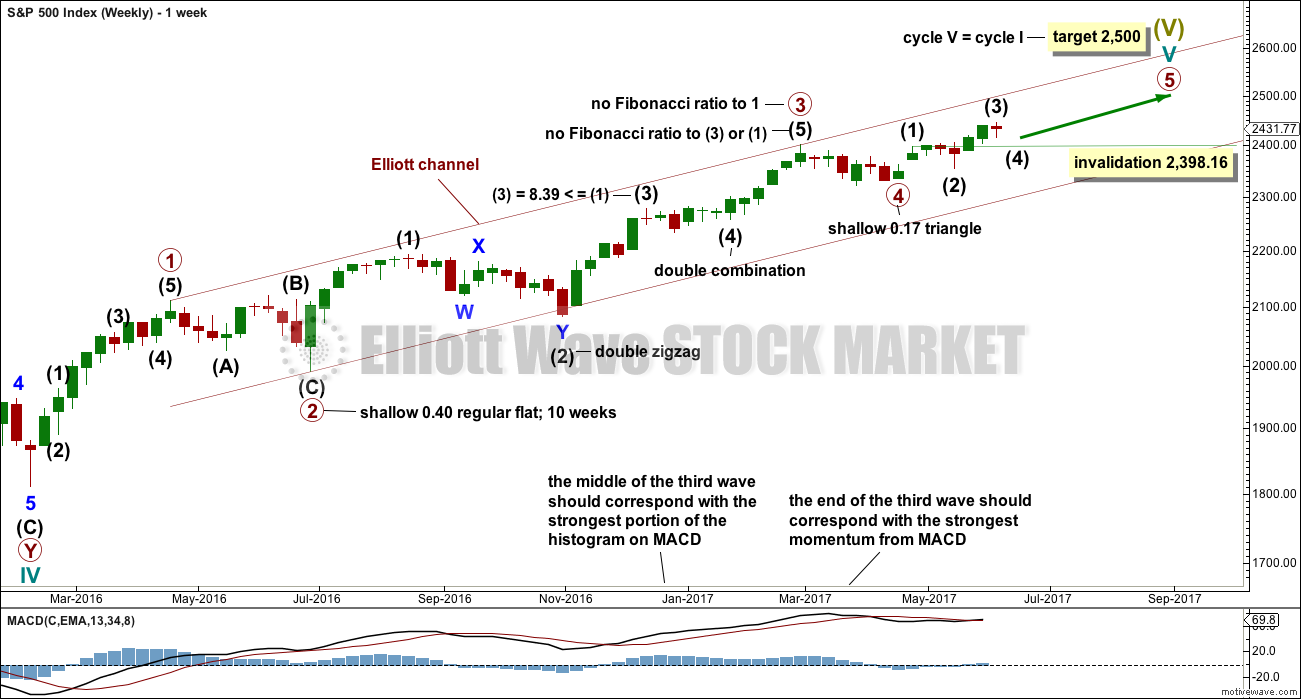
Primary wave 3 may be complete, falling short of 1.618 the length of primary wave 1 and not exhibiting a Fibonacci ratio to primary wave 1. There is a good Fibonacci ratio within primary wave 3.
The target for cycle wave V will remain the same, which has a reasonable probability. At 2,518 primary wave 5 would reach 0.618 the length of primary wave 1. If the target at 2,500 is exceeded, it may not be by much.
There is alternation between the regular flat correction of primary wave 2 and the triangle of primary wave 4.
Within primary wave 3, there is alternation between the double zigzag of intermediate wave (2) and the double combination of intermediate wave (4).
Within primary wave 5, the correction for intermediate wave (4) may not move into intermediate wave (1) price territory below 2,398.16.
DAILY CHART
Click chart to enlarge.
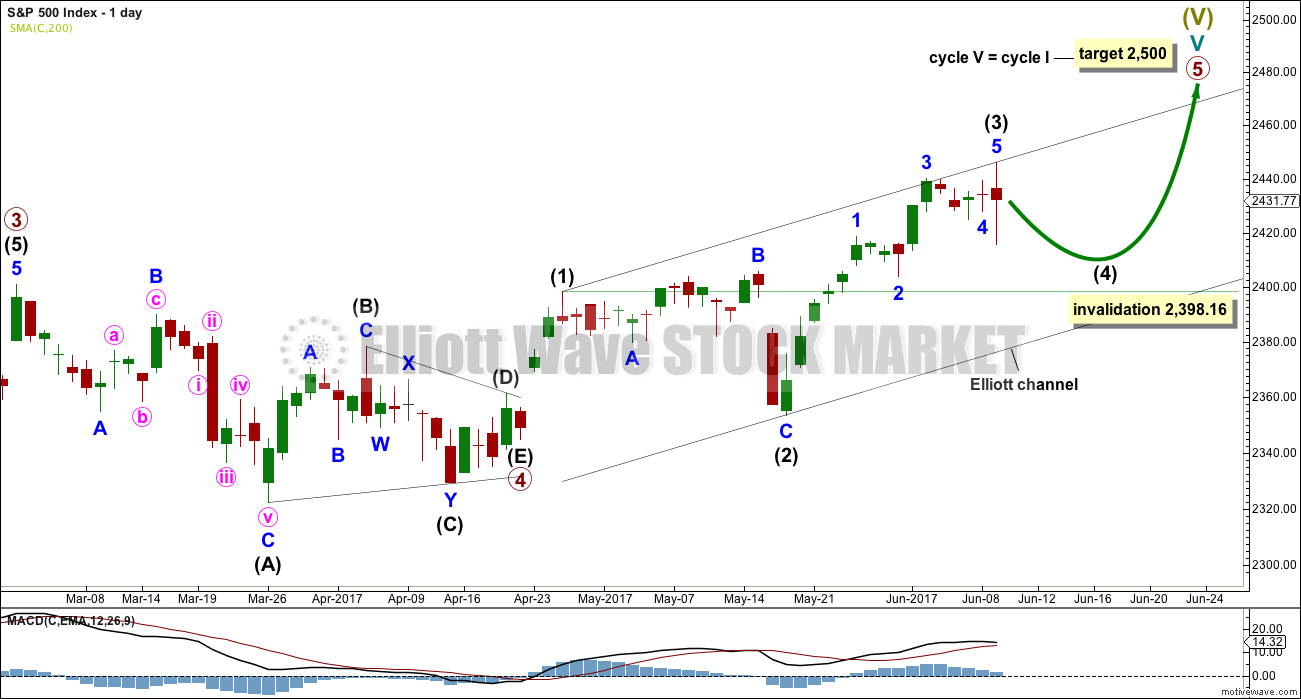
Primary wave 5 must complete as a five wave motive structure, either an impulse (more common) or an ending diagonal (less common). So far, if this wave count is correct, it looks like an impulse.
At the daily chart level, after Friday’s sharp upwards spike to a new all time high, intermediate wave (3) now looks like a complete five wave impulse. With downwards movement at the end of Friday’s session moving into minor wave 1 price territory below 2,418.71, this downwards movement cannot be a continuation of minor wave 4, so minor wave 4 must be over.
Intermediate wave (2) was a very deep 0.84 expanded flat correction. The guideline of alternation tells us to expect a shallow single or multiple zigzag as most likely for intermediate wave (4). It may also be a triangle and achieve alternation in structure.
Intermediate wave (2) lasted 16 sessions. Intermediate wave (4) may be expected to last at least two weeks. Good proportion between corrective waves gives a wave count the right look.
Intermediate wave (4) may end within the price territory of the fourth wave of one lesser degree. Minor wave 4 has its range from 2,440.23 to 2,424.25.
Intermediate wave (4) may not move into intermediate wave (1) price territory below 2,398.16.
HOURLY CHART
Click chart to enlarge.
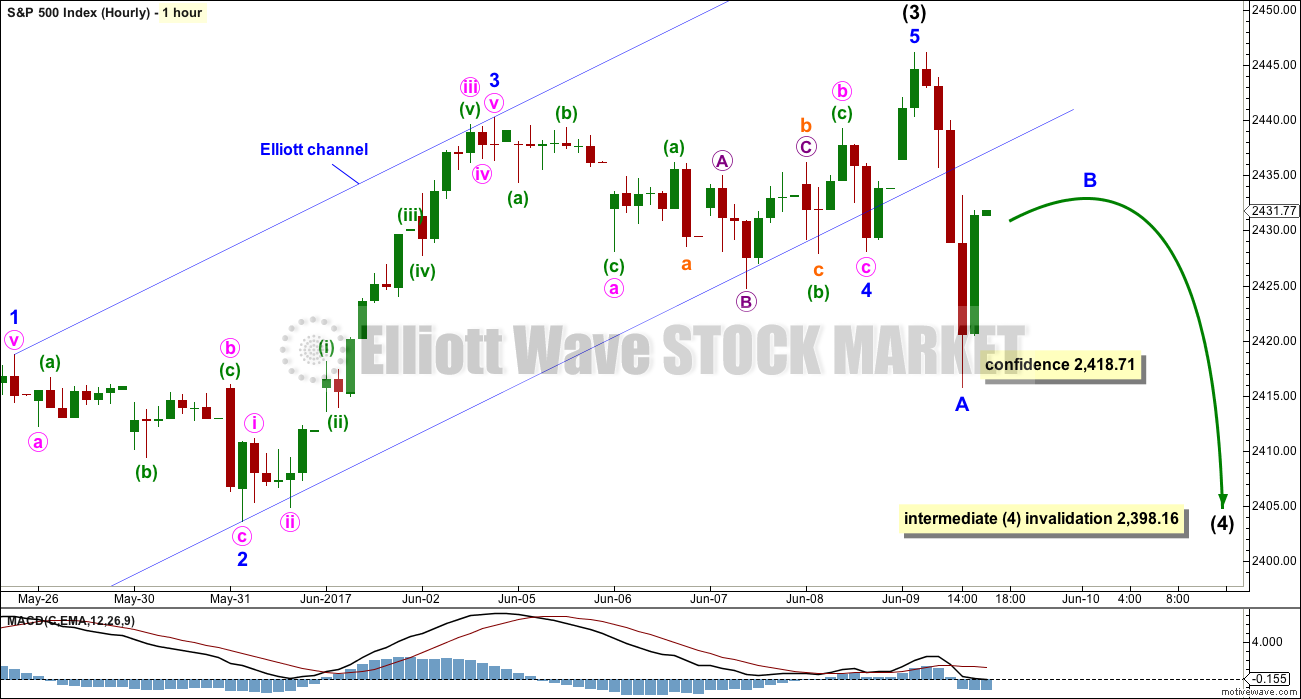
The structure of intermediate wave (3) looks very good on the hourly chart also. Downwards movement during Friday’s session breached the lower edge of the Elliott channel convincingly. A new low below 2,418.71 added confidence in a trend change.
It is impossible to tell if the downwards wave labelled minor wave A is a three wave zigzag or a five wave impulse. It may be either. If it is a three, then minor wave B may make a new all time high as in an expanded flat or running triangle.
Minor wave B may unfold sideways and may last over a week. It may be any one of more than 23 possible corrective structures.
ALTERNATE WEEKLY CHART
Click chart to enlarge.
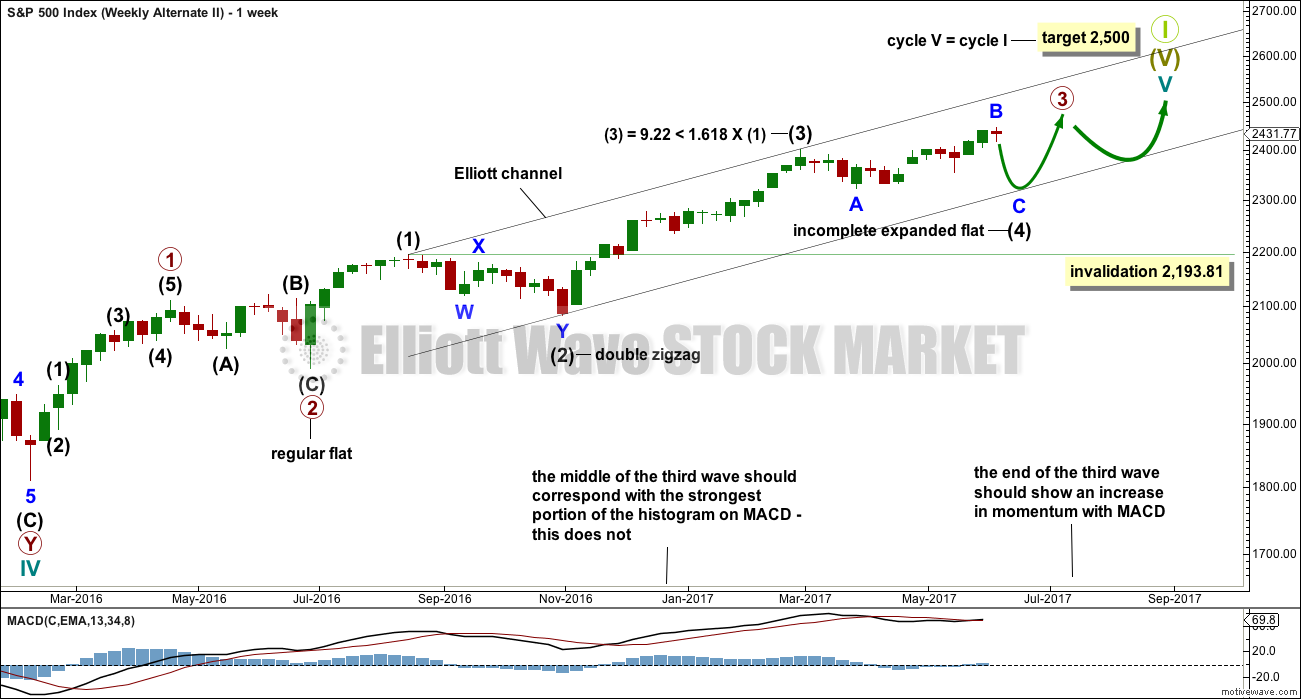
This weekly chart has been published with a slight variation before.
It is still possible that intermediate wave (4) is incomplete and may be continuing as a very common expanded flat correction.
This weekly wave count expects a slow end to Grand Super Cycle wave I at the target at 2,500. Once intermediate wave (4) is over, then intermediate wave (5) would be expected to move above the end of intermediate wave (3) at 2,400.98 to avoid a truncation; it need not make a new all time high (but would be likely to do so).
Thereafter, another multi week sideways correction for primary wave 4 may unfold that must remain above primary wave 1 price territory, which has its extreme at 2,111.05.
Finally, a last upwards wave for primary wave 5 towards the target at 2,500 should show substantial weakness.
This wave count allows for the target at 2,500 to be reached possibly in October.
When looking at upwards movement so far on the monthly chart, the corrections of intermediate waves (2) and (4) show up. This is how the labelling fits best at that time frame.
It is also still possible that the expanded flat correction could be labelled primary wave 4 as per the alternate published here.
ALTERNATE DAILY CHART
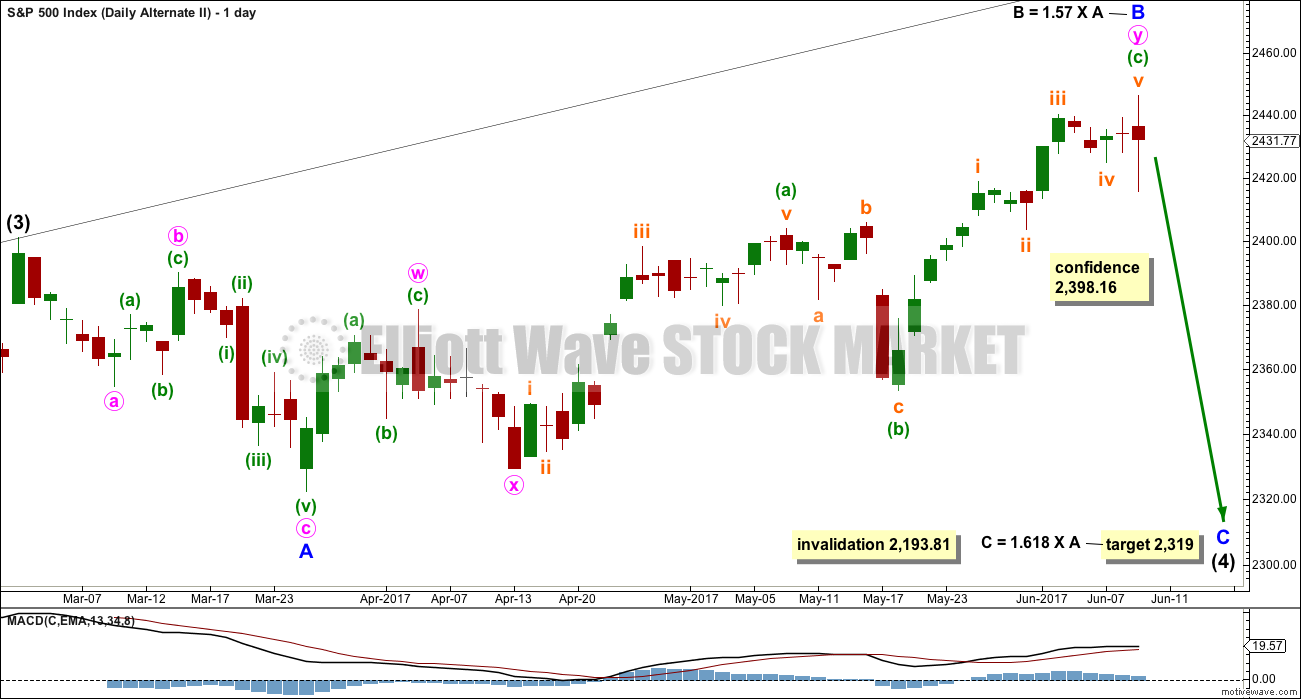
Click chart to enlarge.
Expanded flat corrections are very common structures. They subdivide 3-3-5. Within this one, minor wave B would now be beyond the common range of 1 to 1.38 the length of minor wave A.
The target for minor wave C is recalculated.
The target calculated expects price to find strong support at the lower edge of the black Elliott channel, which is copied over from the weekly chart.
TECHNICAL ANALYSIS
MONTHLY CHART
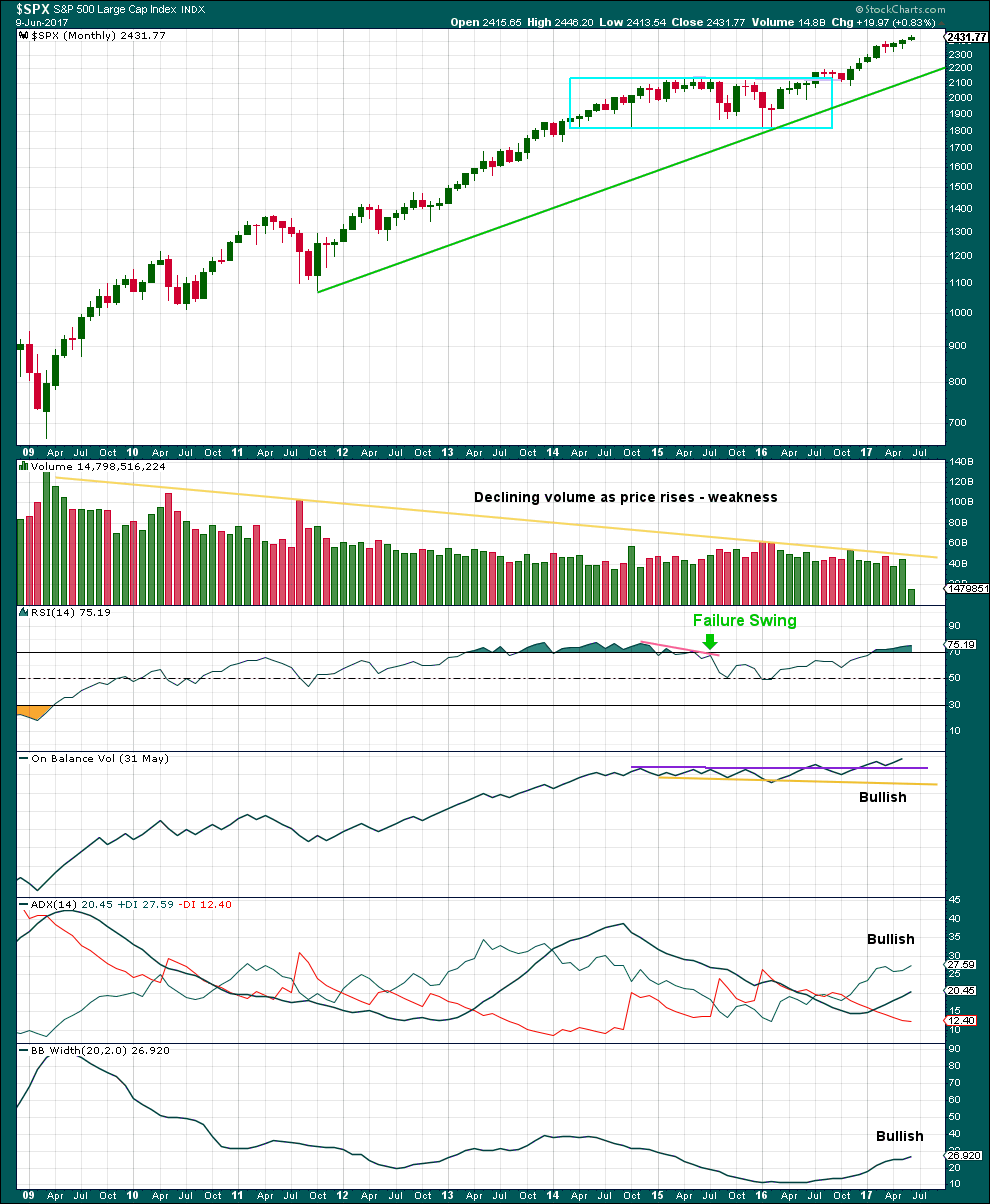
Click chart to enlarge. Chart courtesy of StockCharts.com.
Declining volume is bearish, but this is of no use in picking a high. It only indicates weakness.
There is still long term divergence between price and RSI back to June 2014. Price is making new highs, but RSI has failed to make corresponding new highs. Again, this is of no use in picking a high and only indicates weakness.
On Balance Volume is bullish (give this reasonable weight). ADX is also bullish. In conjunction these two suggest price may continue to rise for some months yet.
The cyan box lasted 27 months. After the breakout, it should be expected that price may continue higher for as many months, if not longer. So far price has been above the box for only 12 months.
The green trend line is a bull market trend line. Expect this line to provide support while price remains above it.
WEEKLY CHART
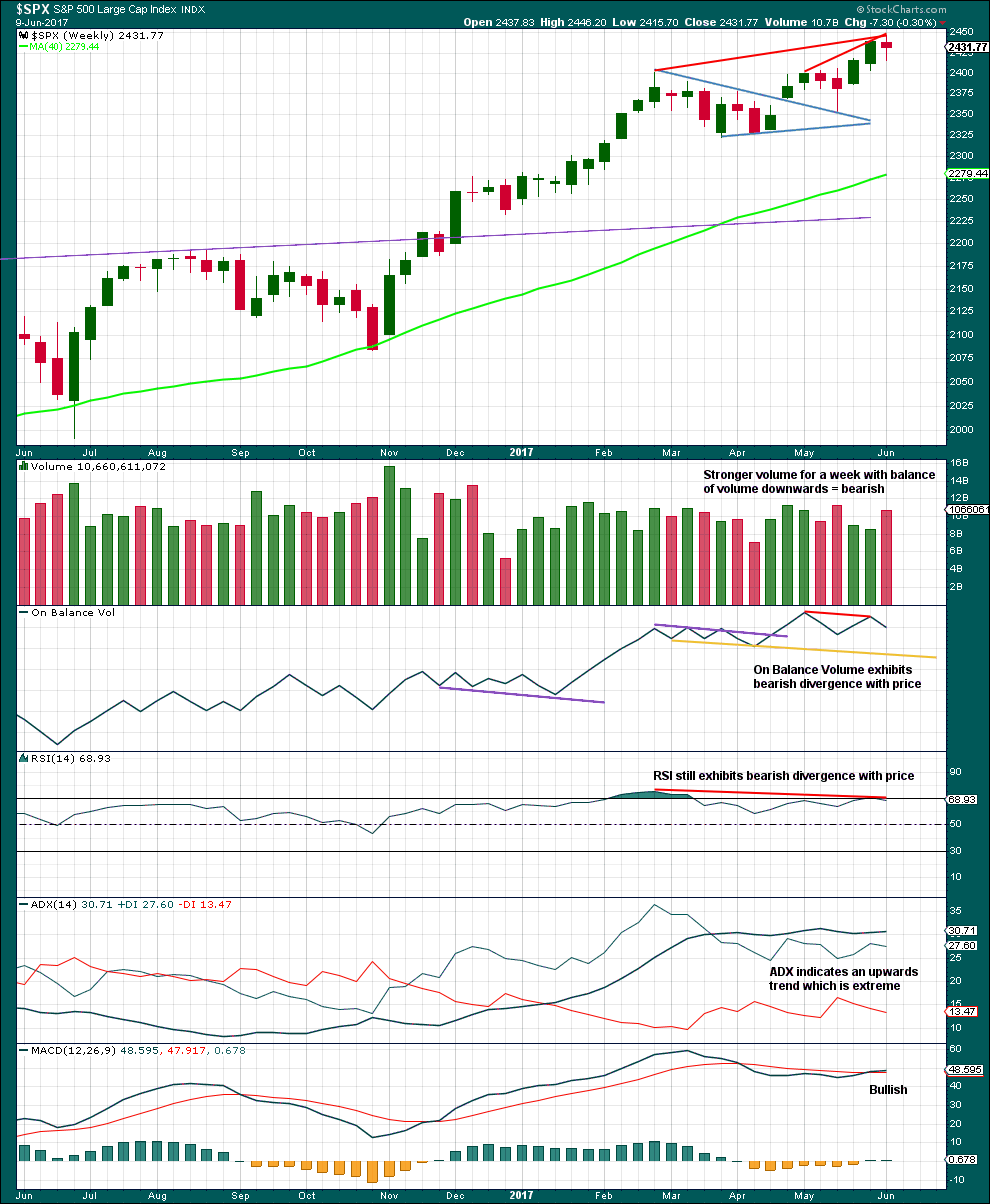
Click chart to enlarge. Chart courtesy of StockCharts.com.
The short term volume profile is bearish.
On Balance Volume gives its last signal as bearish divergence with price.
Divergence with price and RSI is bearish. ADX at extreme is bearish.
Only MACD is bullish.
Look out for a pullback, either here or very soon, within the larger upwards trend to resolve extreme ADX.
DAILY CHART
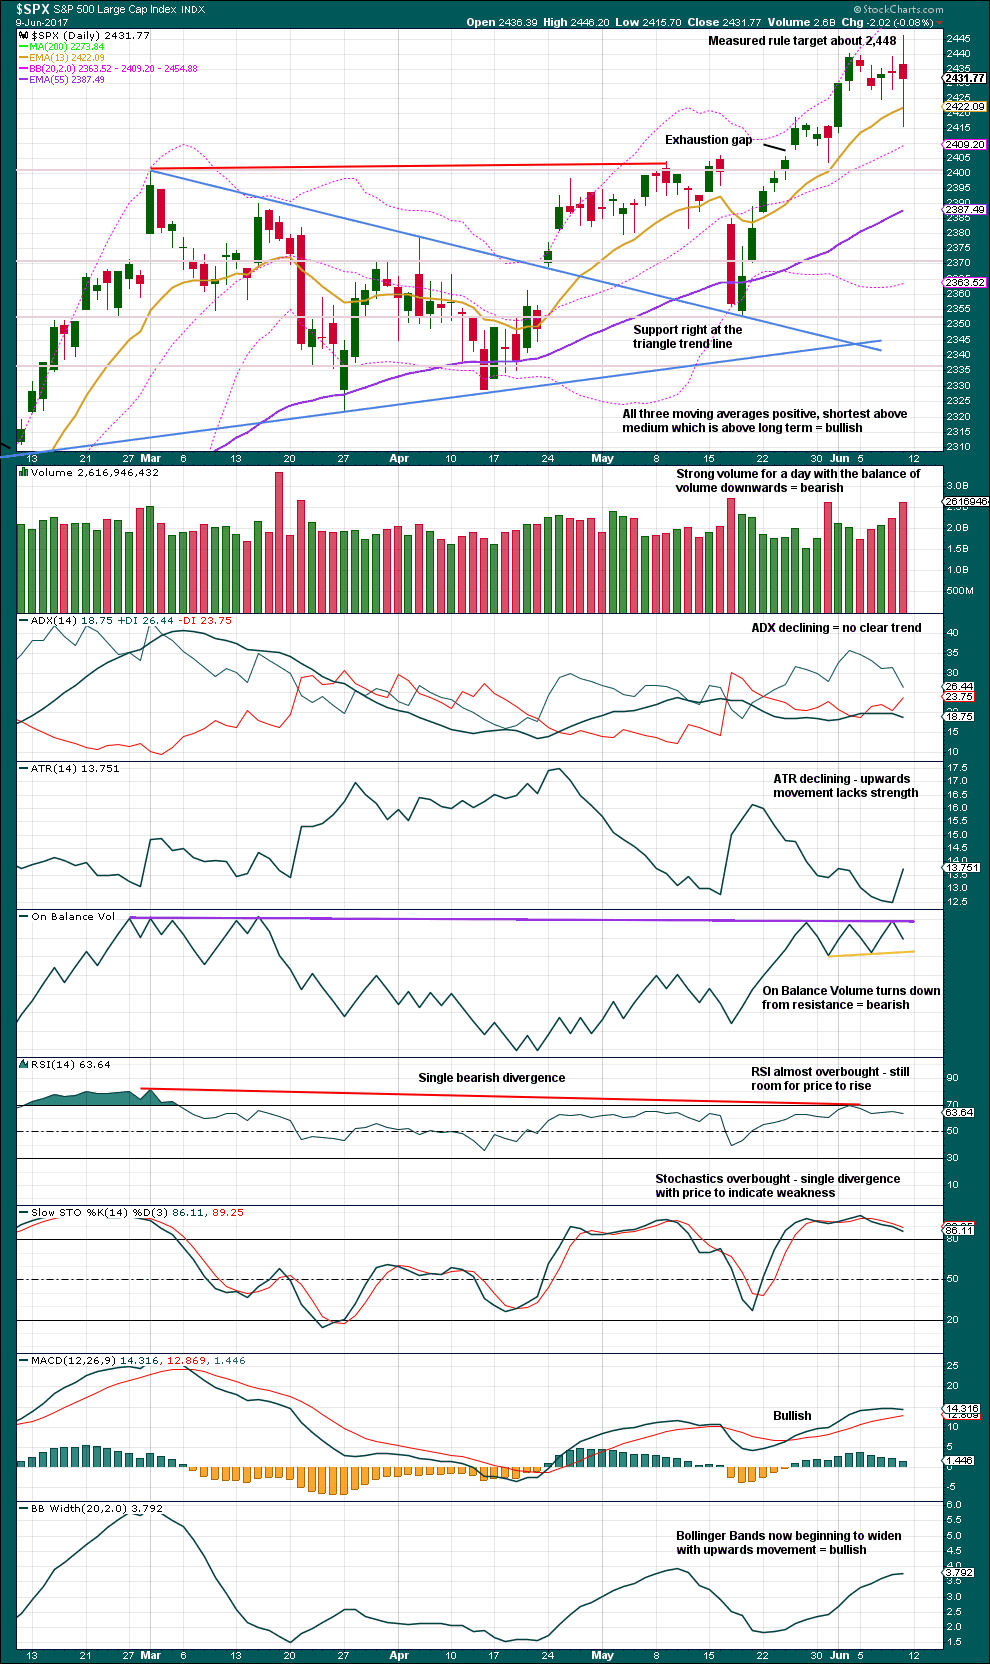
Click chart to enlarge. Chart courtesy of StockCharts.com.
The target about 2,448 given from the measured rule out of the symmetrical triangle was almost reached on Friday. Expect a pullback.
There is strong support about 2,400.
Volume for Friday is bearish.
The spinning top candlestick pattern for Friday puts the trend from up to neutral.
Overall, this daily chart is not as clear as the weekly chart. This daily chart is mixed with bullish and bearish signals.
VOLATILITY – INVERTED VIX CHART
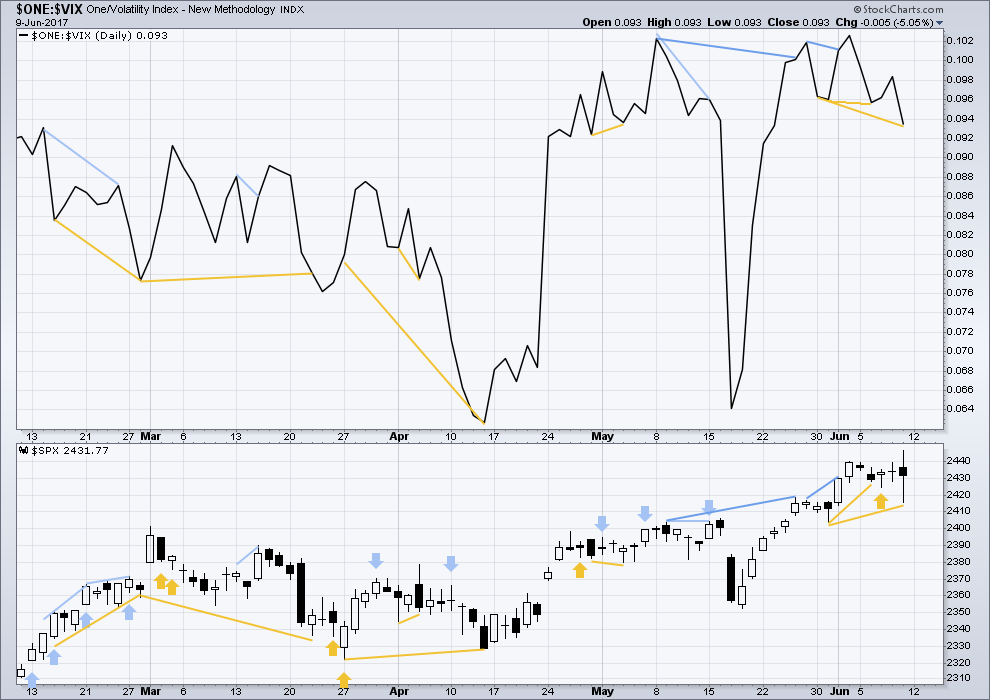
Click chart to enlarge. Chart courtesy of StockCharts.com.
Normally, volatility should decline as price moves higher and increase as price moves lower. This means that normally inverted VIX should move in the same direction as price.
VIX gives another short term bullish signal. This may be followed by one or two upwards days.
BREADTH – AD LINE
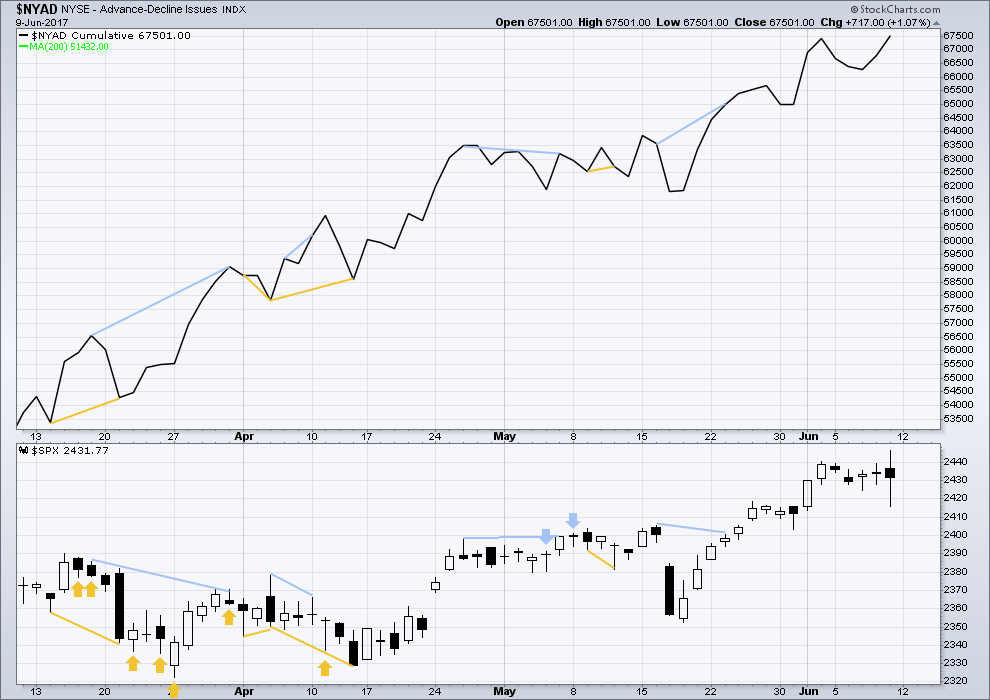
Click chart to enlarge. Chart courtesy of StockCharts.com.
With the last all time high for price, the AD line also made a new all time high. Up to the last high for price there was support from rising market breadth.
There is normally 4-6 months divergence between price and market breadth prior to a full fledged bear market. With no divergence yet at this point, any decline in price should be expected to be a pullback within an ongoing bull market and not necessarily the start of a bear market.
There is no divergence for the short term at this time to indicate weakness.
At the end of this week, it is noted that the mid caps and small caps have now made new all time highs. The rise in price is seen across the range of the market, so it has internal strength.
DOW THEORY
At the end of this week, DJIA, *edit: and Nasdaq and the S&P500 have all both new all time highs. DJT and Nasdaq have failed to confirm an ongoing bull market because the have not yet made new all time highs. However, at this stage that only indicates some potential weakness within the ongoing bull market and absolutely does not mean that DJT and Nasdaq may not yet make new all time highs, and it does not mean a bear market is imminent.
The following lows need to be exceeded for Dow Theory to confirm the end of the bull market and a change to a bear market:
DJIA: 17,883.56.
DJT: 7,029.41.
S&P500: 2,083.79.
Nasdaq: 5,034.41.
Charts showing each prior major swing low used for Dow Theory are here.
This analysis is published @ 01:22 a.m. EST on 11th June, 2017.
A triangle for minor B?
There’s still multiple structural options for minor B. My labelling within it will change over coming days as the structure becomes clearer.
More boring sideways movement ahead I think folks, settle in to watch the paint dry.
Yep! thought we might be seeing a triangle of some sort. Entered from a wave down so it should be good for nice downside scalp on exit for the nimble of feet and/or fingers! 🙂
That reminds me of a German friend I had who had the cutest way of pronouncing fingers. It would come out something like “fing-ers” with a very soft “G”. Some folk just problem with that hard “G” I guess. Kind of like many of my Indian friends who routinely substitute a “W” for the ” V” in my name. 🙂
VIX made a new multi-decade low on Friday as the already massively short volatlity apparently went “all-in.” That should be an interesting unwind…
Nice analysis Lara. Thank you. I appreciate the monthly chart showing some TA information.
I am not sure why you wrote, “DJT and Nasdaq have failed to confirm an ongoing bull market because the have not yet made new all time highs. ” The Nasdaq made a new ATH on Friday at 6341.69 before it dropped over 100 points. NYA and RUT also made new ATHs on Friday. The market is rotating and I think this is a positive development for the bullish case.
Have a great day and remainder of the weekend.
Thanks Rodney, that was my mistake. I will fix it.
I had a fabulous day on Saturday resetting a trap line, helping Kiwi. Found three dead rats in…. quite interesting stages of decomposition. That’s three more predators that can’t harm Kiwi eggs or chicks, and a trap line re baited and re set. And one very exhausted volunteer, covered in mud and feeling most satisfied 🙂 🙂 🙂
Last week I saw a movie on National Geographic called “Wild New Zealand”. It highlighted many animal species and all sorts of neat things from NZ. The Kiwi was highlighted as well. As an amateur naturalist and outdoor enthusiast, I greatly admire your work. Keep up the good work.
I am guessing the rats are not indigenous to New Zealand and they came from Europe on ships. Is that correct?
When Maori arrived they bought rats, but the Kiore are smaller and not so harmful to native species.
When Europeans arrived they bought the Norwegian ship rats and they will eat eggs and kill young chicks.
Dogs are the #1 killer of Kiwi in Northland, usually dogs lost in the bush or taken in by humans who think the rules don’t apply to them. Kiwi don’t have a breast bone because they’re flightless, so a bite on the breast by even a small hand bag sized dog can kill an adult Kiwi. It crushes their lungs.
Kiwi are very vulnerable. They need all the help they can get which is why I do it. And they’re incredibly unusual biologically, and special.
No pix of the three dead rats?
Just thought it might give some hope to some of us tired of the live ones running around Washington D.C. 😀
Well, to be fair they were pretty far gone. Kinda hard to tell what they were originally before decomposition.
An entomologist would have had fun with that 🙂
Got’r done. I’m number 1!
Unfortunately, it looks like I may not be able to exit all longs before the 4th of July when I go on my first mountain expedition. Hmmm.