
Upwards movement was expected. The Elliott wave target has been reached, but the classic technical analysis target using the measured rule has not yet been reached.
Summary: The target for a third wave is met and the structure is complete. If price keeps rising, then use the classic target at 2,448.
If the smaller pink channel on the hourly chart is breached by downwards (not sideways) movement, expect a pullback has begun. The target range is 2,418.71 to 2,403.62.
While price remains within the channel, accept the possibility price may continue higher and that the target was wrong.
New updates to this analysis are in bold.
Last monthly and weekly charts are here. Last historic analysis video is here.
MAIN ELLIOTT WAVE COUNT
WEEKLY CHART
Click chart to enlarge.
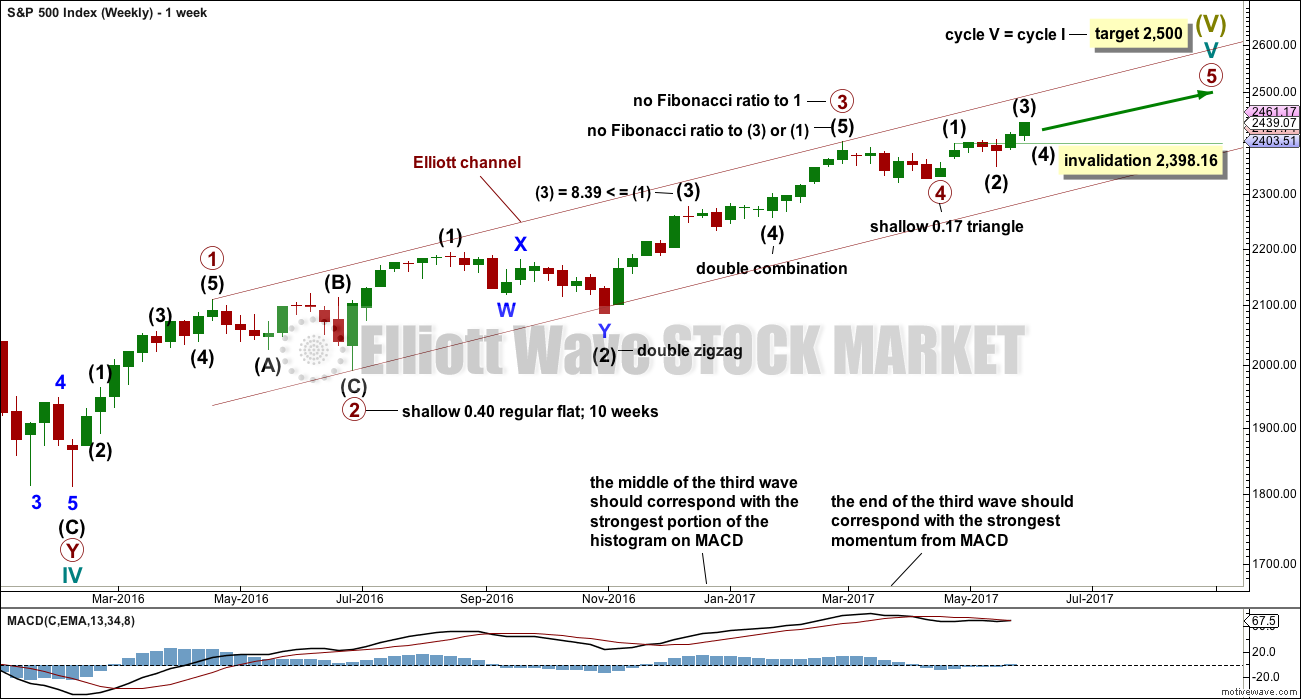
This wave count has a better fit with MACD and so may have a higher probability.
Primary wave 3 may be complete, falling short of 1.618 the length of primary wave 1 and not exhibiting a Fibonacci ratio to primary wave 1. There is a good Fibonacci ratio within primary wave 3.
The target for cycle wave V will remain the same, which has a reasonable probability. At 2,518 primary wave 5 would reach 0.618 the length of primary wave 1. If the target at 2,500 is exceeded, it may not be by much.
There is alternation between the regular flat correction of primary wave 2 and the triangle of primary wave 4.
Within primary wave 3, there is alternation between the double zigzag of intermediate wave (2) and the double combination of intermediate wave (4).
If primary wave 4 is over and primary wave 5 is underway, then within primary wave 5 intermediate wave (2), if it moves lower, may not move beyond the start of intermediate wave (1) below 2,344.51 (this point is taken from the triangle end on the daily chart).
DAILY CHART
Click chart to enlarge.
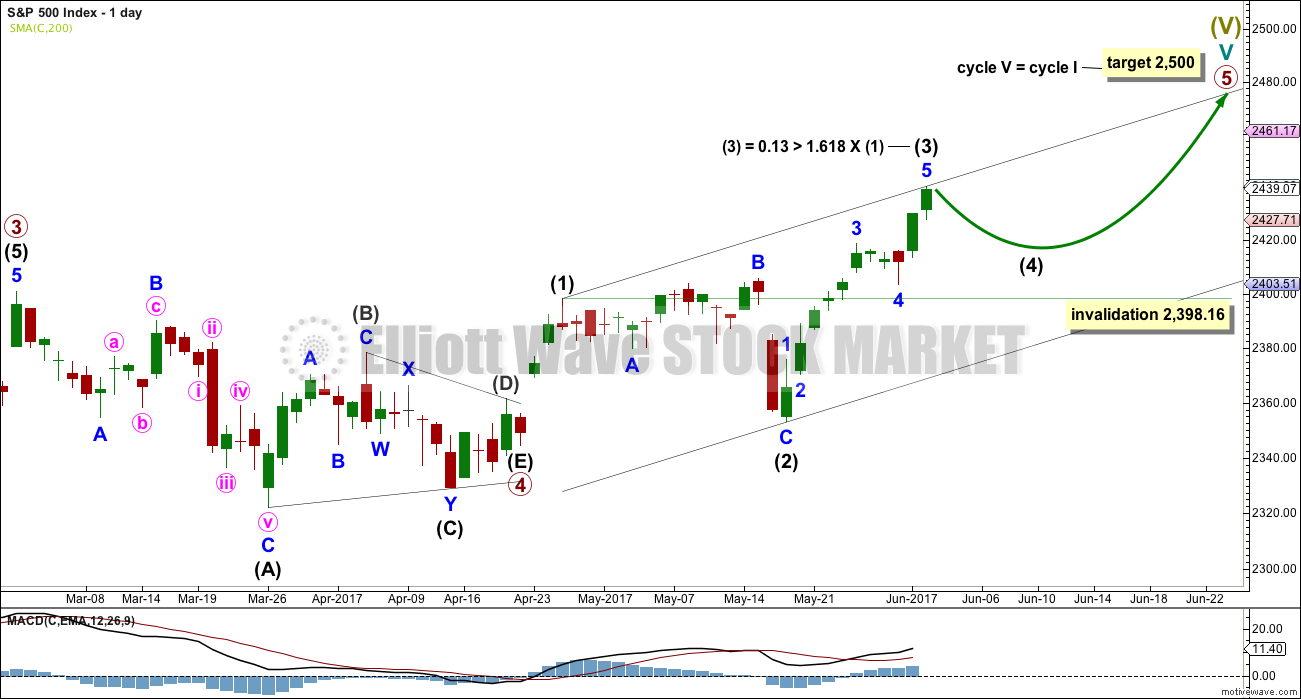
Primary wave 5 must complete as a five wave motive structure, either an impulse (more common) or an ending diagonal (less common). So far, if this wave count is correct, it looks like an impulse.
Intermediate wave (3) is now a complete structure on the hourly chart and has reached a common Fibonacci ratio to intermediate wave (1). It may be complete here.
Intermediate wave (4) may not move into intermediate wave (1) price territory below 2,398.16.
Intermediate wave (4) may end within the price territory of the fourth wave of one lesser degree. Minor wave 4 has its range from 2,418.71 to 2,403.62.
Copy the Elliott channel over to the hourly chart.
HOURLY CHART
Click chart to enlarge.
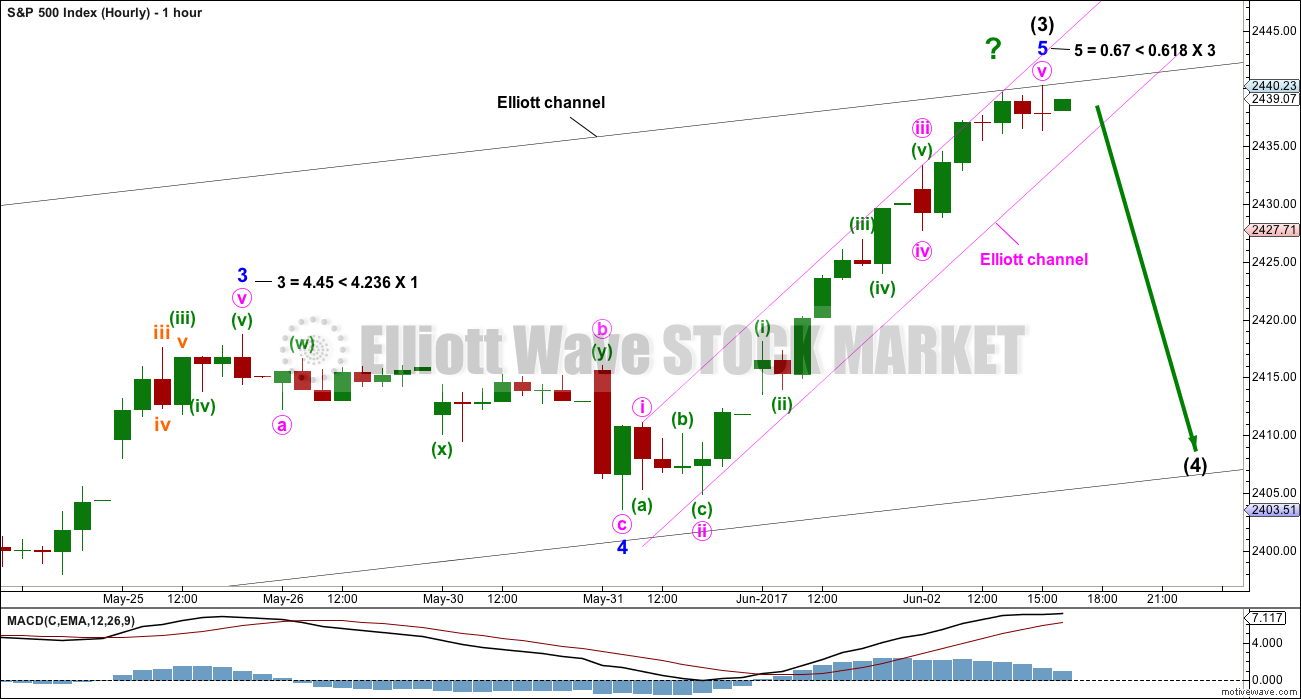
Within intermediate wave (3), there are Fibonacci ratios between all three actionary waves of minor waves 1, 3 and 5. Intermediate wave (3) also exhibits a Fibonacci ratio to intermediate wave (1).
Add a small channel about minor wave 5. If this channel is breached by clear downwards movement, not sideways, that may be an early indication that intermediate wave (3) is over and intermediate wave (4) is underway. Accept price may just continue higher while it remains within this pink channel.
Although this wave count shows an expectation of downwards movement next week, at this stage there is zero confirmation of a high in place. This is time to protect long positions by pulling up stops, or exit and wait for some clarity. This is not the time to enter short.
Intermediate wave (1) lasted three days. Intermediate wave (2) lasted 16 days. Intermediate wave (3), if it is over, would have lasted 10 days. Intermediate wave (4) may last about eight or 13 days.
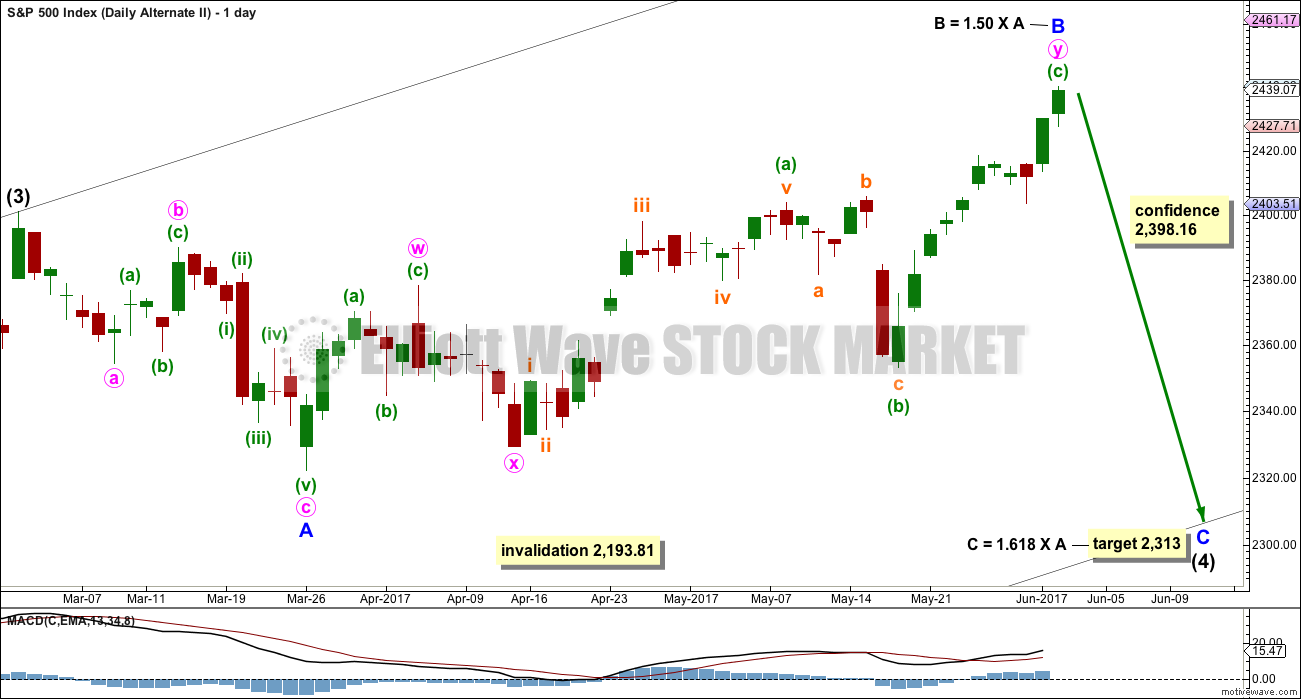
ALTERNATE WEEKLY CHART
Click chart to enlarge.
This weekly chart has been published with a slight variation before.
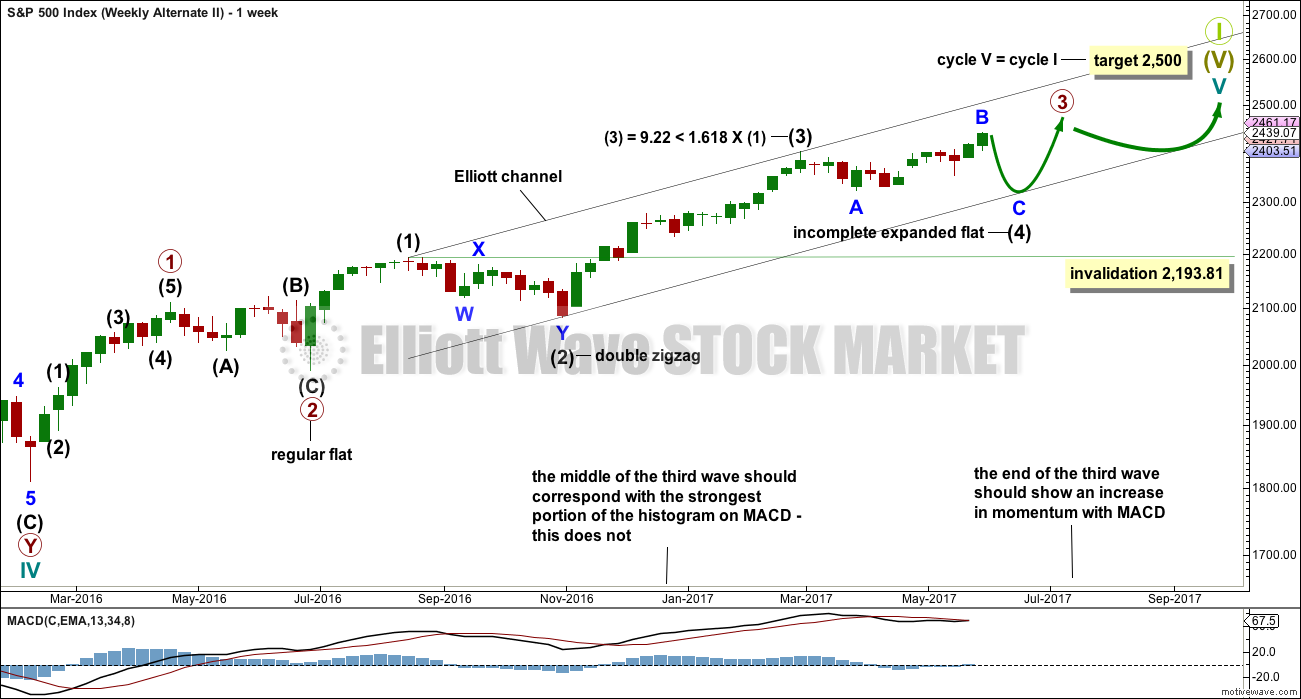
It is still possible that intermediate wave (4) is incomplete and may be continuing as a very common expanded flat correction.
This weekly wave count expects a slow end to Grand Super Cycle wave I at the target at 2,500. Once intermediate wave (4) is over, then intermediate wave (5) would be expected to move above the end of intermediate wave (3) at 2,400.98 to avoid a truncation; it need not make a new all time high (but would be likely to do so).
Thereafter, another multi week sideways correction for primary wave 4 may unfold that must remain above primary wave 1 price territory, which has its extreme at 2,111.05.
Finally, a last upwards wave for primary wave 5 towards the target at 2,500 should show substantial weakness.
This wave count allows for the target at 2,500 to be reached possibly in October.
When looking at upwards movement so far on the monthly chart, the corrections of intermediate waves (2) and (4) show up. This is how the labelling fits best at that time frame.
It is also still possible that the expanded flat correction could be labelled primary wave 4 as per the alternate published here.
ALTERNATE DAILY CHART
Click chart to enlarge.
Expanded flat corrections are very common structures. They subdivide 3-3-5. Within this one, minor wave B would now be just beyond the common range of 1 to 1.38 the length of minor wave A.
The target for minor wave C is recalculated.
The target calculated expects price to find strong support at the lower edge of the black Elliott channel, which is copied over from the weekly chart.
TECHNICAL ANALYSIS
WEEKLY CHART
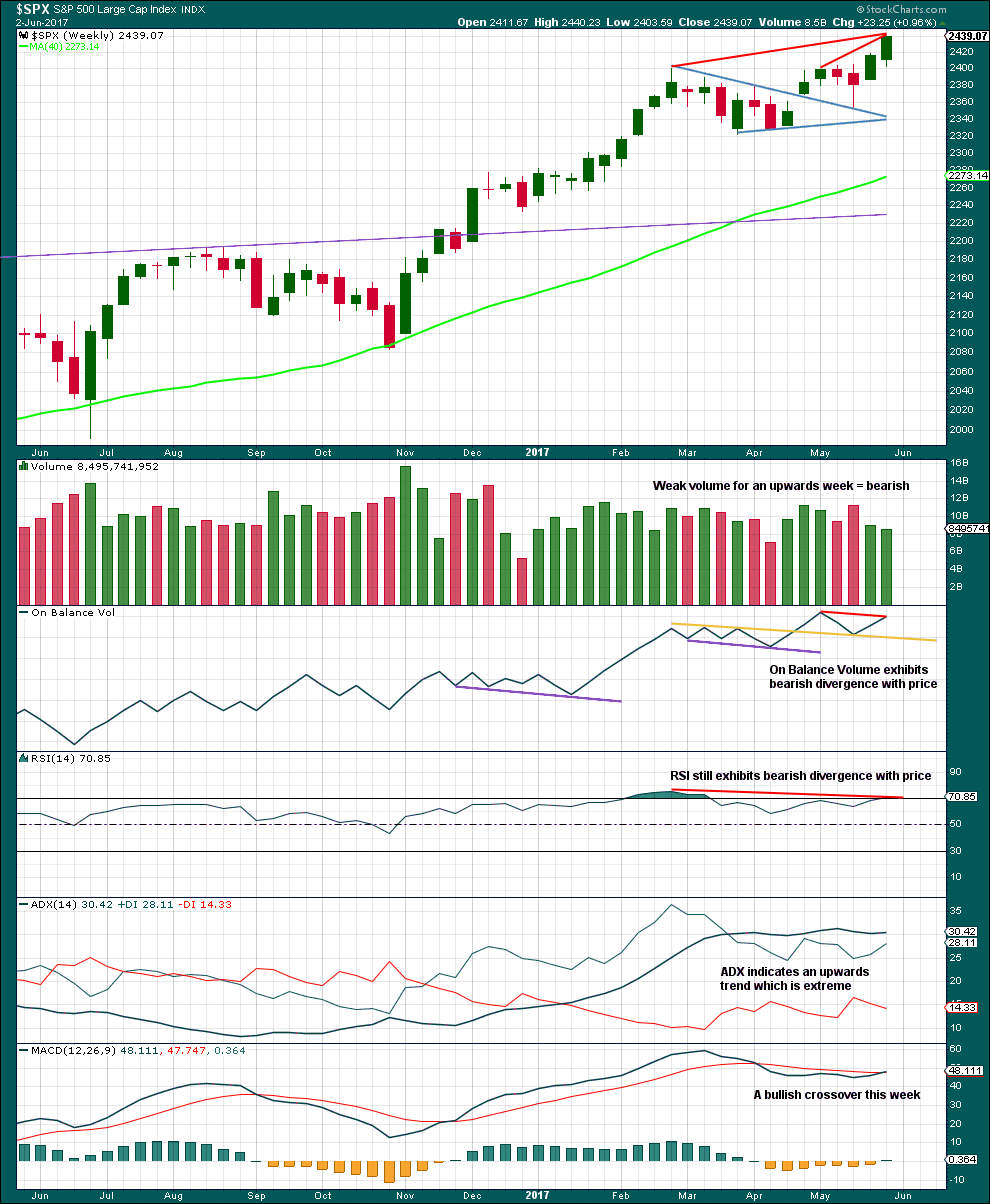
Click chart to enlarge. Chart courtesy of StockCharts.com.
The yellow trend line on On Balance Volume is adjusted this week. On Balance Volume gives the most recent signal as a weak bearish divergence with price.
Volume is bearish. RSI divergence is bearish. ADX at extreme is bearish.
MACD is now bullish.
Although this chart is bearish, we have been here before. The reality is price keeps rising although indicators are bearish. This bearishness should tell traders to protect long positions with stops, and be aware the market is currently vulnerable to a pullback. It does not tell traders to enter short here; that would be premature.
DAILY CHART
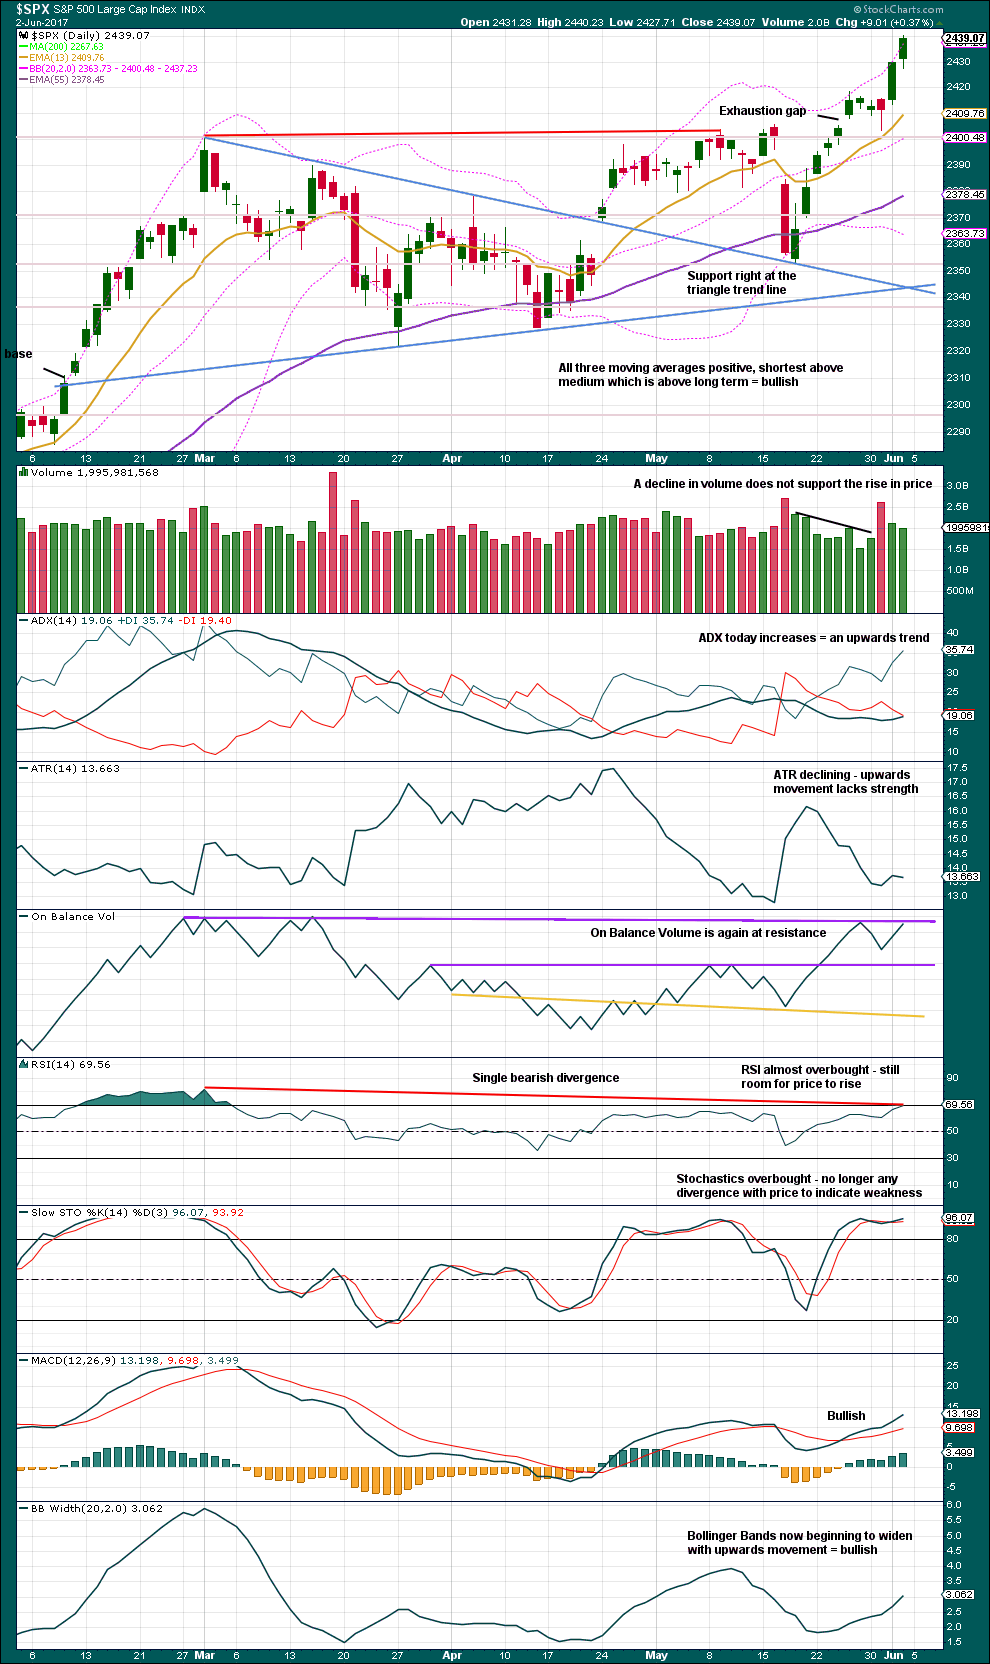
Click chart to enlarge. Chart courtesy of StockCharts.com.
If the widest part of the symmetrical triangle is taken from the high of the 1st of March to the low of the 27th of March, then a measured rule target would be at 2,448. If price continues a little higher next week, then use this target for long positions.
Trend lines on the symmetrical triangle are very slightly adjusted today to sit as perfectly as possible. About Friday’s session is the point in which the triangle trend lines cross over, so look out for a possible trend change here.
Volume is bearish, but this does not mean the rise in price must stop here. This has happened before multiple times on this chart yet price continued higher.
ADX is bullish. MACD is bullish. Bollinger Bands are bullish.
ATR indicates weakness within this trend. RSI divergence indicates weakness.
Stochastics no longer indicates weakness and may remain extreme for long periods of time during a trending market.
The strongest piece of technical analysis on this chart is On Balance Volume. Because it is at resistance now, expect a downwards reaction on Monday as fairly likely.
VOLATILITY – INVERTED VIX CHART
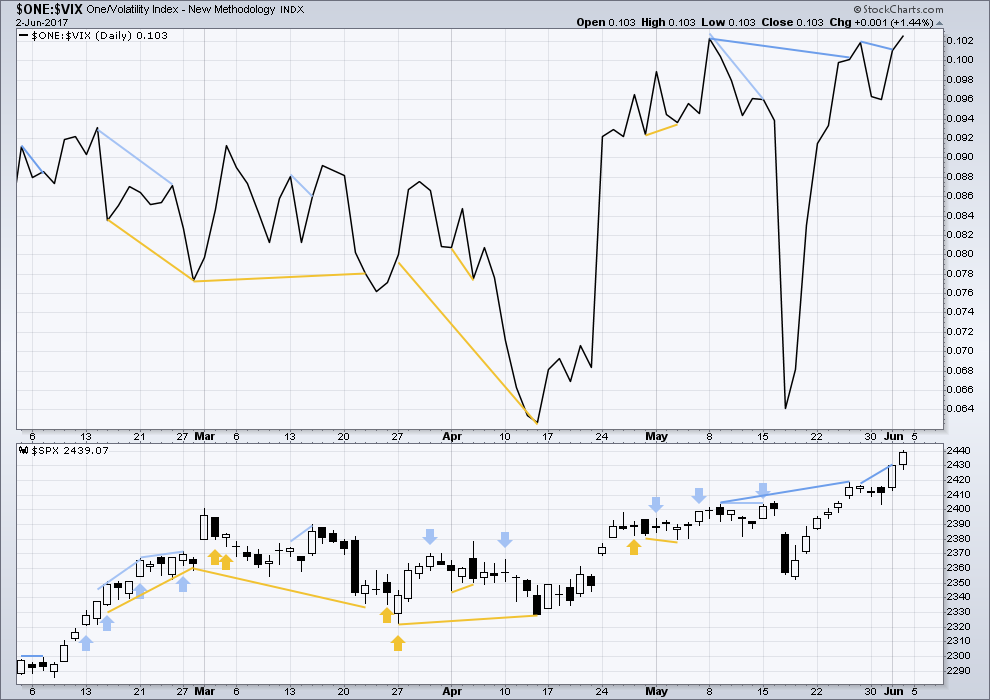
Click chart to enlarge. Chart courtesy of StockCharts.com.
Normally, volatility should decline as price moves higher and increase as price moves lower. This means that normally inverted VIX should move in the same direction as price.
Short term bearish divergence has disappeared, so it is considered to have failed. A new all time high for price is accompanied by a new all time high for inverted VIX. The rise in price corresponds with a normal decline in volatility.
BREADTH – AD LINE
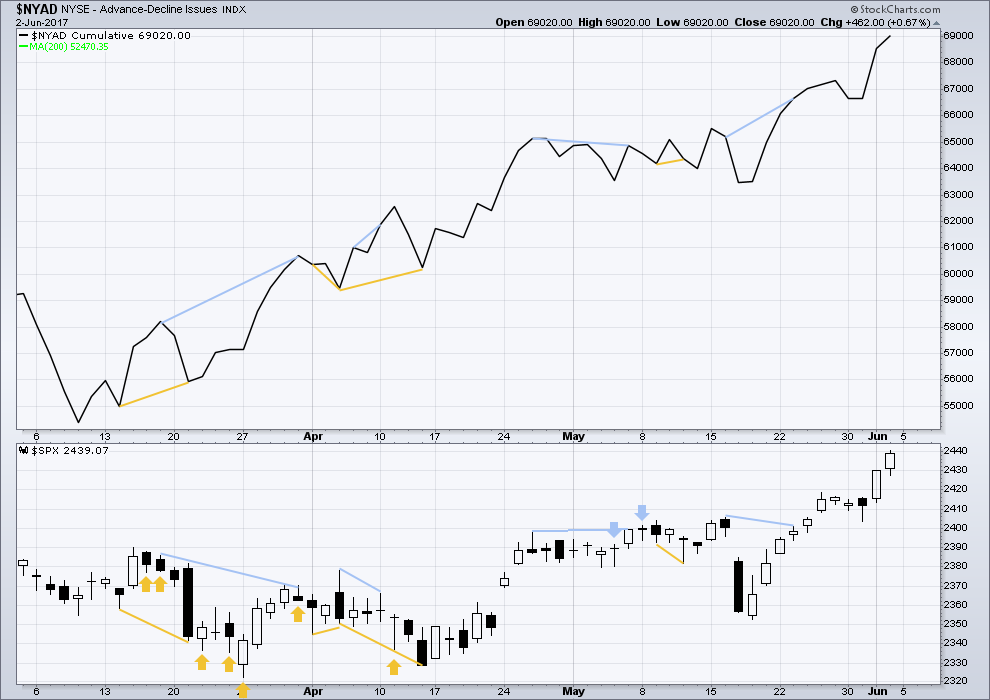
Click chart to enlarge. Chart courtesy of StockCharts.com.
With the last all time high for price, the AD line also made a new all time high. Up to the last high for price there was support from rising market breadth.
There is normally 4-6 months divergence between price and market breadth prior to a full fledged bear market. With no divergence yet at this point, any decline in price should be expected to be a pullback within an ongoing bull market and not necessarily the start of a bear market.
Price made new all time highs today and the AD line also made new all time highs. This rise in price is supported by a rise in market breadth; it has some internal strength. There is no weakness at the end of this week from market breadth to indicate a pullback should begin here.
At the end of this week, it is noted that the mid caps and small caps have failed to make new all time highs. There is some internal weakness with increasing selectivity in this market.
DOW THEORY
At the end of this week, Nasdaq, DJIA and the S&P500 have all made new all time highs. DJT has failed to confirm an ongoing bull market because it has not yet made a new all time high. However, at this stage that only indicates some potential weakness within the ongoing bull market and absolutely does not mean that DJT may not yet make new all time highs, and it does not mean a bear market is imminent.
The following lows need to be exceeded for Dow Theory to confirm the end of the bull market and a change to a bear market:
DJIA: 17,883.56.
DJT: 7,029.41.
S&P500: 2,083.79.
Nasdaq: 5,034.41.
Charts showing each prior major swing low used for Dow Theory are here.
This analysis is published @ 02:20 a.m. EST on 3rd June, 2017.
I’m suspicious that we’ll see any real pullback. Despite persistent bearishness in indicators, particularly ADX weekly extreme, it hasn’t happened yet.
This market is different. In EW terms because this is the end of cycle, Super Cycle and Grand Super Cycle. That’s a once in a generation trend change coming up, and if this count is correct it could be this year.
If my count is wrong it’s possible cycle V may extend, and last another one to few years.
EW does have a tendency to call trend changes early. That’s probably it’s biggest fault.
Anyway, while the hourly and daily wave counts are calling for a pullback. The pink channel is breached, that’s the earliest indication we may have a correction beginning. But the S&P has a tendency to breach channels but continue in the same old direction. There is still reasonable risk to going short. Invest only 1-3% of equity here due to reasonable risk. If you have a loss make sure it’s acceptable to your account.
Stops at the last ATH please. Acknowledge risk if taking a punt on the short side. Profit target lower edge of minor 4 at 2,403 for now, this may have to be moved higher.
Tendency for rounding tops notwithstanding, today again looking like consolidation to me. I fully expect it to characteristically clamber back inside that channel. Deja Vu all over again!
😉
I guess this was the “pigment” of my imagination when I thought I was seeing a CED on Friday . Awful proportions! 🙂
Yeah… that doesn’t look right at all 🙂
I’m seeing some pretty massive VIX call buying; but we have seen that time and time before. All up to central banks apparently, but I’m slowly building into a NASDAQ short out of principle, no real technical signal. (likely wrong), but still a great risk reward set up based on the next pivot.
The market continues to bewilder. Lone new ATH in Nasdaq Composite today.
There was a time when I would not hesitate to trade most upper BB penetrations in a RTM trade but lately that has been a crap shoot. We have been seeing extended pins against upper B bands or price trade sideways for days on end with no real mean price reversion. I was originally planning to layer into a short position but am instead going to wait, as Lara suggests for a trend change confirmation. Even an intermediate degree wave down should be good for 3-5% and a few hours head start should not make too great a profit difference. Maybe futures will tell us more. It has been more than ridiculous watching each five wave impulse down being promptly arrested and reversed to the upside. A time to be patient it seems…
Yes, the 5 waves down to frantic VIX slam, plus futures buy is really getting old. Rates, both short term and long term have good opportunities for arb here as well.
So right in your comment about us being here before. Like one wise philosopher said- Deja Vu all over again!
It truly is remarkable how price continues to rise in the face of all the otherwise bearish indicators that would suggest otherwise. In virtually every case recently sideways movement has turned out to be a period of consolidation with an upside break-out. Another common feature has been a long lower wick signaling the impending upside move.
One thing I have opined is that if bearish signals are not necessarily telling us anything about market direction, how can we be certain that bullish ones are?
For the first time in all the dozens of articles I read every week, one analyst who was also expecting the completion of an expanded flat for a fourth wave, is now musing about whether the current impulse up could be a terminal E wave of a huge bearish rising wedge off the November lows. Interesting food for thought. If he is correct, this impulse up has quite a bit more juice, but could also be the last hurrah…
Interesting reading this week-end. A few serious analysts are starting to talk about a “perpetual bull run”. Among them are Steve Sjuggerude of Stansberry Research, who is actually stating that he is expecting a “melt-up” in equities with DJI literally doubling from this point to over 51,000.00, and Chris Vermuellen. Chris’ take is particularly interesting in that while Sjug expects the blow-off top to be followed by an inevitable collapse, Vermuellen actually believes that CB liquidity can forever sustain both mood and price. Here is a link to his take:
http://www.safehaven.com/article/44446/us-equities-extend-channel-possibly-into-super-bull-run
If Stansberry is printing something bullish and it’s not gold, I’ll short that all day!!!!!!!! Those doomsdayers couldn’t trade their way out of a paper bag IMHO 🙂
I have to say Steve has been right about this bull market now for years even when I had serious doubts about his intractable bullishness, but this most recent call is a bit much. I must be founded on a thesis that the equity markets are now totally disconnected from economic reality; I don’t think so… Porter is the one who has been yelling that the sky is falling for some time now. He is right about the coming credit disaster but was way too early. 🙂
Hey,hey, hey…. Yogi. Smarter than the average bear. #1 for the weekend.
Have a good one all and if you catch a Kiwi, let her/him go.
Bird, fruit or person?
All of the above 🙂