
Upwards movement was expected to continue. The targets remain the same.
Summary: The target is at 2,440 (Elliott wave target) to 2,448 (classic analysis target). Expect upwards movement to continue. Corrections are an opportunity to add to long positions.
In the short term, a new low now below 2,398.16 would indicate a deeper pullback may be underway.
New updates to this analysis are in bold.
Last monthly and weekly charts are here. Last historic analysis video is here.
MAIN ELLIOTT WAVE COUNT
WEEKLY CHART
Click chart to enlarge.
This wave count has a better fit with MACD and so may have a higher probability.
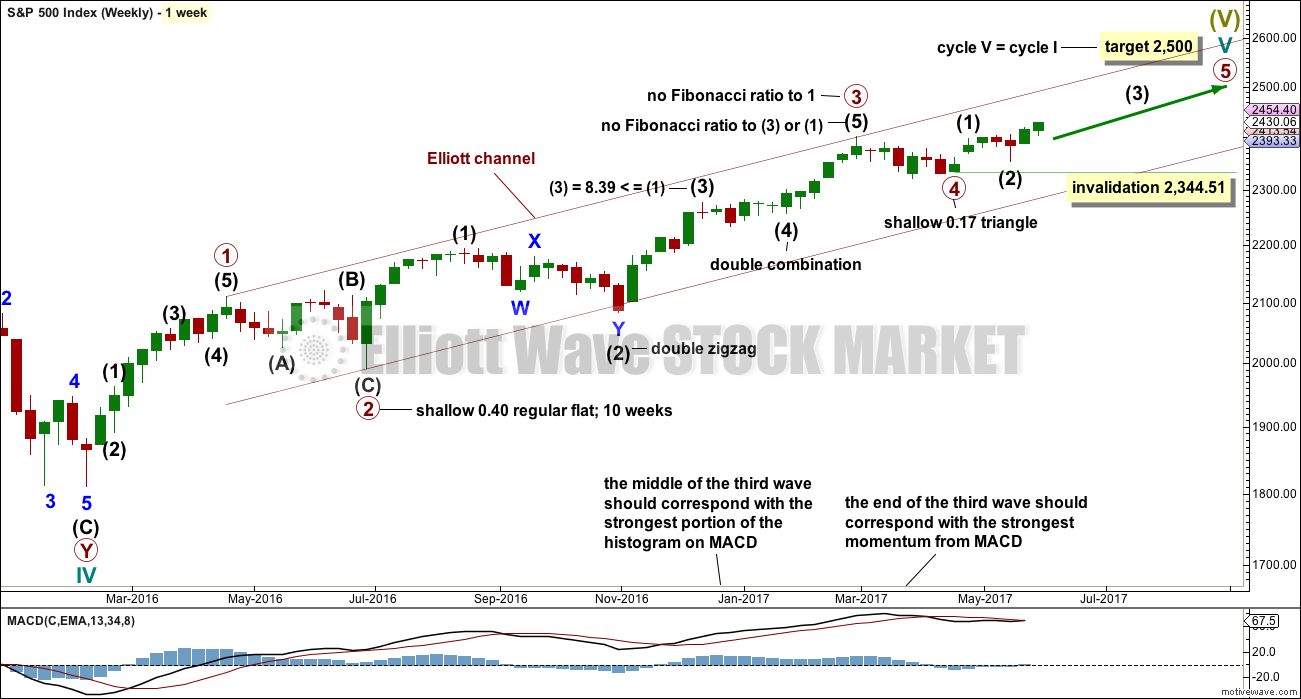
Primary wave 3 may be complete, falling short of 1.618 the length of primary wave 1 and not exhibiting a Fibonacci ratio to primary wave 1. There is a good Fibonacci ratio within primary wave 3.
The target for cycle wave V will remain the same, which has a reasonable probability. At 2,518 primary wave 5 would reach 0.618 the length of primary wave 1. If the target at 2,500 is exceeded, it may not be by much.
There is alternation between the regular flat correction of primary wave 2 and the triangle of primary wave 4.
Within primary wave 3, there is alternation between the double zigzag of intermediate wave (2) and the double combination of intermediate wave (4).
If primary wave 4 is over and primary wave 5 is underway, then within primary wave 5 intermediate wave (2), if it moves lower, may not move beyond the start of intermediate wave (1) below 2,344.51 (this point is taken from the triangle end on the daily chart).
DAILY CHART
Click chart to enlarge.
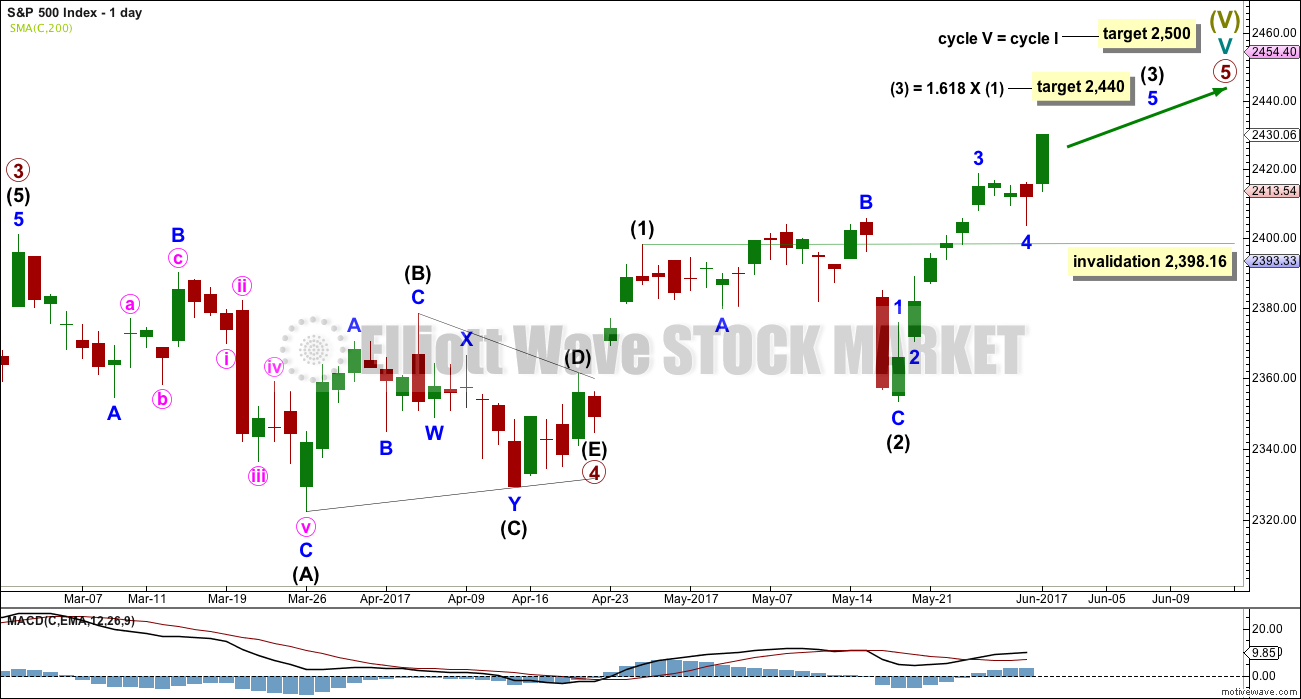
Primary wave 5 must complete as a five wave motive structure, either an impulse (more common) or an ending diagonal (less common). So far, if this wave count is correct, it looks like an impulse.
Intermediate wave (3) is now far enough developed to move the invalidation point up. If intermediate wave (4) begins shortly, it may not move into intermediate wave (1) price territory below 2,398.16.
Intermediate wave (3) may only subdivide as an impulse structure.
HOURLY CHART
Click chart to enlarge.
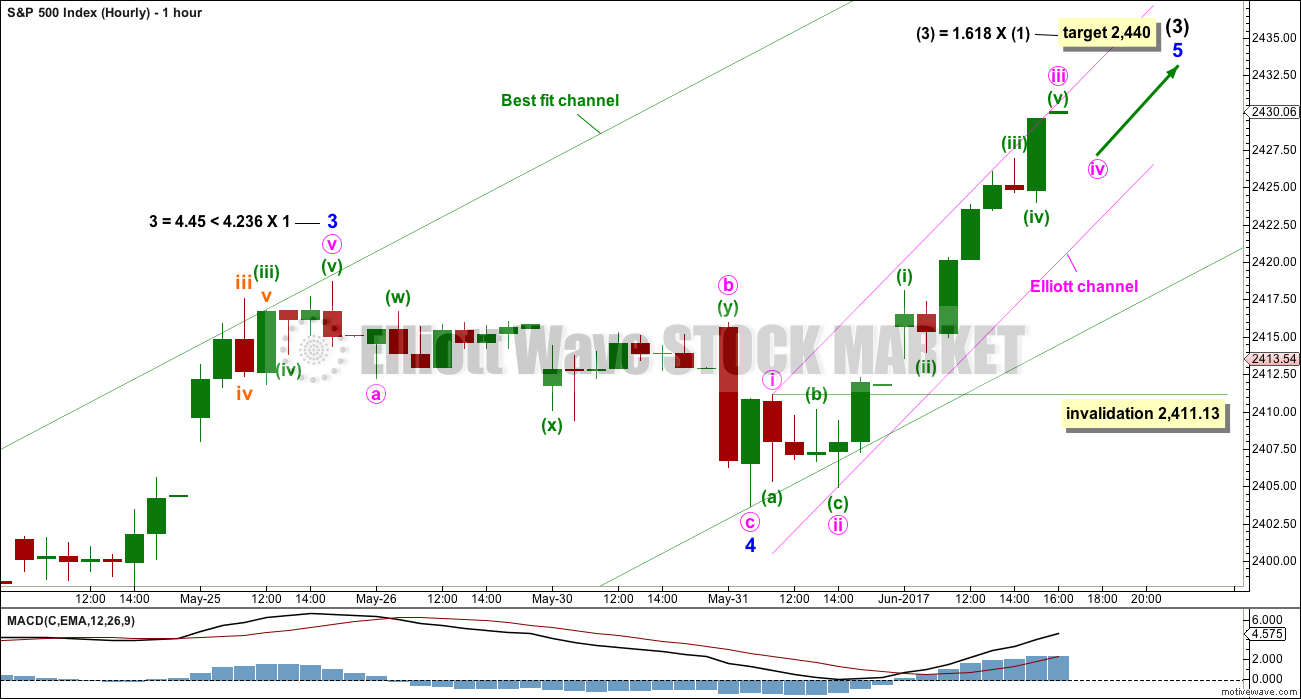
A best fit channel is again drawn about intermediate wave (3). The first trend line is drawn from the start at the low for the 18th of May to the low of minor wave 4. A parallel copy is placed upon the high of minor wave 3. Now that minor wave 4 is over, this channel might show when intermediate wave (3) is over when price clearly breaches it with downwards movement.
A smaller Elliott channel is drawn about minor wave 5. So far the structure of minor wave 5 looks incomplete.
Because minor wave 3 exhibits a Fibonacci ratio to minor wave 1, minor wave 5 may not exhibit a Fibonacci ratio to either of minor waves 3 or 1. The target is left calculated at intermediate degree.
Within minor wave 5, the upcoming correction for minute wave iv should be brief and shallow. It may not move back into minute wave i price territory below 2,411.13.
ALTERNATE WEEKLY CHART

Click chart to enlarge.
This weekly chart has been published with a slight variation before.
It is still possible that intermediate wave (4) is incomplete and may be continuing as a very common expanded flat correction.
This weekly wave count expects a slow end to Grand Super Cycle wave I at the target at 2,500. Once intermediate wave (4) is over, then intermediate wave (5) would be expected to move above the end of intermediate wave (3) at 2,400.98 to avoid a truncation; it need not make a new all time high (but would be likely to do so).
Thereafter, another multi week sideways correction for primary wave 4 may unfold that must remain above primary wave 1 price territory, which has its extreme at 2,111.05.
Finally, a last upwards wave for primary wave 5 towards the target at 2,500 should show substantial weakness.
This wave count allows for the target at 2,500 to be reached possibly in October.
When looking at upwards movement so far on the monthly chart, the corrections of intermediate waves (2) and (4) show up. This is how the labelling fits best at that time frame.
It is also still possible that the expanded flat correction could be labelled primary wave 4 as per the alternate published in yesterday’s analysis here.
ALTERNATE DAILY CHART
Click chart to enlarge.
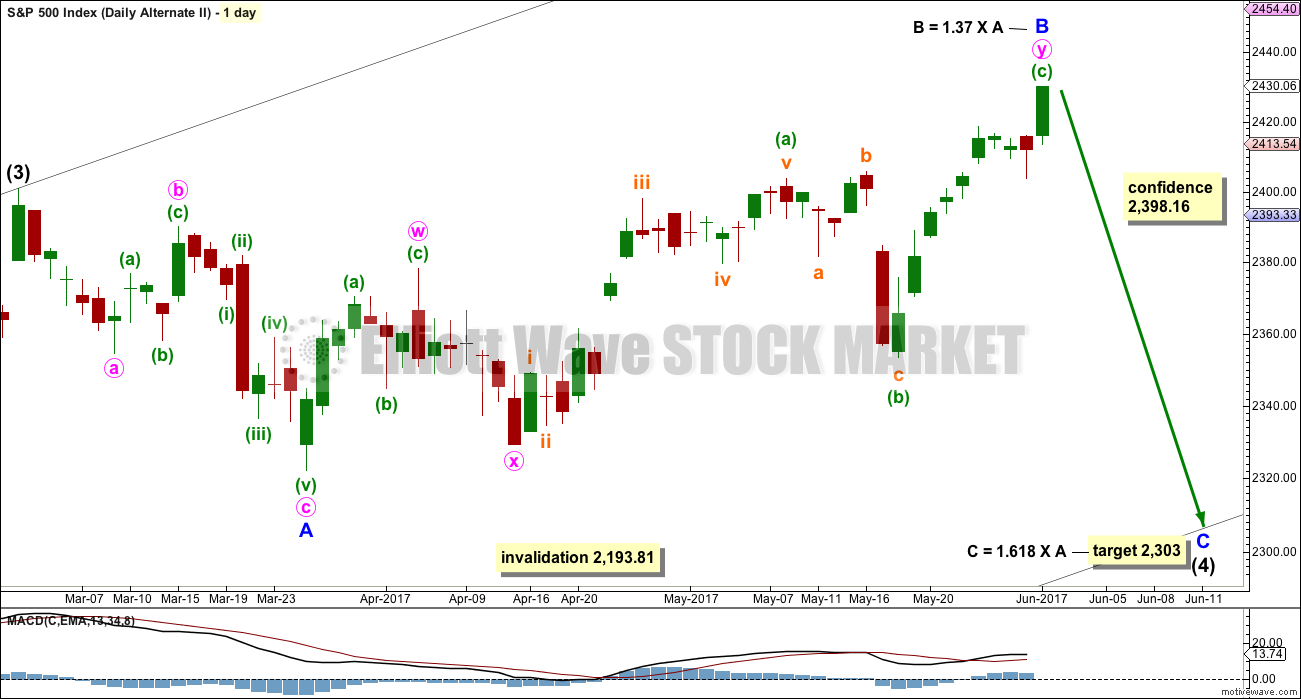
Expanded flat corrections are very common structures. They subdivide 3-3-5. Within this one, minor wave B would now still be within the common range of 1 to 1.38 the length of minor wave A.
The target now calculated for minor wave C assumes that minor wave B is over at today’s high. If minor wave B moves higher, then this target must also move correspondingly higher.
The target calculated expects price to find strong support at the lower edge of the black Elliott channel, which is copied over from the weekly chart.
This alternate wave count expects and imminent very strong fall for price to last at least about three weeks. But we should always assume the trend remains the same until proven otherwise. In this instance, that means assume the main wave count is correct and trade accordingly, while price remains above 2,398.16.
Only if price now breaks below 2,398.16 will this wave count be given serious consideration.
TECHNICAL ANALYSIS
WEEKLY CHART
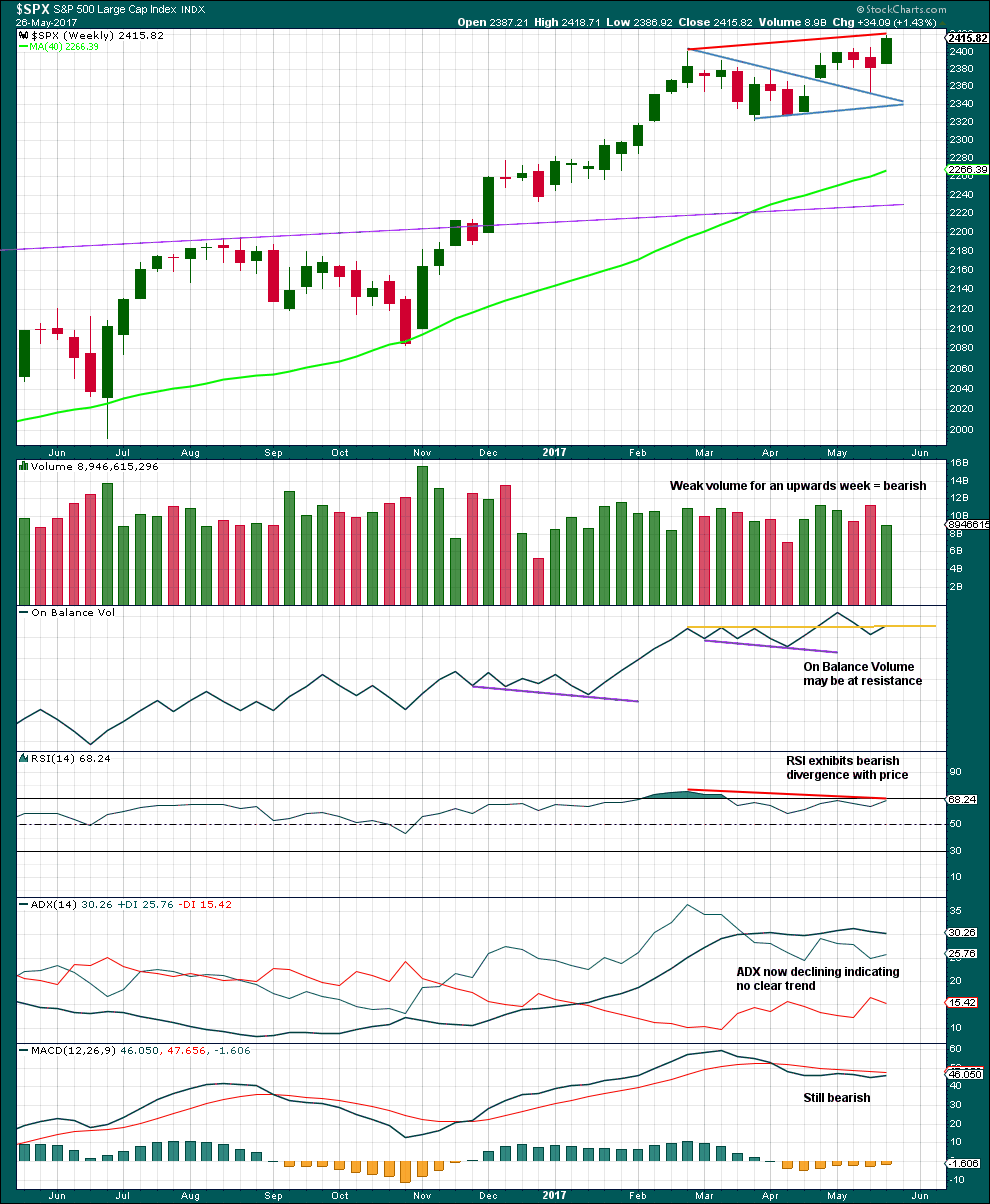
Click chart to enlarge. Chart courtesy of StockCharts.com.
This weekly chart supports the alternate wave counts over the main wave count.
DAILY CHART
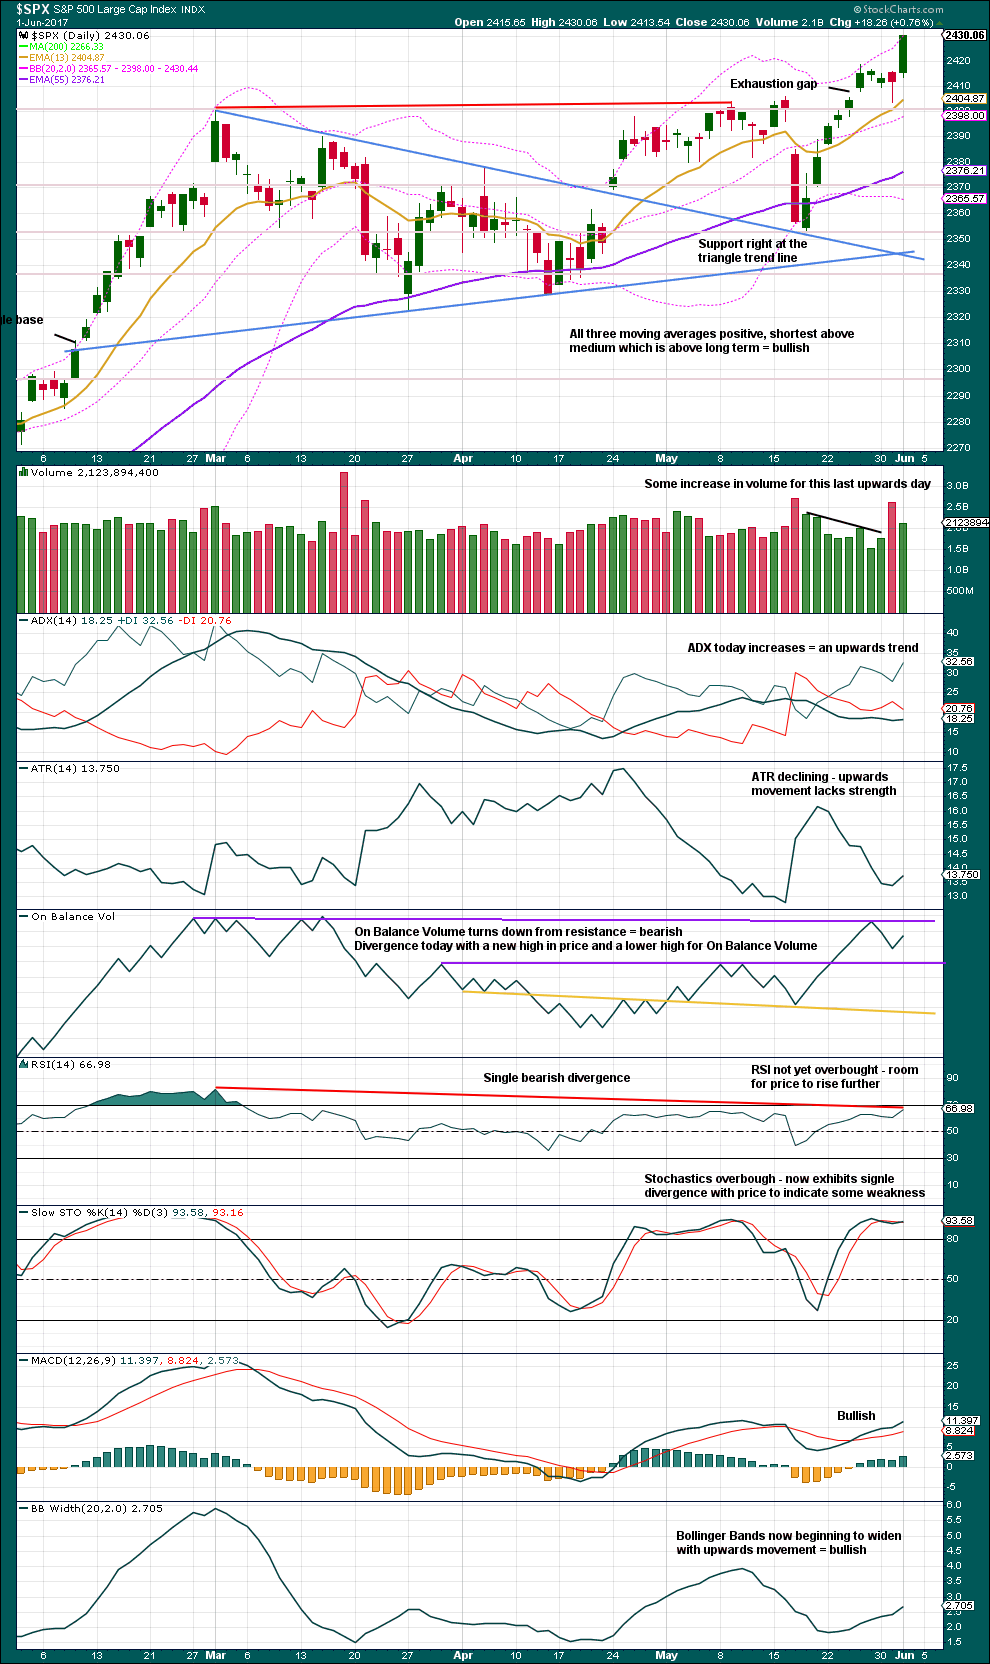
Click chart to enlarge. Chart courtesy of StockCharts.com.
If the widest part of the symmetrical triangle is taken from the high of the 1st of March to the low of the 27th of March, then a measured rule target would be at 2,448. This is just 8 points above the Elliott wave target.
Today’s candlestick is very bullish. Some increase in volume is bullish. ADX is bullish. ATR may be beginning to widen, but one day is not enough to have confidence in this. RSI allows for further room for price to rise. Stochastics could remain overbought and develop multiple divergence before price turns. MACD is bullish. Bollinger Bands are bullish.
Divergence between price and RSI now spans months; this is bearish. Volume for recent downwards days is stronger than upwards days; this is still bearish. Declining ATR as price moved higher was bearish.
Assume the trend remains the same while price remains above support. There should now be very strong support about 2,400, which aligns nicely with the Elliott wave invalidation point for the bullish wave count at 2,398.16.
VOLATILITY – INVERTED VIX CHART
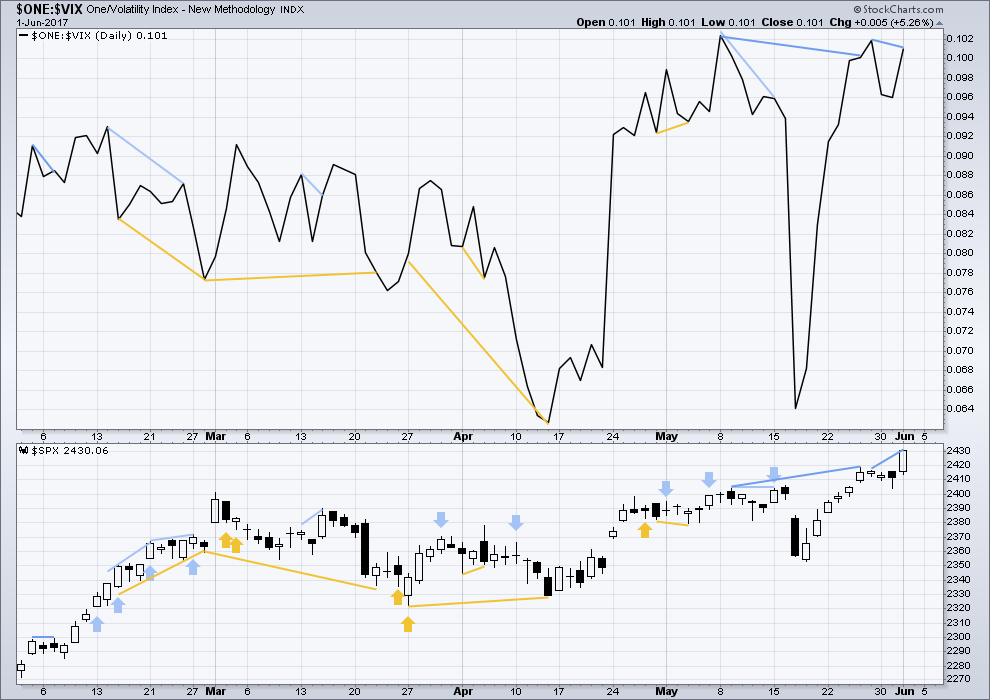
Click chart to enlarge. Chart courtesy of StockCharts.com.
Normally, volatility should decline as price moves higher and increase as price moves lower. This means that normally inverted VIX should move in the same direction as price.
Price moved strongly higher to new all time highs today, but inverted VIX did not make new highs. This divergence is bearish and favours the alternate Elliott wave count. Lately, this bearish divergence has been working more often than it fails, as evidenced in this chart, but it does not always work.
BREADTH – AD LINE
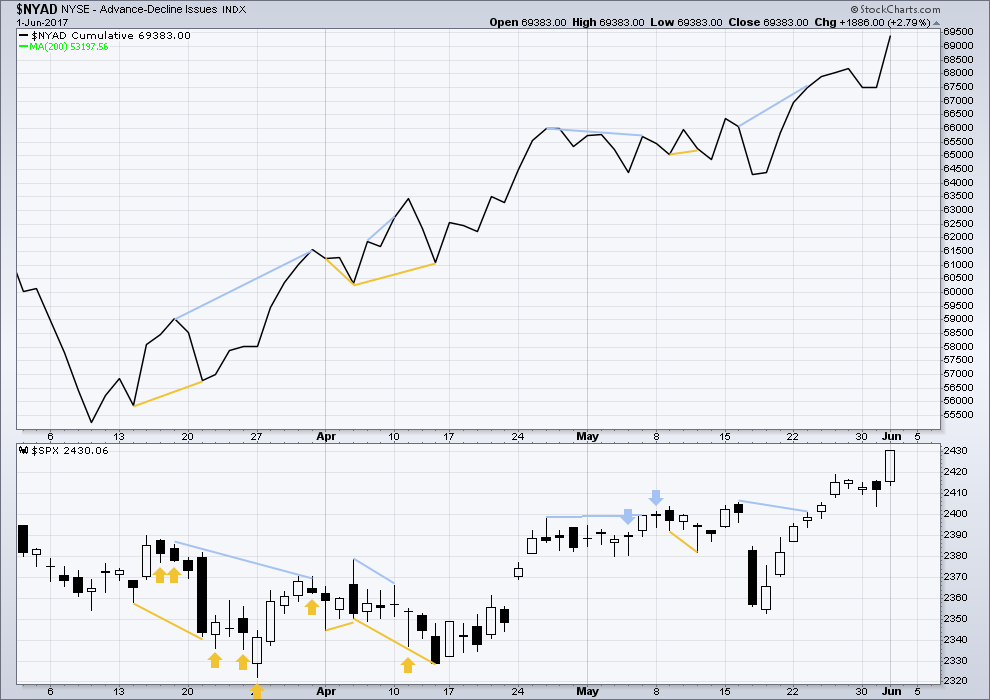
Click chart to enlarge. Chart courtesy of StockCharts.com.
With the last all time high for price, the AD line also made a new all time high. Up to the last high for price there was support from rising market breadth.
There is normally 4-6 months divergence between price and market breadth prior to a full fledged bear market. With no divergence yet at this point, any decline in price should be expected to be a pullback within an ongoing bull market and not necessarily the start of a bear market.
Price made new all time highs today and the AD line also made new all time highs. This rise in price is supported by a rise in market breadth; it has some internal strength. This supports the main Elliott wave count.
DOW THEORY
The DJIA, DJT, S&P500 and Nasdaq continue to make new all time highs. This confirms a bull market continues.
The following lows need to be exceeded for Dow Theory to confirm the end of the bull market and a change to a bear market:
DJIA: 17,883.56.
DJT: 7,029.41.
S&P500: 2,083.79.
Nasdaq: 5,034.41.
Charts showing each prior major swing low used for Dow Theory are here.
This analysis is published @ 09:47 p.m. EST.
Updated SVXY chart at the close.
Few signals can be relied on these days, but the divergence and dojis are noteworthy…
hey,, looky there,,,Im turdy turd
Okay… so we are now near 2500,
so when do we start positioning for a top and this long delayed EW collapse at all Cycle Wave degrees?
Only when bullish alternates are invalidated.
We’re a fairly long way off that still.
How is it a long way off the target is 2500? That is only ~60 points away?
We will be there very soon!
yesterday Lara was musing about the time aspect, Oct. seems to be the projected end. check out yesterdays comments.
Thanks
DJIA has confirmed a new ATH today. But the DJT has not.
So far failure to confirm the ongoing bull market via Dow Theory.
The last time we had a non-confirmation many analysts were convinced that DJT was so far below its last high that a new ATH would not be seen. We know what happened. It is not so far away now as it was at the last non-confirmation so we could still I imagine see see it go on to make a new high. The long upper wick today suggests a correction may come prior, in keeping with the current wave count.
Yeah, I’ve learned the hard way that really there’s nothing a market can’t do.
Seeing DJT far off a new ATH doesn’t mean it can’t eventually get there.
And that’s the difference I think between analysing what is here and now in front of us, and trying to see what you want to see.
Right now the lack of confirmation from DJT only indicates weakness. Dow Theory still would require DJT and DJIA to make new major swing lows before bull turns to bear.
It’s just possible that the structure for intermediate (3) is complete today.
BUT
Don’t trade it down, trying to pick a high is a fools game. Wait for some confirmation / confidence in a trend change before having a punt on the short side.
While price remains within the green channel allow that it could just keep going up.
Either take profit on long positions, or pull stops up to the invalidation point here on the hourly chart, or maybe higher just below the green channel.
Are we seeing ending diagonals for this fifth wave up?
I’m not seeing it. Not sure what you’re seeing there Verne… 🙂
For minute v this is what I see on the five minute chart
I must have imagined it. I thought I was seeing zig zags in the moves up today.
Never mind! 🙂
SVXY signaled its last two reversals with doji and they were good trade-able opportunities. Look for the current candle to morph into another or perhaps on Monday.
A move below DJI 21,174.94 should do it….
DJI hanging man on the one minute chart, doji on the five minute. Could that be all she wrote??!!
If it is, an impulse down should confirm.
I think it’s rather dangerous to look for candlestick reversal patterns for a reversal at a higher level (hourly, daily or weekly) on the five or one minute charts. It’ll give you too many false signals.
Yep! Way to too much of an eager beaver! 🙂
Adding a few nearer dated SVXY puts (June 9 expiration). Buying 160 puts for 4.50 per contract. If it continues higher will try to lower cost basis to 4.00 or less.
Looking like we had that fourth wave this morning and are now in the final fifth up. A big hint will be a green VIX print today. Glad I exited longs this morning as I think further upside quite limited.
Several weeks ago I posted a chart of the daily IWM showing a possible triangle for a 4th wave. At that point in early May, we had just completed wave B up and were beginning wave C down.
Below is the updated chart as of this morning. The triangle looks perfect and has completed the breakout. A projected move to above 145 or so is in the making.
Thank you very much for sharing that chart Rodney 🙂
Look out for a trend change at the point in time at which the triangle trend lines cross over
Very strange market behavior. The talking heads will claim the collapse in futures due to the mediocre jobs report but I am not buying that for one hot minute. If DJI fails to confirm the other indices ATH as was suggested by futures action we would have witnessed one of the most diabolical banskter ambushes I have seen in quite some tome. If we go red before the open it’s going to be a long hot Summer.
They threw quite a bit at it when futures turned red; I really am at a loss for their end-game. Nonetheless, pretty much sitting on hands in my account, but my fund is going 92% short at open. Last time it did this was two days before the 380 point drop on the DJIA.
What came of this? Did it hold short all day?
Are we seeing a blow off top, or the start of a new sustained rally? The latter seems unlikely from this VIX level. I will be exiting all my long positions at the open, and opening my biggest short position of the year. I plan on entering 1/4 position by the close, and another 1/4 on Monday, with the remaining half on a reversal signal. Hard stop at 2510. I will also be exiting short Gold trades at the open. I think the sector is getting ready to go on a tear to the upside.
I am and have been leaning towards a blow off top. I am thinking we have a few days to a week or so before it may be over. I am eying an exit for all my long positions somewhere around 2470 .
I exited all longs at the open. Took profits on my short oil at at this morning’s low and will probably reload at the end of the current bounce.
Buying volatility while it is cheap, and going out somewhat farther than usual to allow for a few more days for a possible double top.
SVXY is displaying notable divergence from SPX is that it has not made a new ATH. It is probably the best vol trade at the moment.
Buying the SVXY June 16 160 puts for 6.60 per contract. This is my biggest long volatility position in many years. The last 158 puts returned 5X in one trading day.
I am seeing some very interesting things in the market at the moment. I think we are going to get a few surprises.
Another day or two of upwards movement and we will see a bullish MACD cross over on the weekly charts.
hello,, its me
I’ve thought about us for a long, long time.
(Doc, you are really fast!)
yup,, thats what she said too,, hee hee