
The main wave count expected more upwards movement, which is what has happened. Targets remain the same.
Summary: The target remains at 2,459 or 2,469. However, ADX on the weekly chart remains extreme, so extreme caution is still advised. If price closes the gap by moving below 2,376.98, then look out for a deeper pullback.
New updates to this analysis are in bold.
Last monthly and weekly charts are here. Last historic analysis video is here.
MAIN ELLIOTT WAVE COUNT
WEEKLY CHART
Click chart to enlarge.
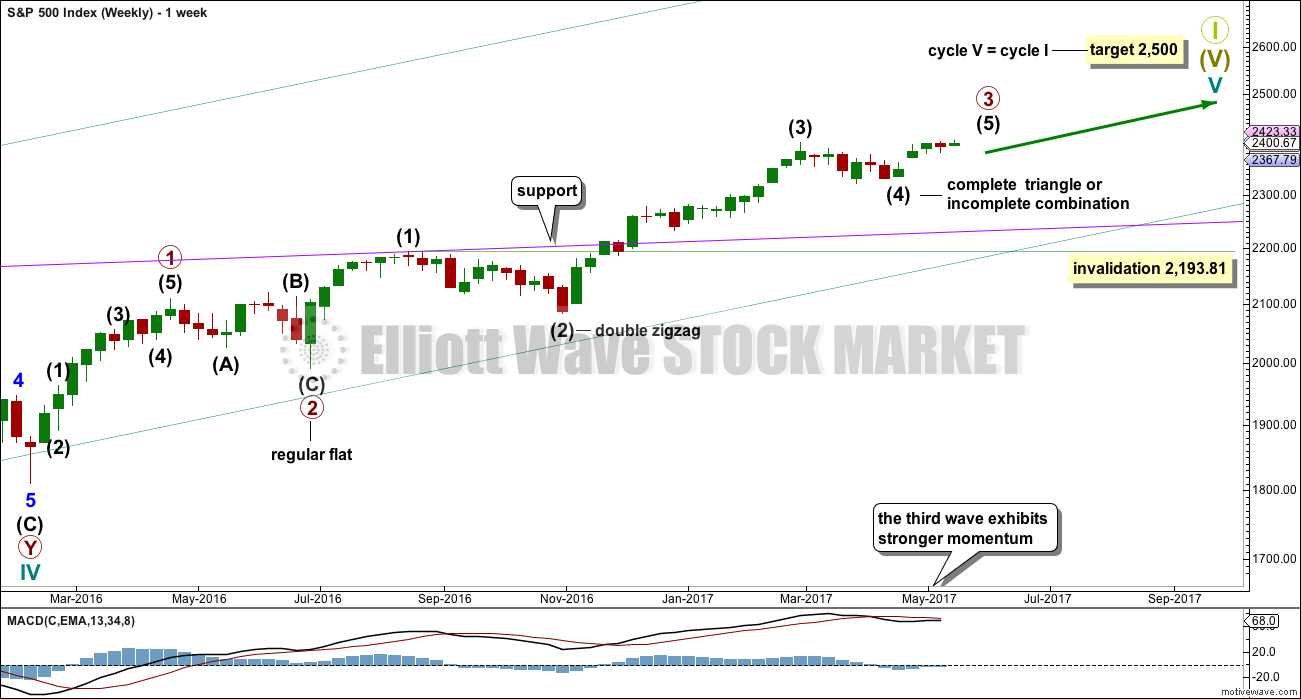
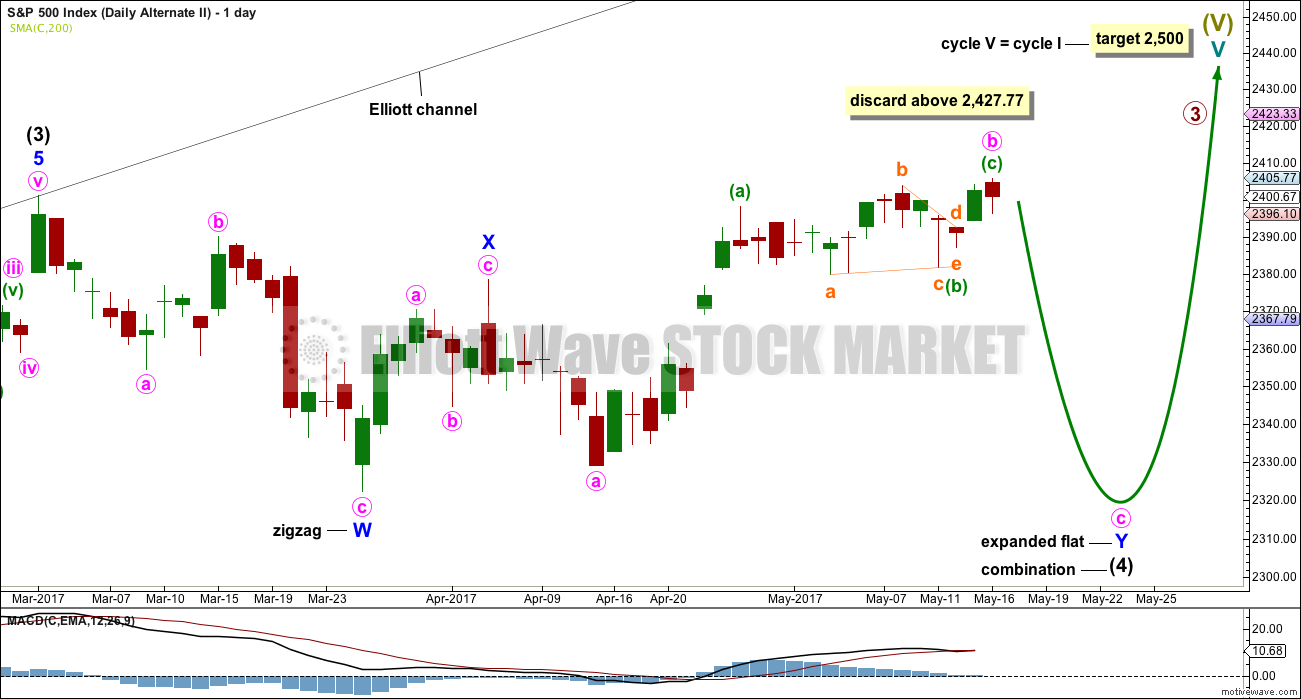
This wave count sees the middle of primary wave 3 a stretched out extension, which is the most typical scenario for this market.
Primary wave 3 may be incomplete. A target is now calculated for it on the daily chart.
There is alternation within primary wave 3 impulse, between the double zigzag of intermediate wave (2) and the possible triangle or combination of intermediate wave (4).
When primary wave 3 is a complete impulse, then a large correction would be expected for primary wave 4. This may be shallow.
Thereafter, primary wave 5 may be expected to be relatively short, ending about the final target at 2,500.
It is also still possible that primary wave 3 was over at the high labelled intermediate wave (3) (this idea has been published previously) and that would mean that price should currently be within primary wave 4. This idea does not at this stage diverge in terms of expected direction or structure from the daily alternate wave count below, so for clarity and to keep the number of charts manageable it will not be published on a daily basis. I will follow the idea and will again publish it when it begins to diverge from the main wave count.
DAILY CHART
Click chart to enlarge.
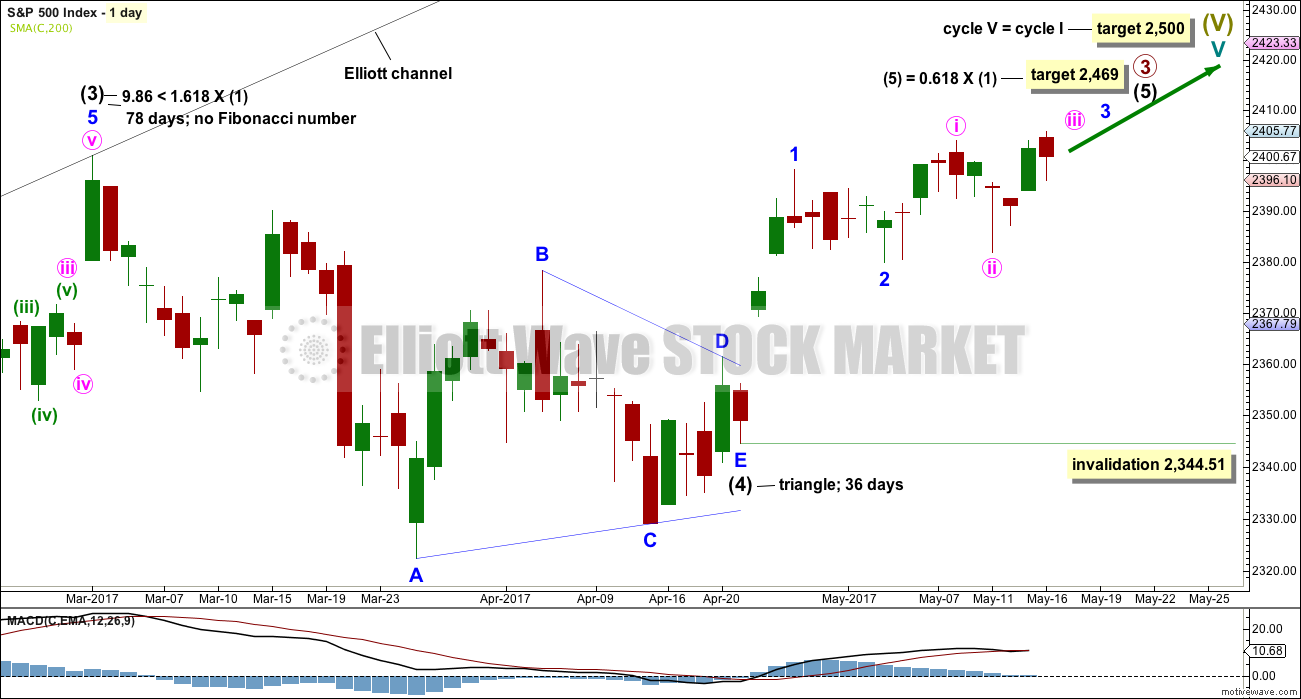
Intermediate wave (4) may be a complete regular contracting triangle. It may have come to a surprisingly swift end with a very brief E wave.
There is already a Fibonacci ratio between intermediate waves (3) and (1). This makes it a little less likely that intermediate wave (5) will exhibit a Fibonacci ratio to either of intermediate waves (1) or (3); the S&P often exhibits a Fibonacci ratio between two of its three actionary waves but does not between all three.
Within intermediate wave (5), minor waves 1 and now 2 look to be complete.
Within minor wave 3, no second wave correction may move beyond its start below 2,379.75. However, an alternate idea below at the hourly chart level looks at the possibility that minor wave 2 may not be over and may continue lower. This idea has an invalidation point at the start of minor wave 1 at 2,344.51.
The structure of intermediate wave (5) on the daily chart does not look complete. So far it looks like a possible three up. Minor wave 3 still needs to complete, then minor waves 4 and 5. This may last another couple of weeks at least.
HOURLY CHART
Click chart to enlarge.
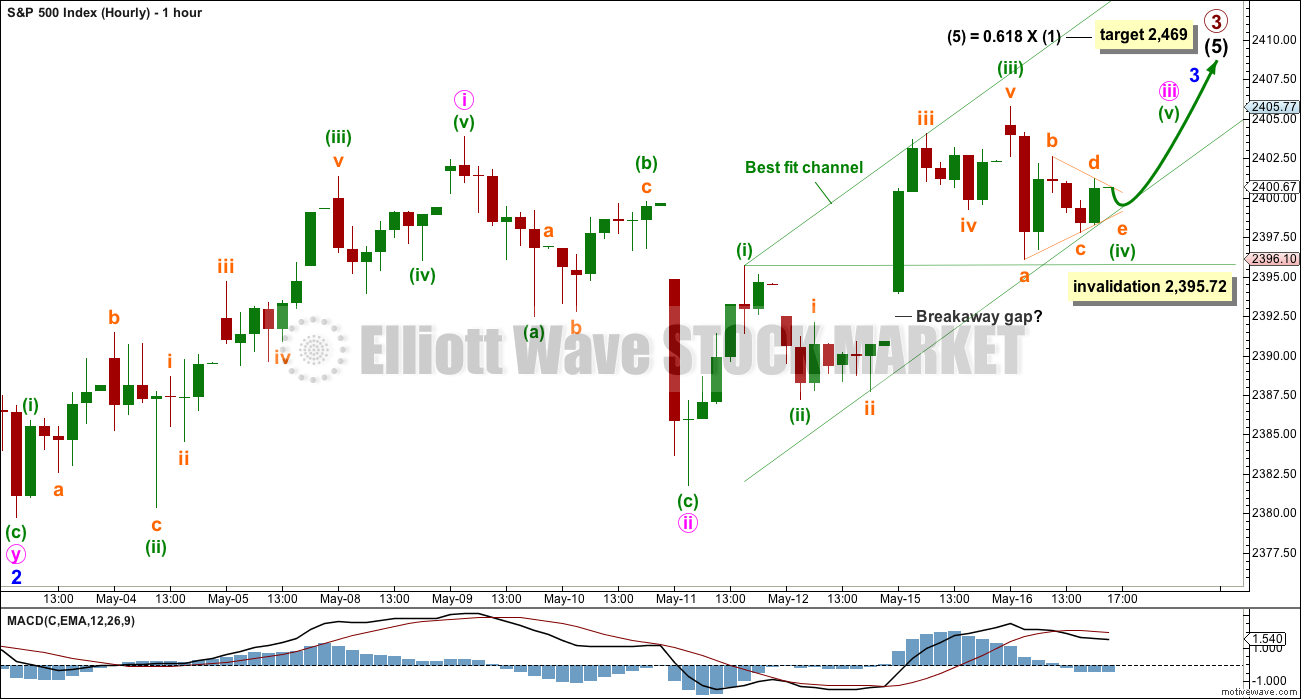
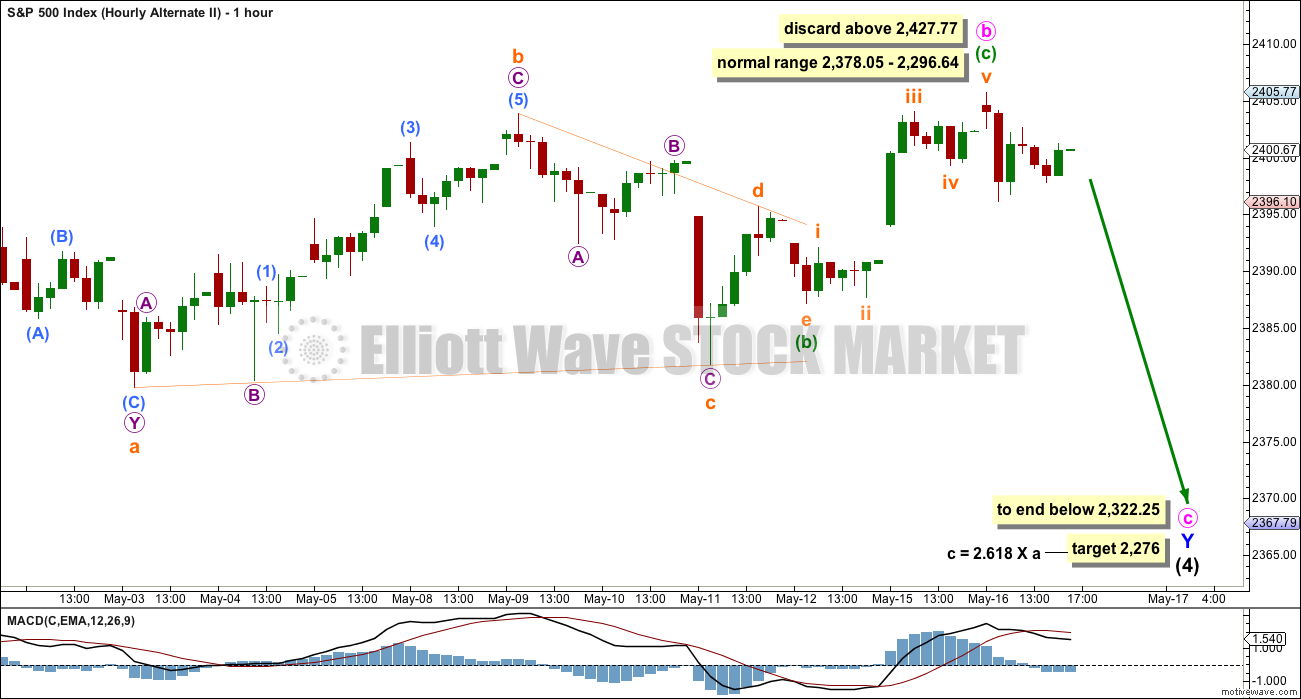
Minor wave 2 may have completed as a double zigzag.
This main wave count still expects to see a further increase in upwards momentum over the next few days.
Minute wave iii may only subdivide as an impulse. Within minute wave iii, minuette wave (iv) may not move into minuette wave (i) price territory below 2,395.72. Minuette wave (iv) may be completing as a regular contracting triangle. It may remain within the best fit channel. If it does, then it may end quickly when the next session opens.
Tomorrow may see another new all time high as minute wave iii continues higher. If this labelling within it is correct, then minuette wave (v) may be extended.
Minute wave iii must move far enough above the end of minute wave i at 2,403.87 to allow room for a subsequent correction for minute wave iv to unfold and remain above minute wave i price territory.
ALTERNATE HOURLY CHART
Click chart to enlarge.
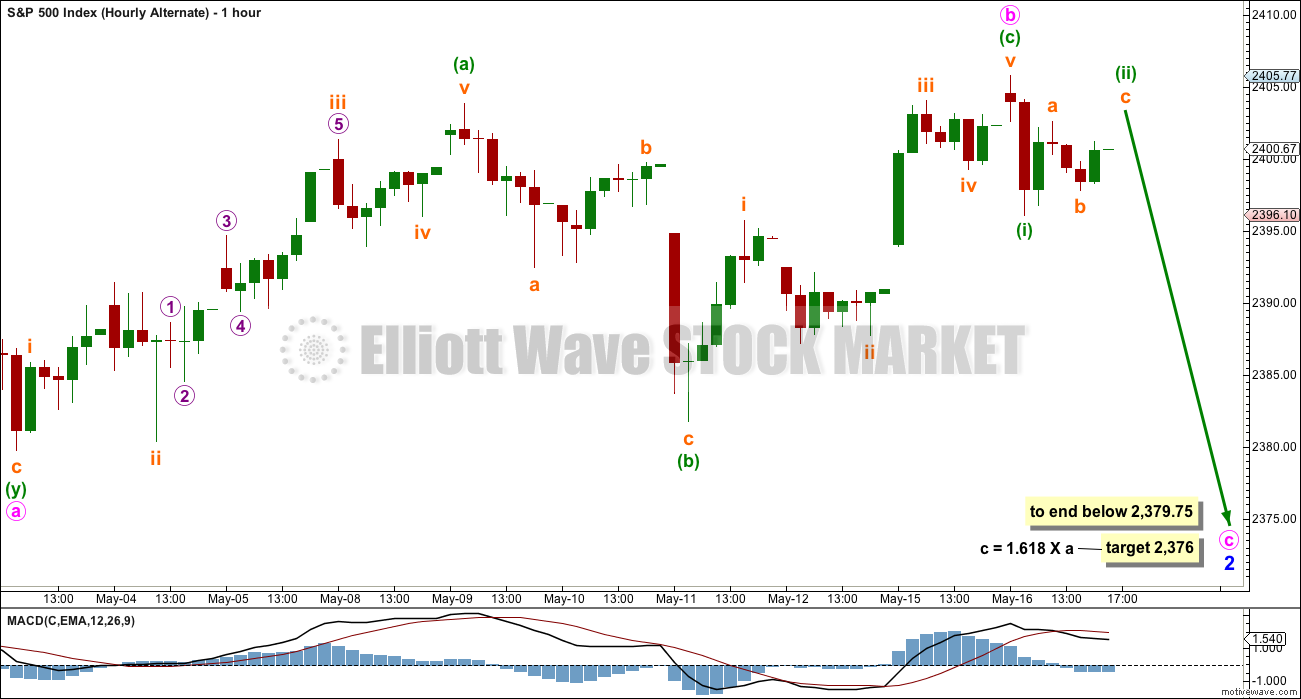
It is also possible that minor wave 2 is continuing further as an expanded flat correction. Minute wave b may again be complete.
The normal range for minute wave b within a flat correction is from 1 to 1.38 the length of minute wave a, giving a range from 2,398.16 to 2,405. There is no maximum limit for minute wave b within a flat, but when it reaches twice the length of minute wave a at 2,416.57 the idea of a flat correction continuing for minor wave 2 should be discarded based upon a very low probability.
This alternate wave count would require a few days of downwards movement to complete minute wave c. Minute wave c would be very likely to make at least a slight new low below the end of minute wave a at 2,379.75 to avoid a truncation and a very rare running flat. A target is now calculated based upon a common Fibonacci ratio between minute waves a and c.
A new low below 2,395.72 would invalidate the main wave count at the hourly chart level and provide some confidence in this alternate.
ALTERNATE DAILY CHART
Click chart to enlarge.
What if intermediate wave (4) was not a complete triangle but is still unfolding as a double combination? The subdivisions of this wave count would be labeled in the same way, with the exception of the degree of labelling, if the correction were to be primary wave 4.
Double combinations are very common structures. This would still provide perfect alternation in structure with the double zigzag of intermediate wave (2). Although double zigzags and double combinations are both labelled W-X-Y, they are very different structures and belong to different groups of corrections.
The purpose of combinations is the same as triangles, to take up time and move price sideways. Intermediate wave (2) lasted 58 days. So far intermediate wave (4) has lasted 53 days. If it continues for another one to two weeks, it would still have excellent proportion with intermediate wave (2).
This alternate wave count still has some support from classic technical analysis, particularly extreme ADX at the weekly chart level.
ALTERNATE HOURLY CHART
Click chart to enlarge.
Minute wave b is longer than the common range of up to 1.38 times the length of minute wave a, but still within allowable limits of up to 2. The higher minute wave b goes the lower the probability that this wave count is correct.
However, I have seen plenty of expanded flat corrections with B waves longer than 1.38 times the length of their A waves. This wave count remains entirely acceptable.
Minute wave c would be very likely to end at least slightly below the end of minute wave a at 2,322.25 to avoid a truncation and a very rare running flat.
A target is now calculated based upon a Fibonacci ratio between minute waves a and c. The first ratio of 1.618 would see minute wave c truncated, so the next ratio in the sequence is used.
TECHNICAL ANALYSIS
WEEKLY CHART
Click chart to enlarge. Chart courtesy of StockCharts.com.
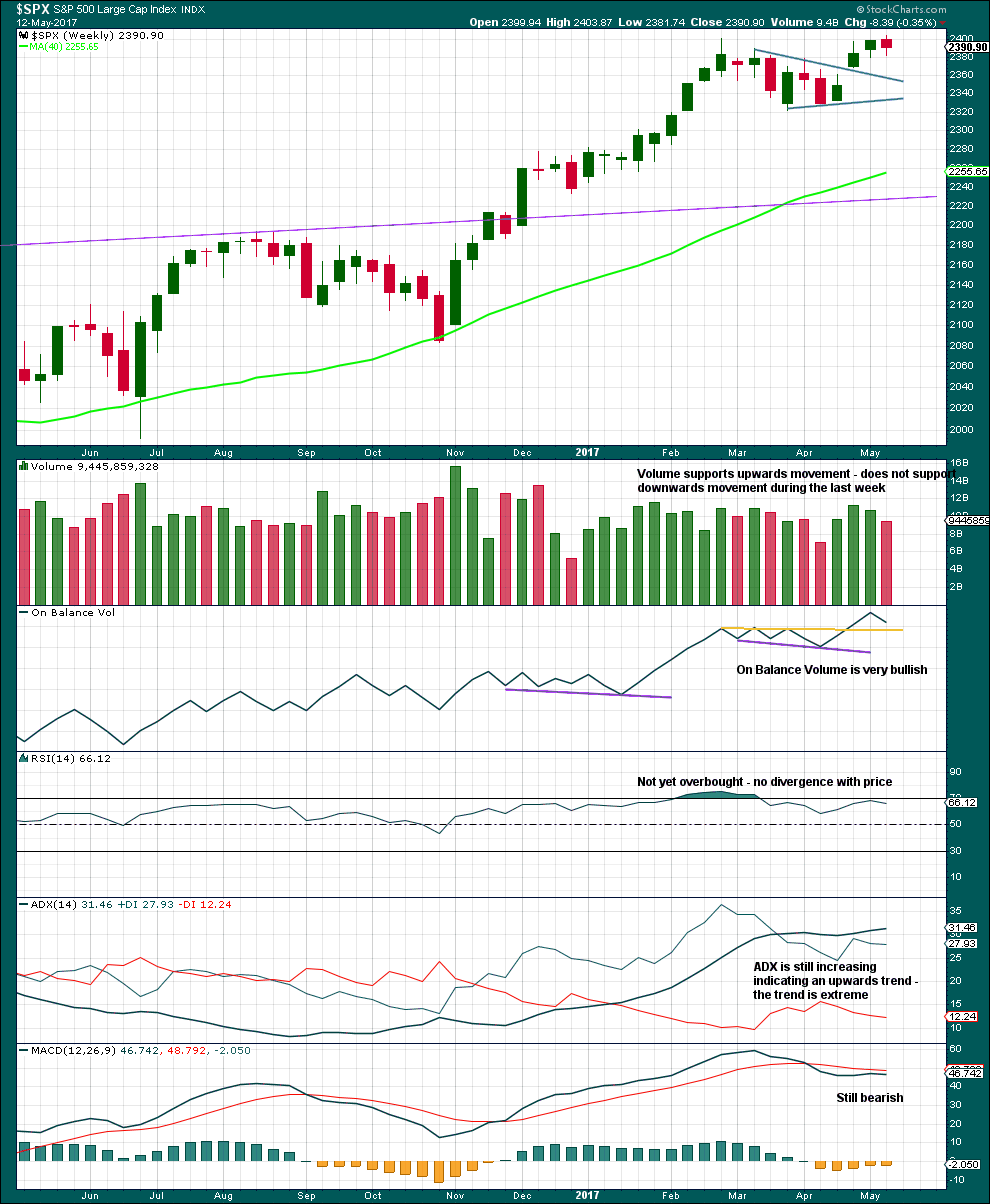
An upwards week is completed but closes red. The balance of volume is down and it shows a decline. Downwards movement during the week did not have support from volume. This looks like a pullback within a larger upwards trend.
ADX is extreme and nearing very extreme. A bigger consolidation or deeper pullback should be expected.
Within this bull market, beginning in March 2009, this has happened at the weekly chart level on four occasions: January 2010, the end of February 2011, early June 2013, and late July 2014. On each occasion it was immediately followed by three to four weeks of downwards movement.
DAILY CHART
Click chart to enlarge. Chart courtesy of StockCharts.com.
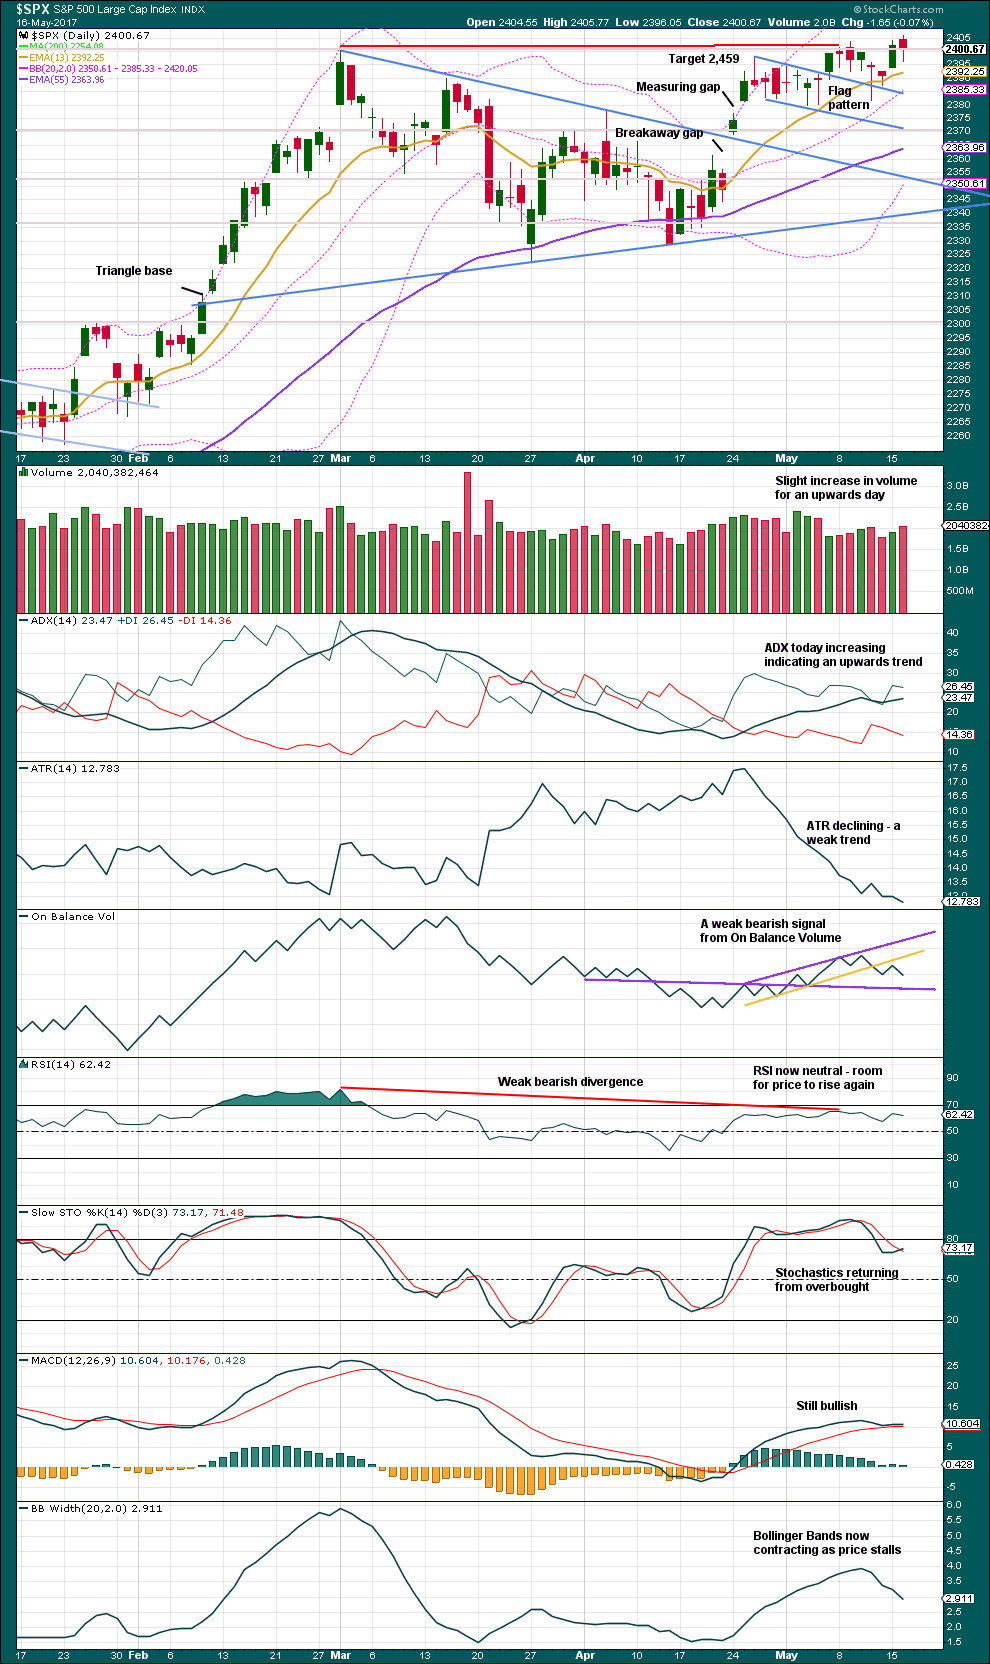
Today completes an upwards day, but the balance of volume was downwards. Volume shows some increase, so there was support for downwards movement during the session and this is interpreted as bearish.
Another long lower wick on another daily candlestick is again bullish.
With RSI and Stochastics again not extreme, there is room for price to rise further. But the trend is weak: it has declining ATR and contracting Bollinger Bands.
VOLATILITY – INVERTED VIX CHART
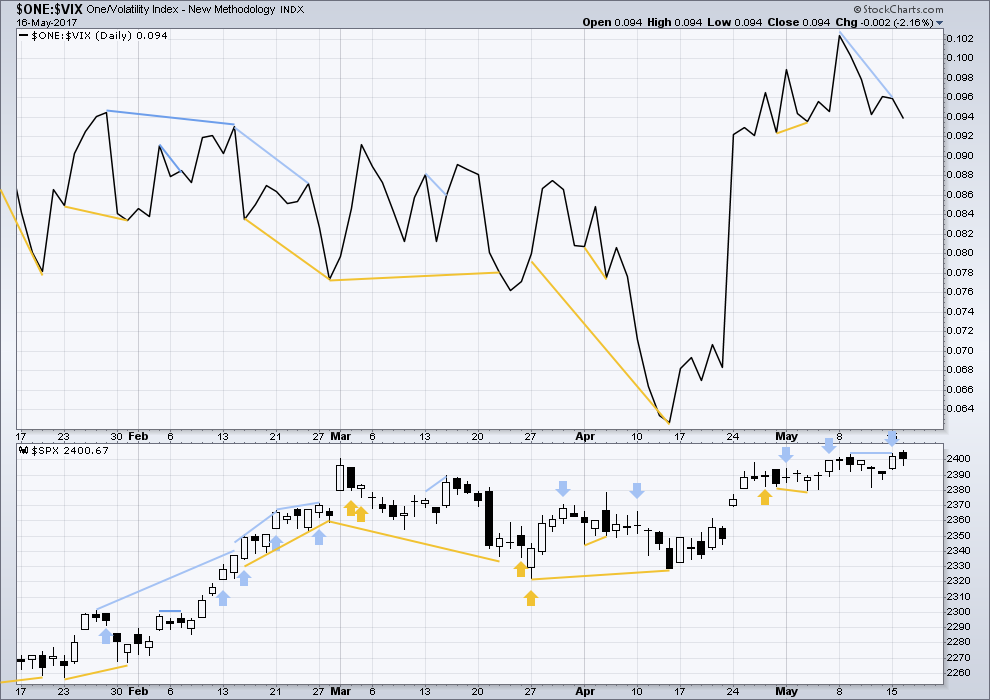
Click chart to enlarge. Chart courtesy of StockCharts.com.
Normally, volatility should decline as price moves higher and increase as price moves lower. This means that normally inverted VIX should move in the same direction as price.
It is noted that there are now six multi day instances of bullish divergence between price and inverted VIX, and all have been followed so far by at least one upwards day if not more. This signal seems to again be working more often than not. It will again be given some weight in analysis.
Bearish divergence noted yesterday has been followed by an upwards day, but one with a balance of volume downwards and a red close. This divergence may now be considered to have been resolved. No new divergence is noted today.
BREADTH – AD LINE
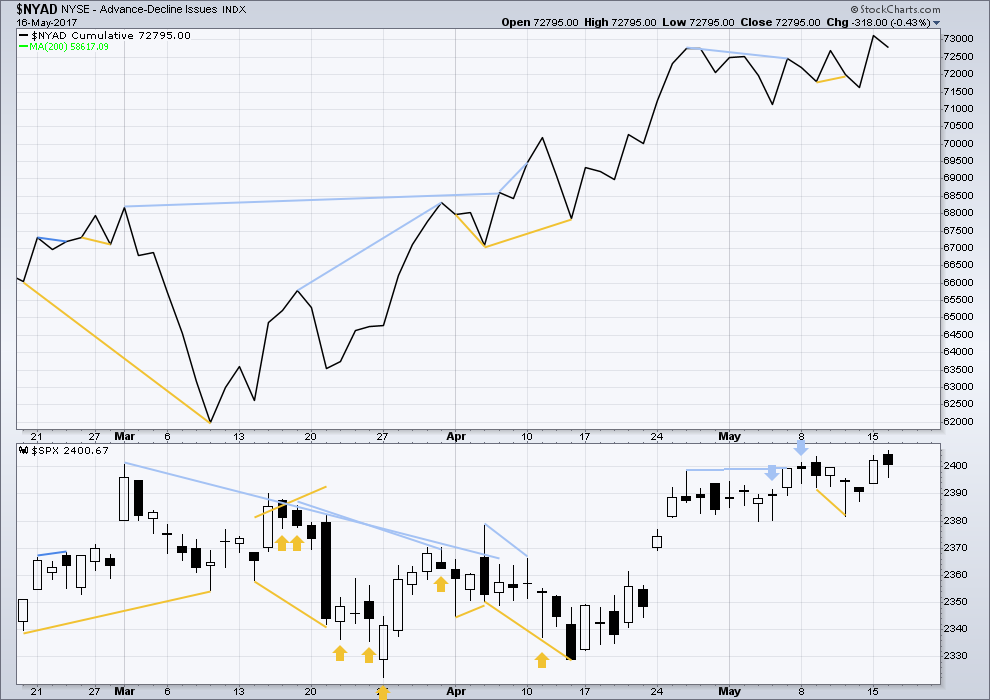
Click chart to enlarge. Chart courtesy of StockCharts.com.
No new divergence between price and the AD line is noted today. Although price moved higher, the session had a balance of volume which was down and it closed red. The lower close was accompanied by a decline in market breadth. This is bearish.
DOW THEORY
The DJIA, DJT, S&P500 and Nasdaq continue to make new all time highs. This confirms a bull market continues.
The following lows need to be exceeded for Dow Theory to confirm the end of the bull market and a change to a bear market:
DJIA: 17,883.56.
DJT: 7,029.41.
S&P500: 2,083.79.
Nasdaq: 5,034.41.
Charts showing each prior major swing low used for Dow Theory are here.
This analysis is published @ 10:39 p.m. EST.
Lara , have we filled the gap created 4/21 or is that to 2351.13 ?
– looking back there are a lot of areas that can be filled from the 2321 up
That gap is now filled.
As is the one before it between 21st April to 24th April.
I wussed out and sold all my short positions on this last leg down. Look for the banksters to ramp it up overnight. If they do short it!
If they don’t, it means they tried and failed…you know what to do! 🙂
Well, we will see what the futures hold.
I am looking at that VIX candle today and cannot help but wonder if we are seeing a mini fractal of what is going to eventually happen. The distance that candle travels from yesterday’s low to today’s high is the the kind of journey one would see over several trading sessions. The old adage about bear markets unfolding far more quickly than bull ones may be about to get some very serious confirmation in the not too distant future.
Take care everyone!
Yep. When it finally arrives I expect it will be brutal. We may not actually like trading it.
Alternate hourly updated:
For this one it needs a deeper pullback. So only wave 1 of a five down close to completion. And here’s another way to label the current five down.
within the current five down the middle, subminuette iii, doesn’t look as good as the main hourly chart below.
but both possibilities are valid. we should consider both.
the implication is that a five down could be complete at todays low
Only wave one????! Ai! YI! YI!
I think you could be right…..
New main wave count:
Target quite close now. Only one more wave down required.
Thank you very much Lara. Looks good to me. With the SPX approaching its lower BB line and VIX above its upper BB line, one more move down on the SPX would push those limits and provide good support. I sure am interested in how this effects weekly ADX. Maybe if we bounce around these lows for a few days it can relieve some of the weekly ADX extreme reading.
By the way, is the main count still your preferred count? (I know end of day data still needs to be analysed especially volume before you may be able to answer this questions.)
Yes, it is.
Then again, knowing how the banksters move, it would be just like them to trap anyone going short after today’s plunge. Jeez! I am starting to get paranoid! 😀
Settle down Verne…. 😉
Looks like a small final fourth wave ahead of the final fifth down for this impulse. I think I will exit my final SVXY puts with a new low….
Does anyone realize how incredible it is that this market has gone from an all time high print one day, right down to almost touching the lower BB in one trading day?!
This thing is a powder keg….
Yep. All it needs is a good match.
Dynamite anyone? 😀
Scaled out of another quarter of SVXY 158 puts….
I am not sure why some traders in the blogosphere are talking about this move being a possible Zig Zag downwards with just the A leg now completing. If it is a C wave is should be a five wave impulse down should it not? Or am I missing somethin’…?
No, you’re not missing anything. They’re missing an expanded flat.
O.K. As they say, bulls make money. bears make money. but pigs….well, you know.
Exited half my SVXY puts for my best trade this year.
Congrats Chris on the VXX haul; nice pop there also.
I am sitting on some big profits in my SVXY short trade and really in a quandry. I just do not trust these banksters. I will probably exit before the close but I don’t think we are done. Hopefully Lara can give some guidance prior to the close.
Grabbed nice profit from VXX just now. No regrets.
There was a time in the cycle of a volatility trade, where I would not be remotely considering an exit at this early stage. Something nefarious has happened to volatility in these broken markets. These instruments no longer truly represent any kind of SPX put call ratio- not even close. What has been happening is both retail investors and banksters have been shorting these instruments using extreme leverage and for different reasons. For the retail investor SVXY has been a pretty safe one-way bet. For the banksters they have been juicing the pairs trade by selling volatility and buying the market, as well as triggering the risk delineated algos to buy the market by keeping volatility suppressed. Those massive short trades are nowhere near being unwound, but that does not preclude the possibility of the insane banksters doubling down on those shorts, like Carl Icahn did on his Hertz trade. The man coughed up a Billion on that trade! Yikes!
Am I wrong about a fourth wave? Could it be a second?
Any thoughts?
Or maybe minute C of minor B, just like Lara’s hourly alternate. If so, looking at a 30-minute chart right now, I halfway expect a final leg down to around 2365 perhaps yet today. And then the up-trend resumes… maybe.
Minute C of minor 2 perhaps?
Yea, that’s right.
I think a key to what happens next will be whether this decline was sharp enough to dislodge leveraged long trades. So far it does not appear to be the case. Despite the pop in VIX, and the triple digit DJI plunge, there is absolutely no indication of panic in this market. Pay close attention to futures overnight. If we close near the lows there is going to be a furious attempt to ramp prices up and some smart folk may use that opportunity to head for the hills…
VIX also peeking above upper BB today..
The only way to get panic selling is to go down 6 to 9 thousand points over several weeks. Otherwise, only quick shallow down waves that are then followed by protracted moves materially higher.
That I think is the expectation of the crowd, and not without justification. After all, that is the way it has been working for years now. These folk bought the DJI out of over a thousand point decline overnight so today’s fall is hardly a game changer. One thing to keep in mind is that the higher the market goes the more unwieldy it becomes, and there does come a point where price manipulation simply will no longer work, especially if the crowd starts getting nervous and switches to “Sell the Rip”….
The Crowd… is sleeping very very well at night for a long time now.
ZERO signs of any nervousness… zero!
But 100% sign of stupidity. I just don’t get it….is it just me? 🙂
You’ve got to hand it to the banksters. This time they gave the fish plenty of line…
A fifth wave coming up and the big question is will that be all she wrote, with a rapid re-ramp by the cartel, or just the first salvo? Some key price points were met (and exceeded but not invalidated) for the main count so we have to respect the possibility. I will wait for the approach of the close to decide how I handle my open positions. This is a totally unpredictable market….
Above 18 UVXY a good short trade, especially if above BB at that price area…it will probaby see one more reverse split by the top…
Looking at the bigger picture, it was somewhat predictable that Mr. Market would buck off a few riders ahead of a final manic move higher. Here’s hoping that with Lara’s able guidance we can ride the bull up one last time before grabbing our Stetsons and getting out of Dodge…!
I agree… This market only goes in one direction and that is UP materially!
If I bought and held since 2010… I would be very well off right now! Very few real declines during that period of time. You can count using one hand!
But… I did not! Keep trying to hit the big EW Short that has been expected since March 2012 and has not materialized. I recognize most of that came from EWI.
I sure learned the hard way as a result of initially blindly following that incompetent crew. The bottom line is regardless of what the wave count calls for, you ultimately have to trade what is in front of you, It sounds too simple I know but I don’t know any other way…
You may be right about a buy- and- hold strategy but I have also determined to never leave profits sitting in this market. Of course that may be a function of the kind of instruments I trade but so far as a short term trading account goes, scalping is the way to go imho…particularly the last few years so many price whipsaws…
Not much movement on down waves… It’s hang out then move materially higher… hang out again and then move materially higher again.
Very hard to trade that consistently! You can Day Trade… another thing not easy to do consistently.
True. The moves down have been generally sharp and short. The moves up more protracted. The safest trades in the market for some time now have been credit spreads. The banksters have become very adept and dislodging both put and call buyers by consistently running stops, hence the mostly sideways limited trading range. Traders have started to figure this out and volume on the exchanges has declined to a mere trickle. It is now mostly the bots trading against one another for pennies….
Joseph, do you watch Chris Ciovacco’s videos?
He looks at simple solid TA and the larger picture. The pullbacks within this bull market he calls “volatility to ignore”.
I think his approach would work nicely for you.
Mama mia thatsa big spicy red SVXY candle…!
In some indices this is a decline off all time highs so it has to be a first wave. I am expecting a manic second wave up before we get a move on down in that case…trying to decide what to do with my SVXY 158 puts in the meantime…
If this is just a first wave down, how low can we go?
The bankseters will now get to work trying to close that massive gap down. We should get a good measure of the mood of the crowd as we see whether the BTFD meme still holds sway. My thesis is still that this kind of decline is not part of their playbook and that they have to prove they are still large and in charge. Never underestimate the resolve of the cartel. If Mr. Market has other ideas, it could be a long, hot Summer…
Here is an update of the chart I posted a couple of days ago of the daily IWM. The count markers have remained the same.
IWM Is at the lower BB on the daily chart. SPX has more room beneath it until it reaches the lower BB (about 30 more points). Lets see if these support points can hold.
I trust you safely exited your long trades?
Volatility is setting for a long over-due spike. The banksters have been massively selling it short and I suspect they have been getting a bit over-confident in their ability to maintain those shorts. VIX should at the least tag its downtrend line at around 15 and SVXY could visit its lower BB around 125. A clean break of SPX 2380 should open the door for more downside acceleration.
APC is facing a securities class action lawsuit. I was having trouble getting an after-hours quote last night and did a bit of digging and found the announcement. It looks as if the vultures are trying to move in ahead of the bond-holders who are likely to have priority as the sector implodes. As soon as I can get a quote I will be exiting my short trades. I hope I can before they halt trading on it.
potential impeachment could change the whole outlook here and for US Dollar etc…
Yea Right… Keep Dreaming!
STOP listening to the Misinformation Fake News Networks!
This membership is global, and so members here will have a huge variety of political views. Some of which may be polar opposite.
I have no problem with members expressing those views here, as long as we’re all most respectful and polite on this topic, more than any other really.
While your comment isn’t disrespectful I do think it could be expressed in a more gentle way, or with a greater focus on facts and information rather than an admonishment.
I will encourage members actually to express all views, but please be careful with politics.
Thank you very much Joseph for your consideration.
Tough spot to be in Lara, as we Americans are subjected to an onslaught of hypocrisy, Marxist propaganda, and lies coming from all angles. Further, there are very real evils trying to uproot American values and divisive rhetoric has been weaponized. It’s doubtful anything political could ever be viewed as facts, as the problem’s lie in the subjective interpretation of the data. Hopefully, all who trade the markets have a common denominator of freedom, liberty, fairness, and capitalism; outside of that emotions ought to run hot as we transition from Bull to Bear. I’m sure this won’t be your last time moderating political posts. On a more important note, today looks like its shaping up to be pretty fun. On a n infinitely more important note; I just got back from surfing 6-8ft tubes in mexico for 6 days strait. First time i’ve been surfed out this year, YEW!!
Chris,
Thanks for this comment regarding the contemporary American experience and politics. You clearly articulate what I am thinking. Long-standing American values are under attack. Thanks again.
Welcome bud, at 34 I feel like I’m 70 as a result of worrying about all this BS…so sad….
One thing for sure are not facts… anything published by the Washington Post, NY Times and other on air major “News” Networks or by others sourcing “stories” from them.
It’s pure Propaganda! No Such thing as Journalism in the USA anymore! Journalism is DEAD!
An “Un-Named” Source at the NYSE and NASDAQ said that “NYSE and NASDAQ will continue to set new highs for at least the next 3 years heading to 40,000 DJI and 10,000 NASDAQ”. That same “Un-Named” Source continued on to say that “its already Programed in so it’s a 100% Certainty to occur”. I have verified this report from 6 other
“Un-Named” sources!
Have a great day all!
I know your tongue is firmly placed in your cheek but let me tell ya.
Just about a week ago I was talking to s friend who owns a successful business I frequent and he asked me about the markets. I told him the only place I felt comfortable was long volatilty. He then told me he was “All-In” the “Fab Five”, formerly “FANG”.
I bit my tongue…
That Business person should focus on expansion of his/her business and investing in & hiring more people. That would be the Best Investment he/she could make.
Who were the Fab 5 in 1999?
If owners can expand debt free fine. Demand may continue to decline in the coming great deflation…
A truly successful business can expand by re-investing cash into the business. NOT… buying back stock to inflate EPS… which has absolutely NO benefit to the business itself!
I have been waiting for this “Great Deflation” as defined by EW since 2011!
Sorry but I don’t believe in that anymore. The forces in power (deep institutions) worldwide won’t allow that to happen!
LOL A 100% certainty?
Nothing is certain in markets.
That statement looks really very much like a market top is closing in. The “this time it’s different” and “there can be no bear market” is what we need to see and hear before the bear can arrive.
Chris, what is you AI doing with this plunge?
About 40% cash, with the majority invested short. It also grabbed long UTIL at open. Our momentum component went full short at close yesterday.
EW theory would expect that kind of happening to occur in a bear market, not a bull market.
Remember, EW theory turns the cause and effect relationship on it’s head.
And so, following that, Trump would be unlikely to be impeached at this time. There may not be the social mood for it…. yet.
While the situation has not become serious enough to cause impeachment, the manner of Trump’s governance has begun to sow the seeds of doubt among the public, especially in the handling of the Comey case. The passing of the proposed tax changes is now seen to be closer to jeopardy, which would throw a spanner in the works of the stock market vigour. The recent lethargic movements could stem from this sentiment, or social mood.
That said, an impeachment, even the rumour of it happening, could trigger a bear market. In the eyes of investors, Trump’s presence has been instrumental to the stock market climb since November last year.
His most serious problem is the disloyal people on his staff. I think he is slowly coming to the realization that you cannot compromise with denizens of the swamp. Rumor has is that a massive shake-up among white house staff is coming and it is long over-due. His current COF is incompetent, and has permitted Trump’s enemies to remain in positions where they can hurt him by not moving expeditiously to replace those folk and fill vacant positions. Until he gets an able COF and a press person who knows what time of the day it is he will continue to flounder.
My biggest concern is he’ll start a nuclear WWIII with North Korea.
Poking that particular bear would be a truly suicidal move.
How come all the talk about North Korea and nuclear weapons isn’t focussing on stopping them importing the materials they require? Or going in there and getting rid of what they’ve got?
Surely, simple logic, either of those approaches would be a good idea.
But then, that wouldn’t make $$ for the companies that manufacture the weapons. And I think that’s where the answer lies 🙁 🙁
Bingo! Follow the money. It will lead you to the truth each and every single time!
Hiya!
no way Verne, err I mean Wabbit,, I got you by 2 minutes,,, heee heeee,, done in my best Elmer Fudd voice
I had ya beat, but could not find my bugs image! So there, Elmer!
what the hay