
A small inside day leaves the analysis mostly the same. The strong floor of support about 2,377 continues to hold.
Summary: Support should hold and next week should see new all time highs. The target remains at 2,459 or 2,469. However, ADX on the weekly chart remains extreme, so extreme caution is still advised. If price closes the gap by moving below 2,376.98, then look out for a deeper pullback.
New updates to this analysis are in bold.
Last monthly and weekly charts are here. Last historic analysis video is here.
MAIN ELLIOTT WAVE COUNT
WEEKLY CHART
Click chart to enlarge.
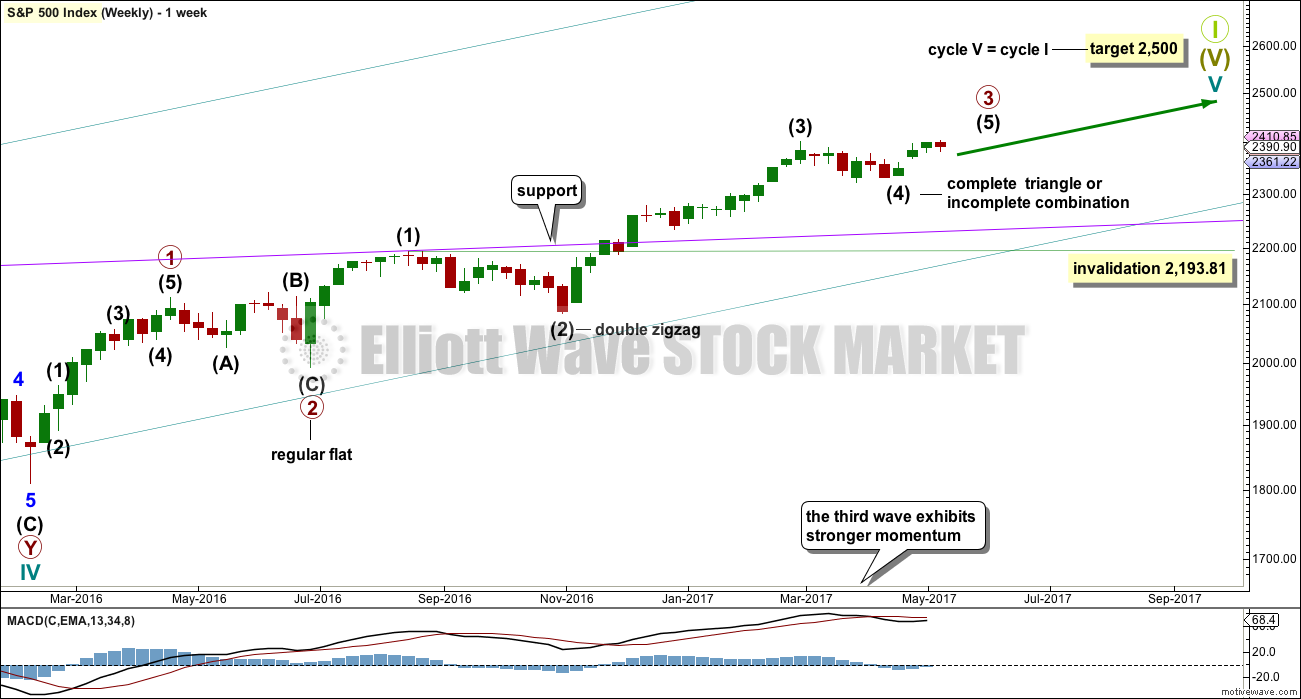
This wave count sees the middle of primary wave 3 a stretched out extension, which is the most typical scenario for this market.
Primary wave 3 may be incomplete. A target is now calculated for it on the daily chart.
There is alternation within primary wave 3 impulse, between the double zigzag of intermediate wave (2) and the possible triangle or combination of intermediate wave (4).
When primary wave 3 is a complete impulse, then a large correction would be expected for primary wave 4. This may be shallow.
Thereafter, primary wave 5 may be expected to be relatively short, ending about the final target at 2,500.
It is also still possible that primary wave 3 was over at the high labelled intermediate wave (3) (this idea has been published previously) and that would mean that price should currently be within primary wave 4. This idea does not at this stage diverge in terms of expected direction or structure from the daily alternate wave count below, so for clarity and to keep the number of charts manageable it will not be published on a daily basis. I will follow the idea and will again publish it when it begins to diverge from the main wave count.
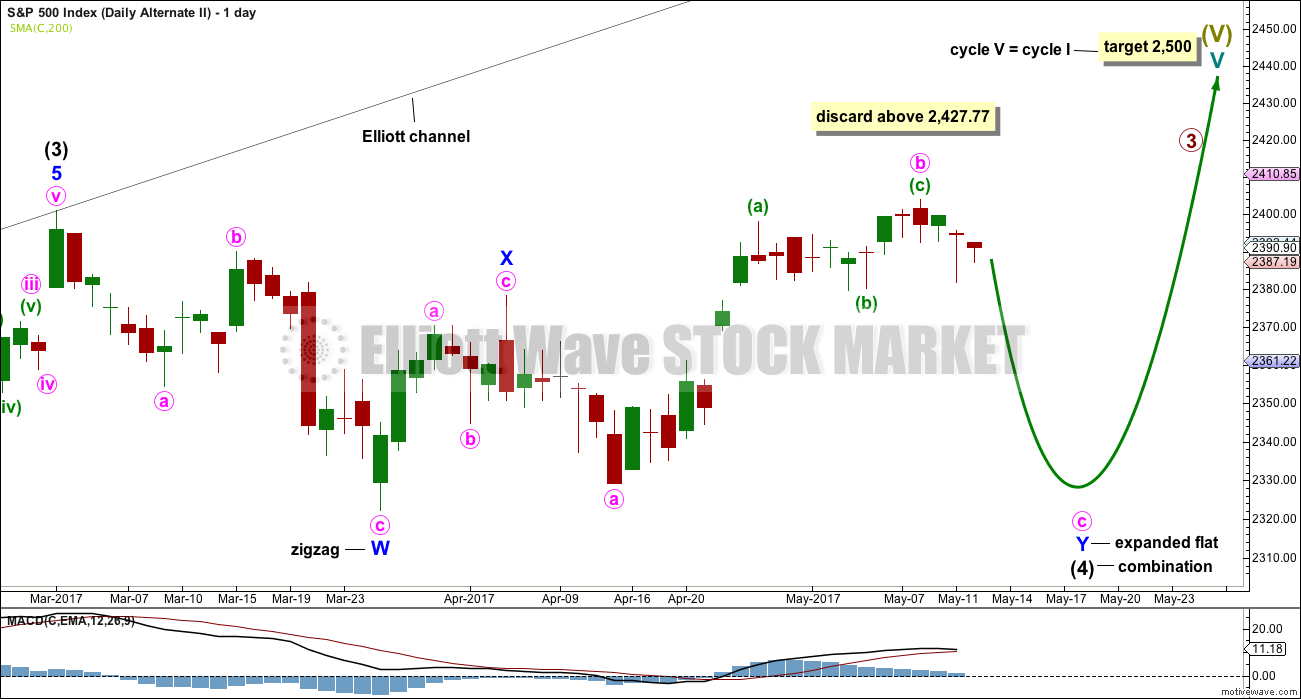
DAILY CHART
Click chart to enlarge.
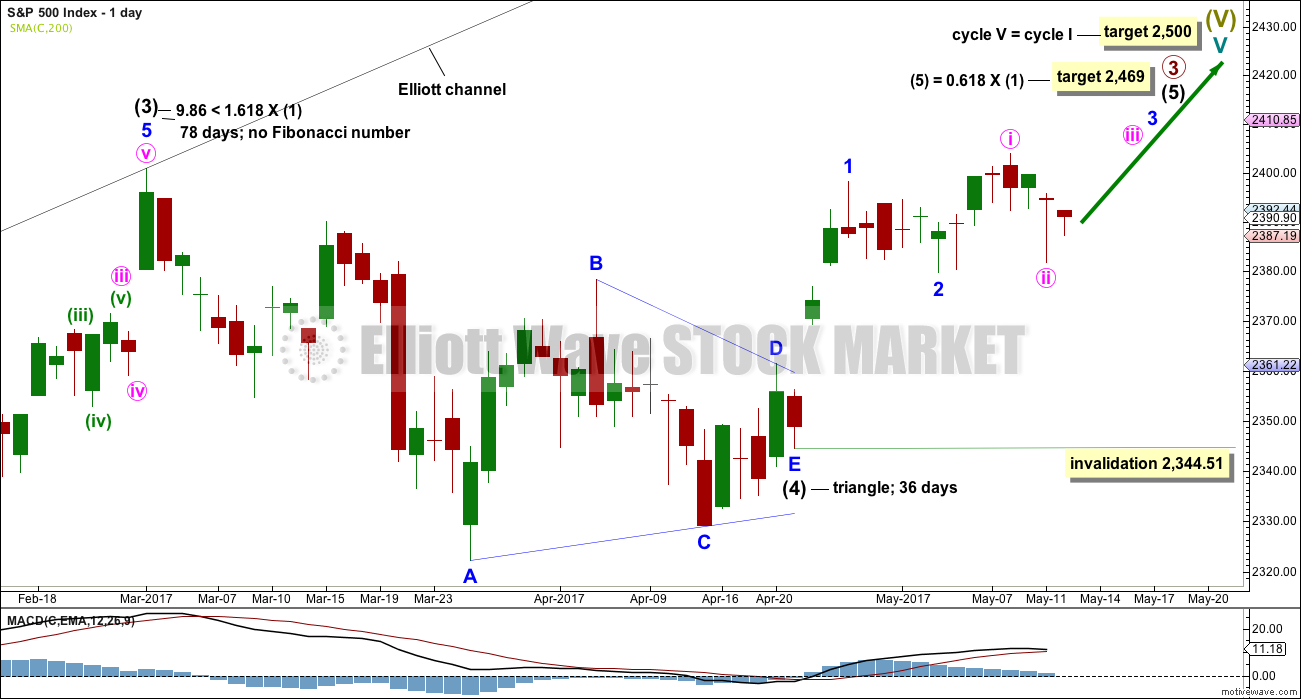
Intermediate wave (4) may be a complete regular contracting triangle. It may have come to a surprisingly swift end with a very brief E wave.
There is already a Fibonacci ratio between intermediate waves (3) and (1). This makes it a little less likely that intermediate wave (5) will exhibit a Fibonacci ratio to either of intermediate waves (1) or (3); the S&P often exhibits a Fibonacci ratio between two of its three actionary waves but does not between all three.
Within intermediate wave (5), minor waves 1 and now 2 look to be complete.
Within minor wave 3, no second wave correction may move beyond its start below 2,379.75. However, an alternate idea below at the hourly chart level looks at the possibility that minor wave 2 may not be over and may continue lower. This idea has an invalidation point at the start of minor wave 1 at 2,344.51.
The structure of intermediate wave (5) on the daily chart does not look complete. So far it looks like a possible three up. Minor wave 3 still needs to complete, then minor waves 4 and 5. This may last another couple of weeks at least.
HOURLY CHART
Click chart to enlarge.
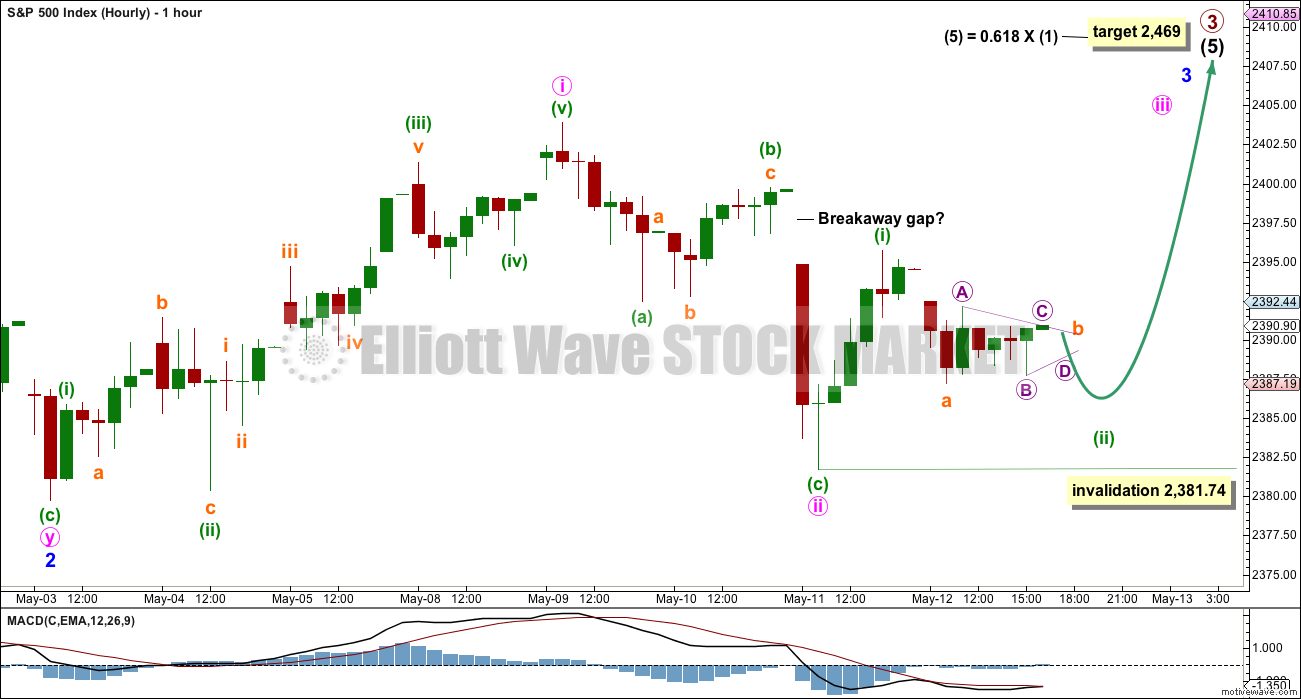
Minor wave 2 may have completed as a double zigzag.
This main wave count still expects to see an increase in upwards momentum over the next few days.
Sideways movement for Friday’s session may have been a small B wave triangle completing, within a zigzag for minuette wave (ii).
Minuette wave (ii) may not move below the start of minuette wave (i) at 2,381.74.
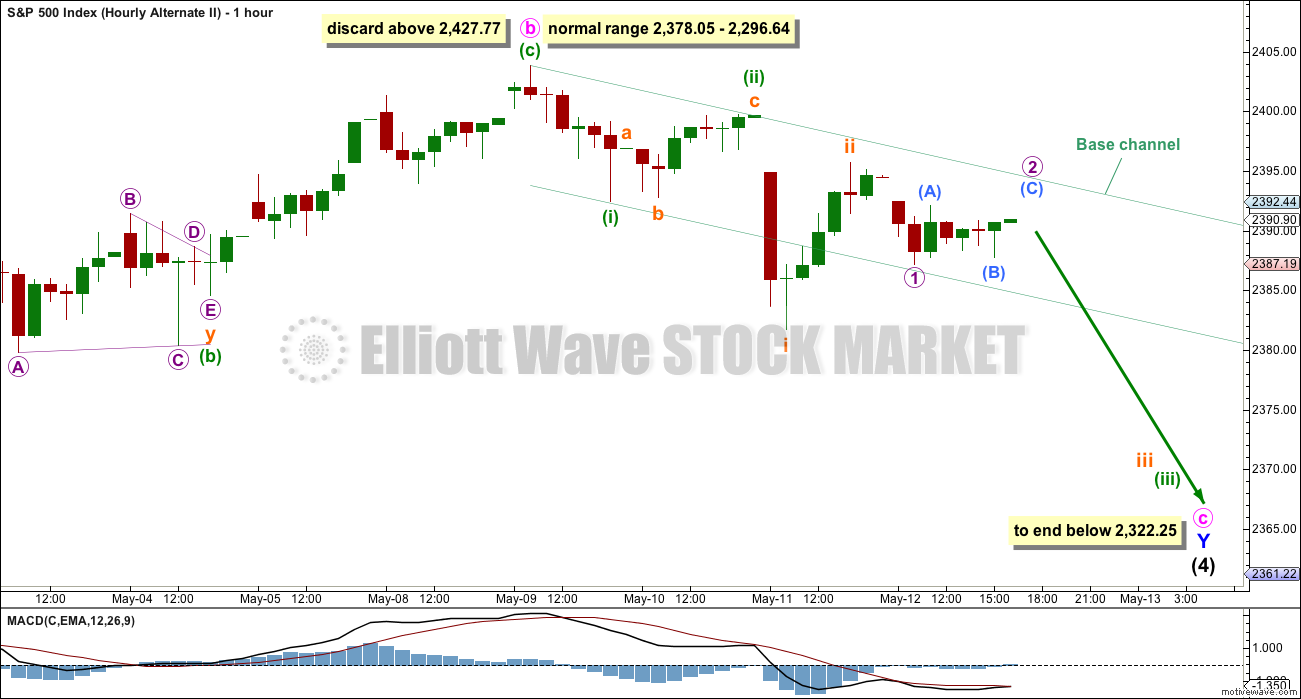
ALTERNATE HOURLY CHART
Click chart to enlarge.
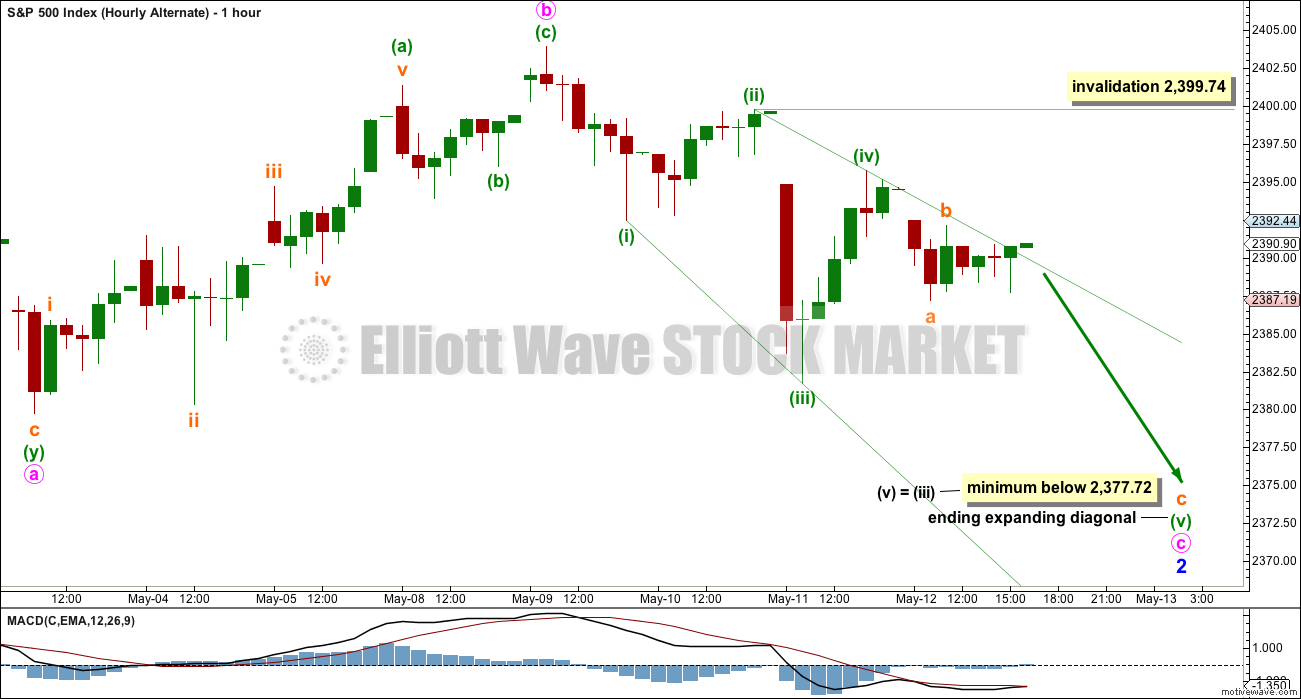
It is also possible that minor wave 2 is continuing further as an expanded flat correction. The upwards wave here labelled minute wave b will fit as either a five wave impulse (main wave count) or three wave zigzag (this alternate). Both possibilities are considered.
If minor wave 2 is incomplete, then within it minute wave b is a 1.31 length of minute wave a, within the normal range of 1 to 1.38.
Minute wave c looks like a diagonal with the strong overlapping. The diagonal would be expanding, giving a minimum requirement for the fifth wave to meet rules regarding wave lengths for expanding diagonals.
Diagonals normally adhere very well to their trend lines, and the small overshoot at the end of Friday is acceptable. But if the (i)-(iv) trend line is breached on Monday, then this idea should be discarded based upon a very low probability even before invalidation.
The minimum requirement for minuette wave (v) would also take minute wave c below the end of minute wave a at 2,379.75, avoiding a truncation and a very rare running flat.
ALTERNATE DAILY CHART
Click chart to enlarge.
What if intermediate wave (4) was not a complete triangle but is still unfolding as a double combination? The subdivisions of this wave count would be labeled in the same way, with the exception of the degree of labelling, if the correction were to be primary wave 4.
Double combinations are very common structures. This would still provide perfect alternation in structure with the double zigzag of intermediate wave (2). Although double zigzags and double combinations are both labelled W-X-Y, they are very different structures and belong to different groups of corrections.
The purpose of combinations is the same as triangles, to take up time and move price sideways. Intermediate wave (2) lasted 58 days. So far intermediate wave (4) has lasted 51 days. If it continues for another one to two weeks, it would still have excellent proportion with intermediate wave (2).
This alternate wave count still has some support from classic technical analysis, particularly extreme ADX at the weekly chart level.
ALTERNATE HOURLY CHART
Click chart to enlarge.
Minute wave b is now a 1.52 length of minute wave a. This is longer than the common range of up to 1.38, but still within allowable limits of up to 2. The higher minute wave b goes the lower the probability that this wave count is correct.
However, I have seen plenty of expanded flat corrections with B waves longer than 1.38 times the length of their A waves. This wave count remains entirely acceptable.
Minute wave c would now have three overlapping first and second wave corrections. A base channel is added for minuette waves (i) and (ii). Along the way down, lower degree corrections should find resistance at the upper edge of this base channel.
If price breaks above the upper edge of the base channel now, then the probability of this wave count would reduce substantially.
TECHNICAL ANALYSIS
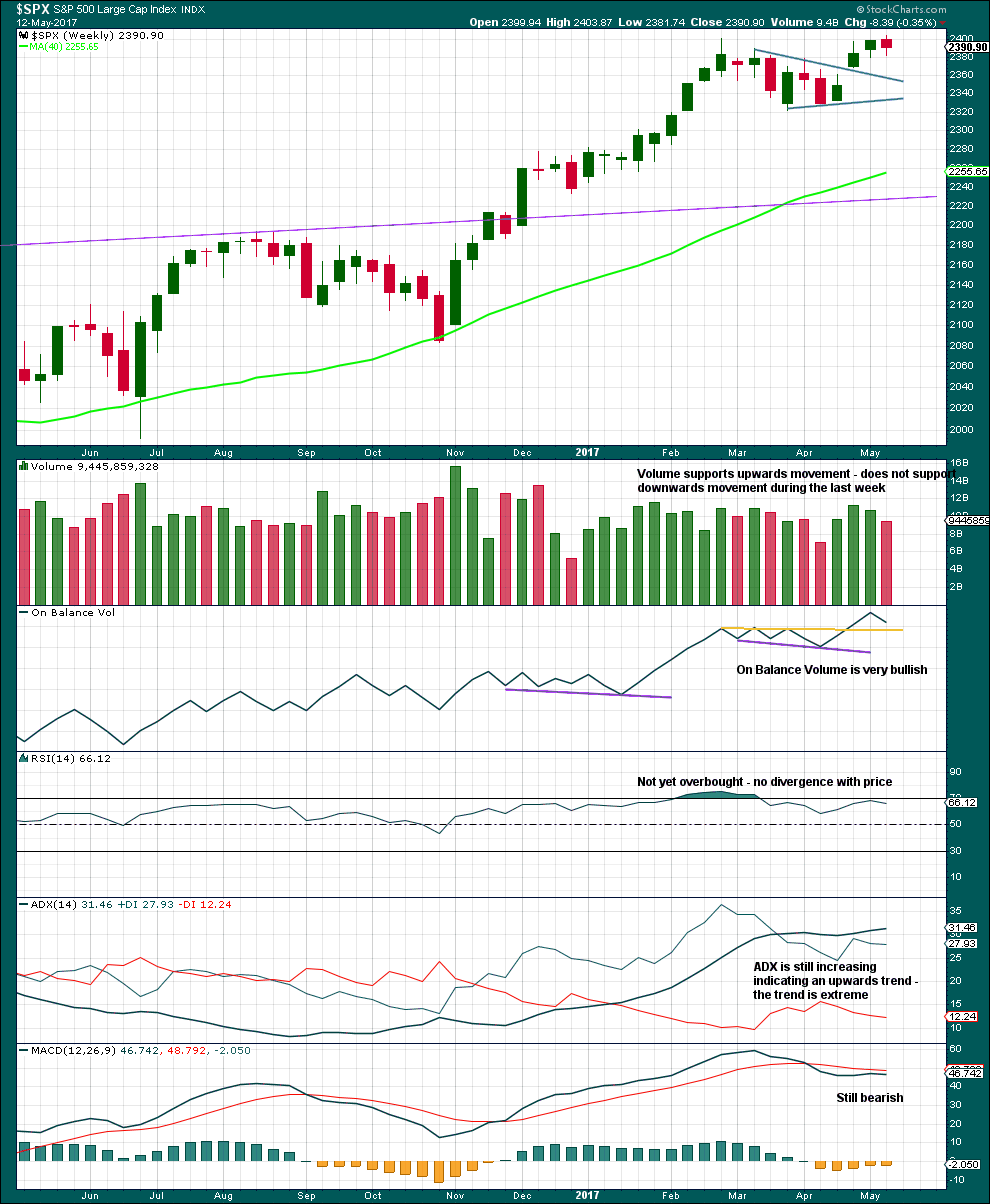
WEEKLY CHART
Click chart to enlarge. Chart courtesy of StockCharts.com.
An upwards week is completed but closes red. The balance of volume is down and it shows a decline. Downwards movement during the week did not have support from volume. This looks like a pullback within a larger upwards trend.
ADX is extreme and nearing very extreme. A bigger consolidation or deeper pullback should be expected.
Within this bull market, beginning in March 2009, this has happened at the weekly chart level on four occasions: January 2010, the end of February 2011, early June 2013, and late July 2014. On each occasion it was immediately followed by three to four weeks of downwards movement.
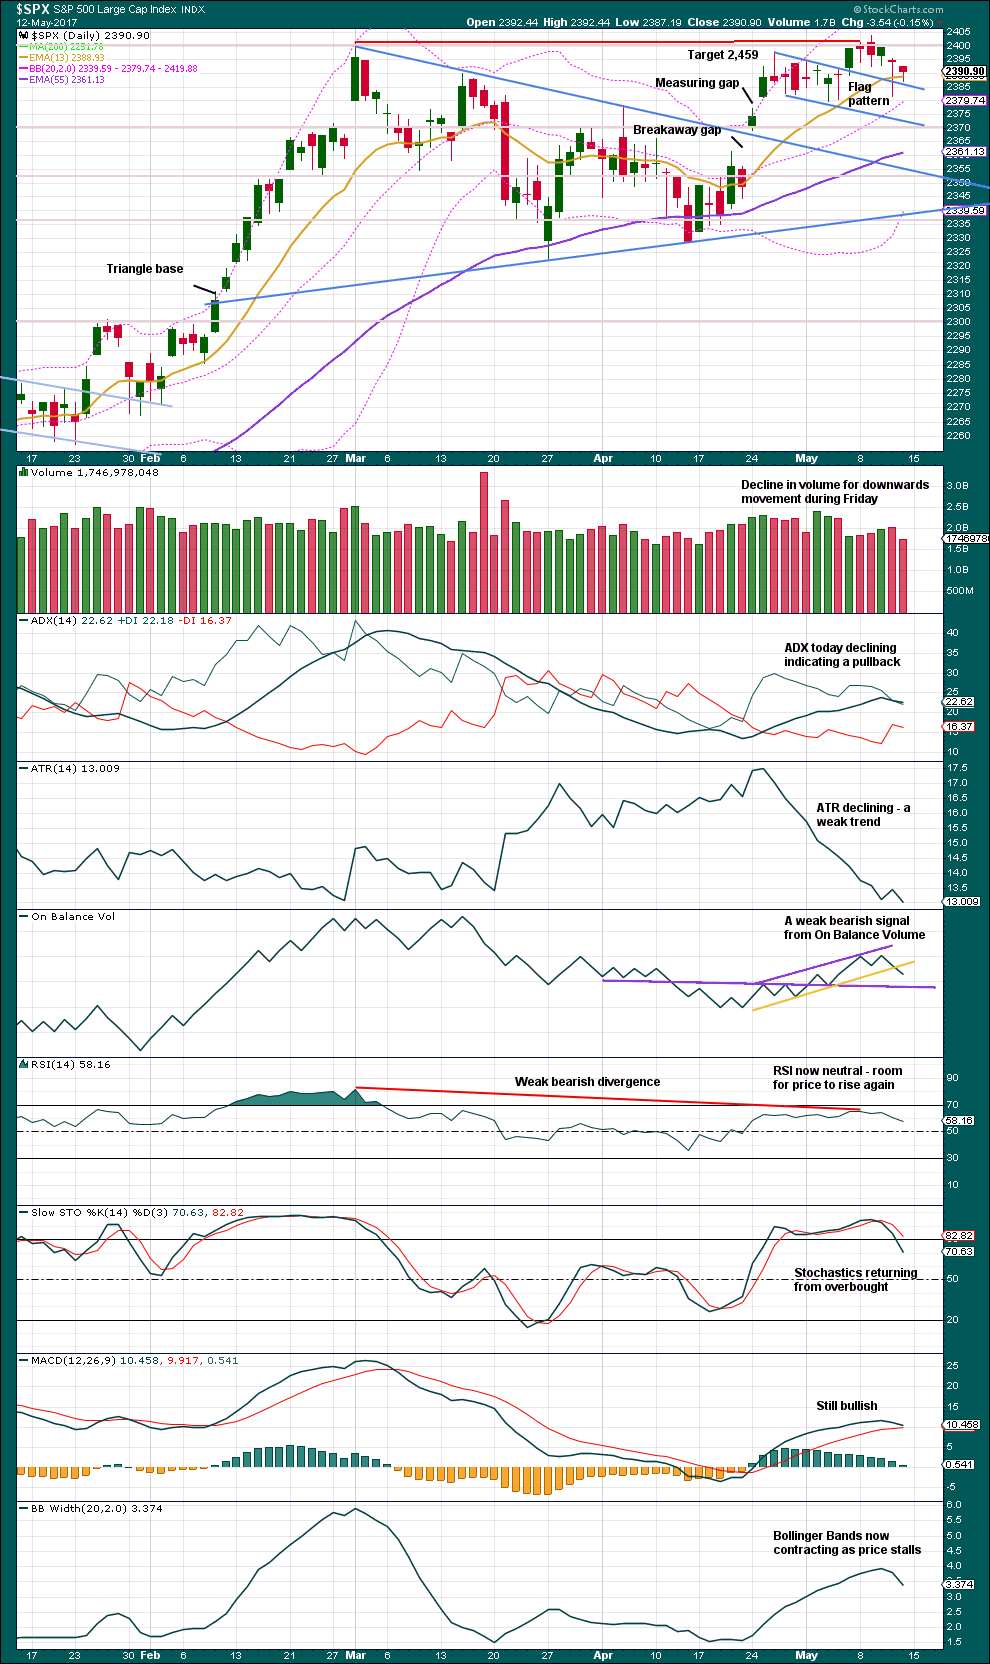
DAILY CHART
Click chart to enlarge. Chart courtesy of StockCharts.com.
The last five daily candlesticks all have long lower wicks. The Dragonfly doji for the 11th of May is particularly bullish. All together it looks very strongly like further upwards movement will result from this bullishness.
There is more support from volume for recent upwards days than downwards.
The signal from On Balance Volume is weak because the yellow line has been tested only twice before, is not long held, and is reasonably steep. There is support close by for On Balance Volume.
The last measuring gap has its lower edge at 2,376.98 and this is offering support. Support has been tested multiple times now, and each test strengthens it, so it is reasonable to expect it to continue to hold next week.
VOLATILITY – INVERTED VIX CHART
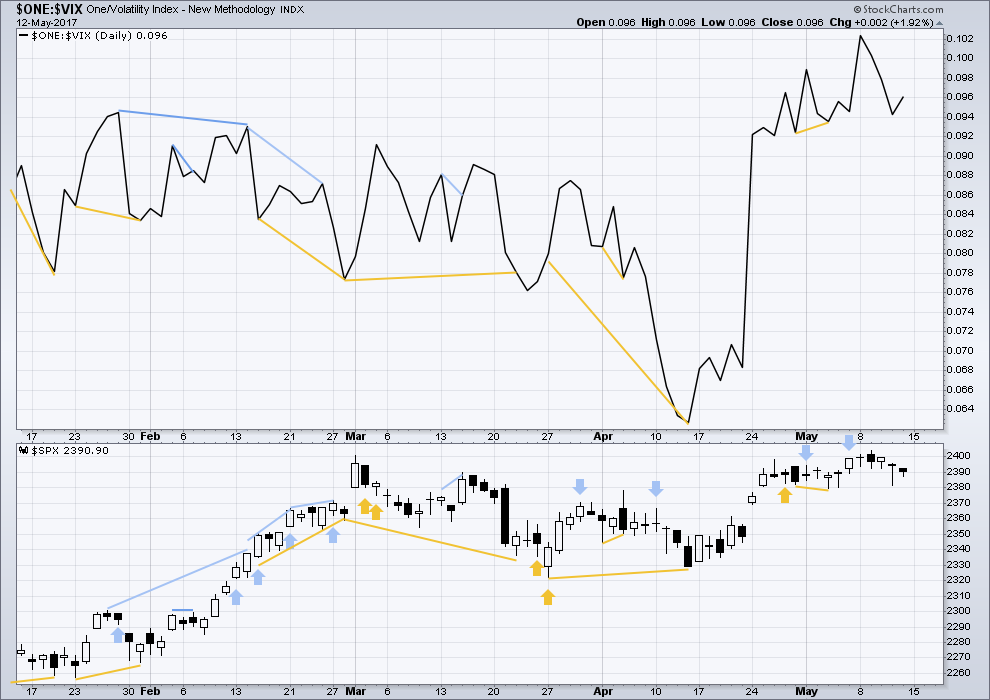
Click chart to enlarge. Chart courtesy of StockCharts.com.
Normally, volatility should decline as price moves higher and increase as price moves lower. This means that normally inverted VIX should move in the same direction as price.
It is noted that there are now six multi day instances of bullish divergence between price and inverted VIX, and all have been followed so far by at least one upwards day if not more. This signal seems to again be working more often than not. It will again be given some weight in analysis.
There is no new divergence between price and inverted VIX today.
BREADTH – AD LINE
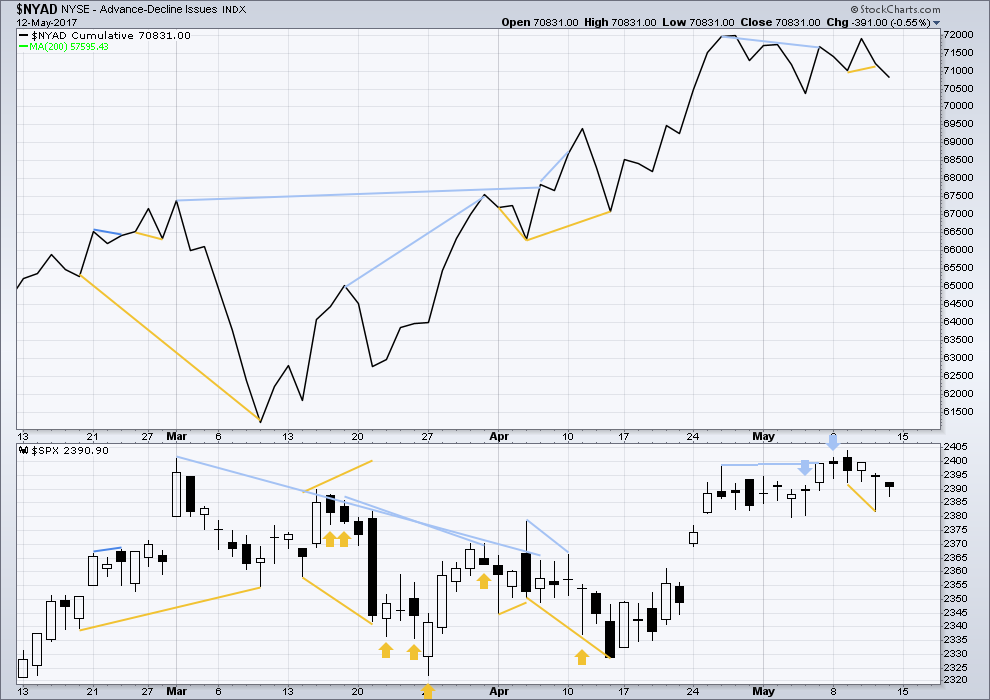
Click chart to enlarge. Chart courtesy of StockCharts.com.
Short term bullish divergence noted in yesterday’s analysis has not been followed by upwards movement, only sideways.
DOW THEORY
The DJIA, DJT, S&P500 and Nasdaq continue to make new all time highs. This confirms a bull market continues.
The following lows need to be exceeded for Dow Theory to confirm the end of the bull market and a change to a bear market:
DJIA: 17,883.56.
DJT: 7,029.41.
S&P500: 2,083.79.
Nasdaq: 5,034.41.
Charts showing each prior major swing low used for Dow Theory are here.
This analysis is published @ 12:45 a.m. EST on 13th May, 2017.
As we approach the end of this long-in-the-tooth bull market, I keep wondering how the entire thing will end. EW is all about order and predictability so far as the waves are concerned, and that fact is self-evident. Nonetheless, I cannot help but keep in mind we are sailing in historically uncharted financial waters. We have unprecedented levels of debt, both corporate and government, the criminal and reckless behavior of central banks have reached an unimaginable scale. The very idea of almost one quadrillion of derivatives simply boggles the mind. The artificially suppressed interest rate is not some arbitrary artifact of central banks, governments could not service their debt otherwise so that scheme for them is actually a matter survival. What if the unwinding of this frightful mess is neither orderly nor predictable? After all, in terms of the size of this bubble, we have never ever seen anything quite like this. My recurring nightmare is going to bed under seemingly normal circumstances and waking up to futures bleeding red like we have never seen. Call me a conspiracy theorist, but does anybody think the banksters are really going to let all those Amazon shareholders walk away with cash equivalent to 177 times earnings? Oh I know, everyone is thinking they will have plenty of time to head for the exits and are quite sure they will make it there before the other guy does. And so they all think.
What it seems to me, that no one is contemplating, is a sudden and catastrophic conclusion to this remarkable experiment in extreme leverage. I personally don’t use it, and I rarely keep big positions in the market overnight anymore. After all, we have to remember that brokerage accounts are not FDIC insured. While I fully understand that the trading sweet spot of the coming collapse is going to be the heart of the third wave down, frankly I am probably going to end up watching it from a distance, having taken my chips and gone home after the first leg down. I expect circuit breaker to be triggered world wide during that event. I remember Tim Knight saying that the coming bear market was one that even he was not going to like, and the man is an inveterate bear! It could well be that whatever remains in brokerage accounts will be seized to try and stem the tidal wave of banks collapsing. Read the fine print. Stay frosty! 🙂
I won’t be leaving any money (bar the minimum) in any bank or brokerage account.
Cash will be king.
My only concern there is will we have enough time to get money out?
Lara you are my ace in the hole. I am expecting we will get a very good read on the first wave down. The second wave correction will probably be deep, and accompanied by even more mania than at the top. That will be the time. I too plan on having stripped down accounts ahead of the dive…just in case…
Problem is… all currencies will most likely be outlawed, with little to no exchange at all on printed bills or coinage. Physical gold and silver too. Electronic payments only, regulated harshly like nothing we’ve ever imagined.
Art Cashin of CNBC made an interesting point today. He stated that if the republicans passed tax reform with a lower capital gains tax the rich may be prompted to sell to lock in gains. Let’s say someone has 10 million and invested 1 million 10 years ago. There tax on 9 million at 20 percent would be 1.8 million…at 10 percent would be 900k, so about a 10 percent savings. They are betting the market won’t go down by that much before they unload. Some will probably sell on first news this is going through, others will wait until it happens…sell on the news….would create the breakdown the market Lara is forecasting shortly….
I think the main wave count is correct. We are just not seeing the kind of momentum one would expect with a primary degree correction. What has been a puzzle for me personally is the similar lack of impetus for a presumed third wave up. Perhaps waning momentum is indicative of an approaching final top; Some were expecting the opposite.
I’m thinking one more move up to finish B of (4).
Then a good 5 wave move down for C over a few weeks to below 2322.25 to finish (4).
This should also bring ADX down
Primary 2 tagged the 200 dma. Intermediate two of Lara’s count did as well. That would take price down to around 2251
Joe yesterday asked if any one knew about the marketing hoopla surrounding EWI’s May EWT publication. The only thing I have been able to determine is that Prechter is now saying that for the first time he can count a complete five up at multiple degrees in the indices. He is still however, of the personal opinion that we have to complete a fourth prior to the fifth wave up.
Thanks for illuminating the reason for the hype.
Without some good solid divergence with market breadth, momentum and RSI… I think that’s premature.
Yes definitely Lara. He’s been calling tops since 1987.
The man is an enigma. Clearly quite bright.
But also clearly unfazed by the fact that he has been so horribly, glaringly wrong so often!
Lara, I appreciate your analysis. Thank you.
Below is a count of daily IWM I’ve been watching. Perhaps Intermediate wave 4 for the SPX is taking a similar pathway / count. Any thoughts?
For the S&P the idea looks a bit far fetched. I don’t like to consider a triangle when it’s only finishing wave B, a flat or combination is a better option at that point.
For IWM it looks okay. But I’d be considering an alternate to that triangle. Too many times triangles look like they’re completing…. only for something else to take shape.
Gotta love being first especially since the weekend analysis counts as a double!