
A small inside day closes green. Price remains above stops on long positions. The Elliott wave analysis remains the same.
Summary: The upwards trend has most likely resumed, but a strong warning from ADX at the weekly chart level means members should keep stops on long positions tight and be prepared to take profits more quickly than usual. Stops may remain just below 2,389.38 at this time. The profit target remains at 2,469.
Always remember my two Golden Rules for trading:
1. Always use a stop.
2. Invest only 1-5% of equity on any one trade.
New updates to this analysis are in bold.
Last monthly and weekly charts are here. Last historic analysis video is here.
MAIN ELLIOTT WAVE COUNT
WEEKLY CHART
Click chart to enlarge.
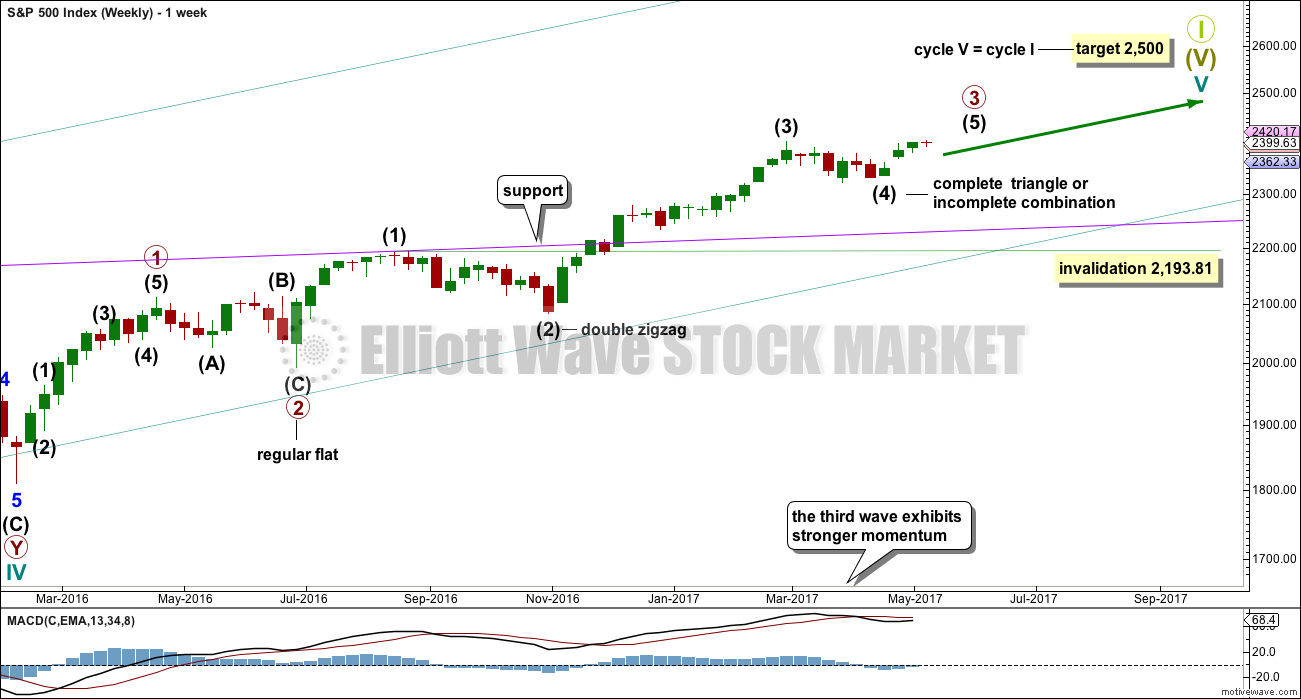
This wave count sees the middle of primary wave 3 a stretched out extension, which is the most typical scenario for this market.
Primary wave 3 may be incomplete. A target is now calculated for it on the daily chart.
There is alternation within primary wave 3 impulse, between the double zigzag of intermediate wave (2) and the possible triangle or combination of intermediate wave (4).
When primary wave 3 is a complete impulse, then a large correction would be expected for primary wave 4. This may be shallow.
Thereafter, primary wave 5 may be expected to be relatively short, ending about the final target at 2,500.
DAILY CHART
Click chart to enlarge.
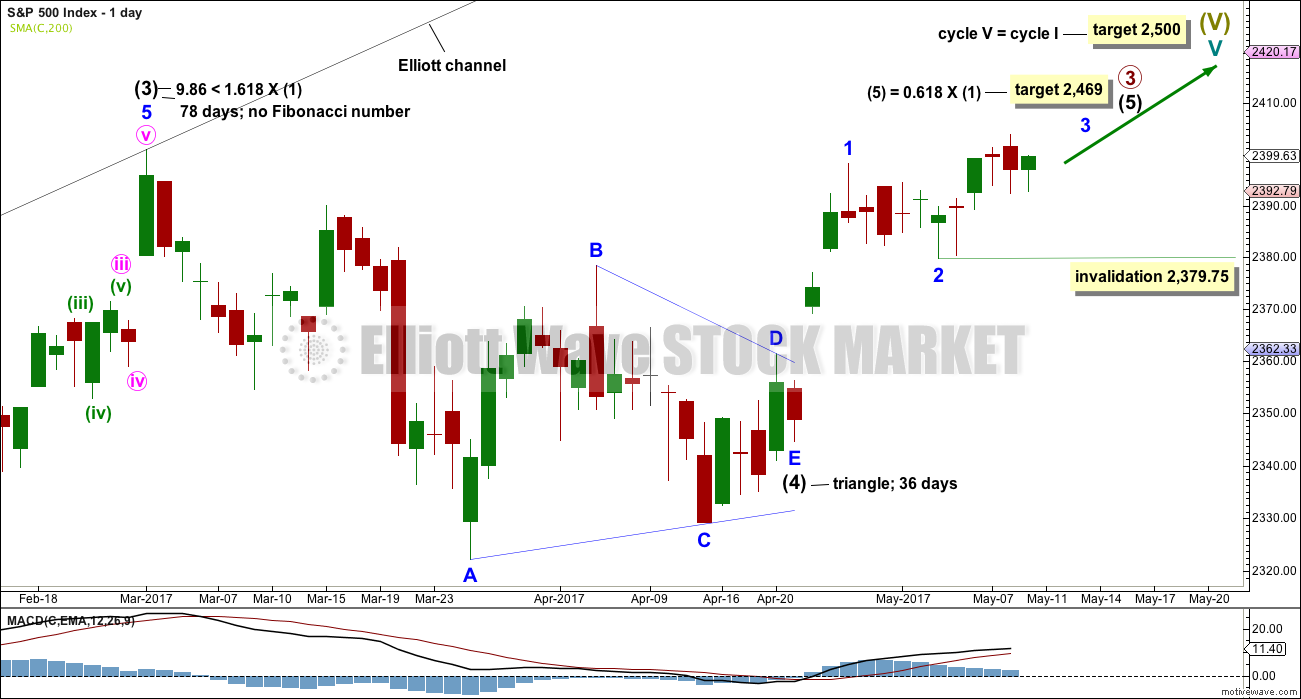
Primary wave (4) may be a complete regular contracting triangle. It may have come to a surprisingly swift end with a very brief E wave.
There is already a Fibonacci ratio between intermediate waves (3) and (1). This makes it a little less likely that intermediate wave (5) will exhibit a Fibonacci ratio to either of intermediate waves (1) or (3); the S&P often exhibits a Fibonacci ratio between two of its three actionary waves but does not between all three.
Within intermediate wave (5), minor waves 1 and now 2 look to be complete.
Within minor wave 3, no second wave correction may move beyond its start below 2,379.75.
The structure of intermediate wave (5) on the daily chart does not look complete. So far it looks like a possible three up. Minor wave 3 still needs to complete, then minor waves 4 and 5. This may last another couple of weeks at least.
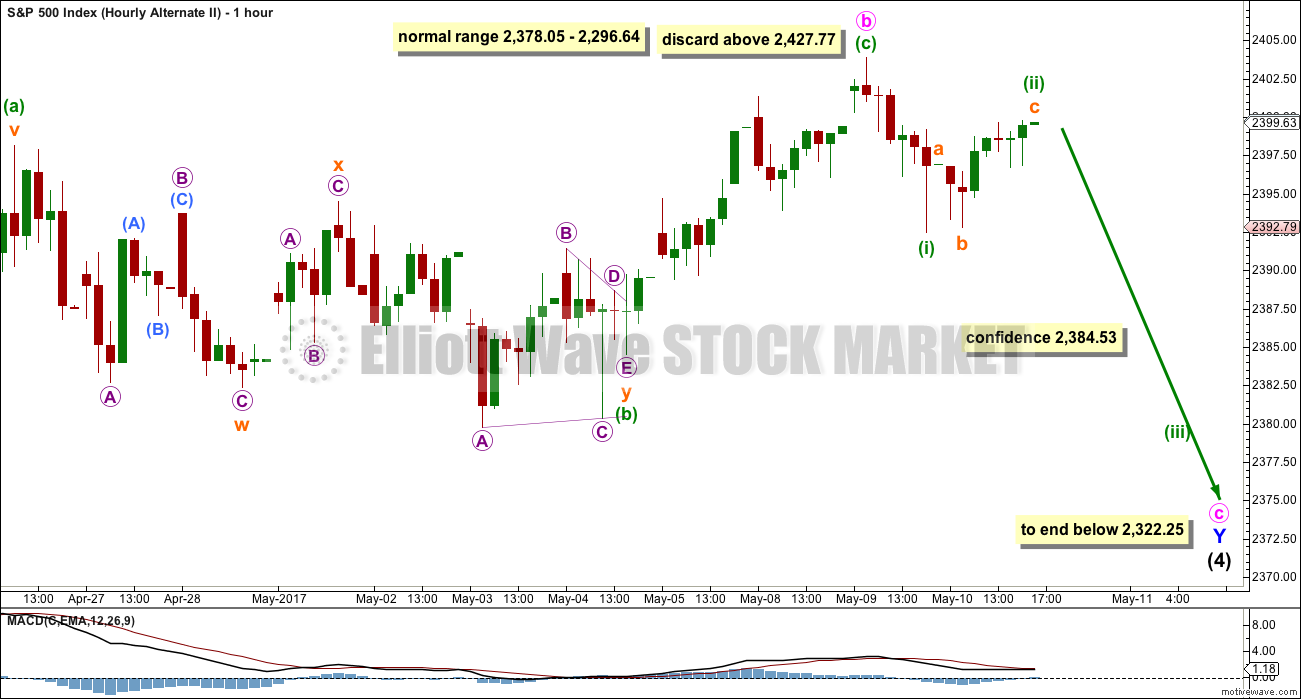
HOURLY CHART
Click chart to enlarge.
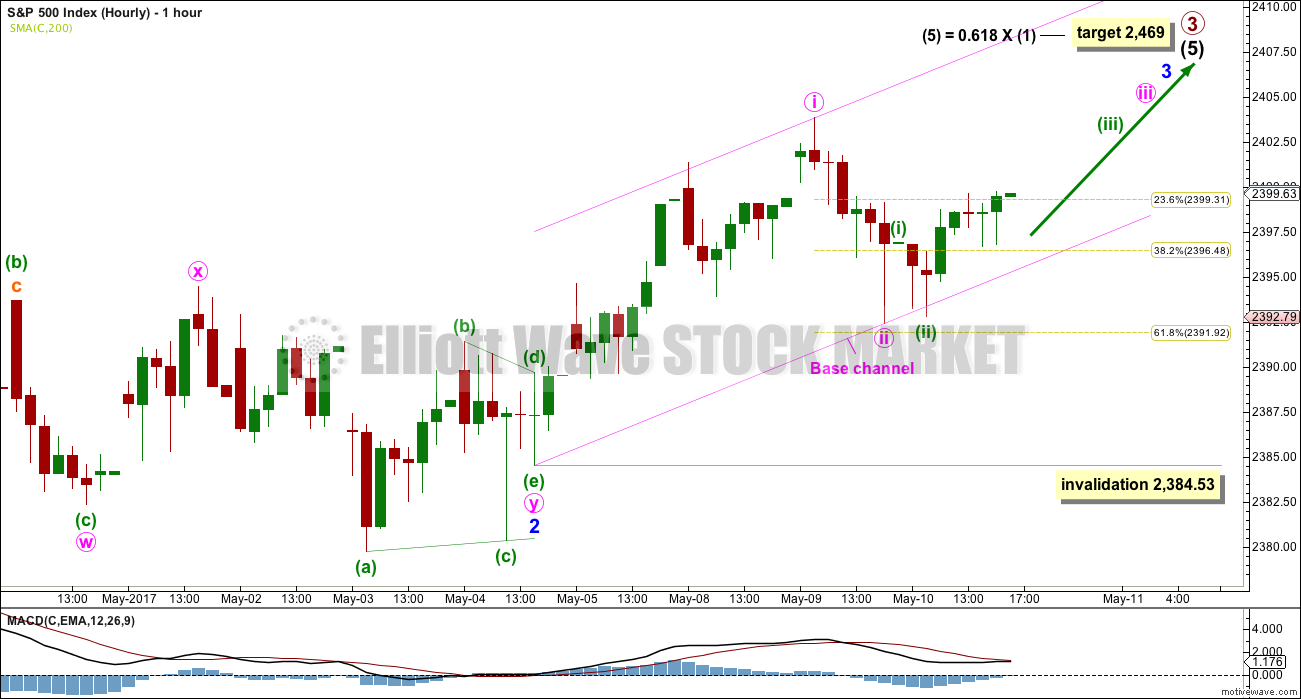
Minor wave 2 may have competed as a double combination: zigzag – X – triangle.
After analysis of minute wave i on the five minute chart, it is possible to see minute wave i over at yesterday’s high. Minute wave ii may have ended close to the 0.618 Fibonacci ratio.
A base channel is drawn about minute waves i and ii. Along the way up, if this wave count is correct, lower degree corrections should now find support at the lower edge of this base channel.
Minute wave ii may not move beyond the start of minute wave i below 2,384.53. At this stage, it is still possible that minute wave ii may continue lower as a double zigzag or sideways as a combination.
Minute wave iii must move above the end of minute wave i, and it must move far enough above that point to allow for room for a subsequent fourth wave correction to unfold and remain above first wave price territory.
Likewise, minor wave 3 must move above the end of minor wave 1 at 2,398.16 and stay far enough above that to allow room for minor wave 4 to unfold and remain above minor wave 1 price territory.
If this wave count is correct, then some increase in upwards momentum should be seen over the next few days.
ALTERNATE DAILY CHART
Click chart to enlarge.
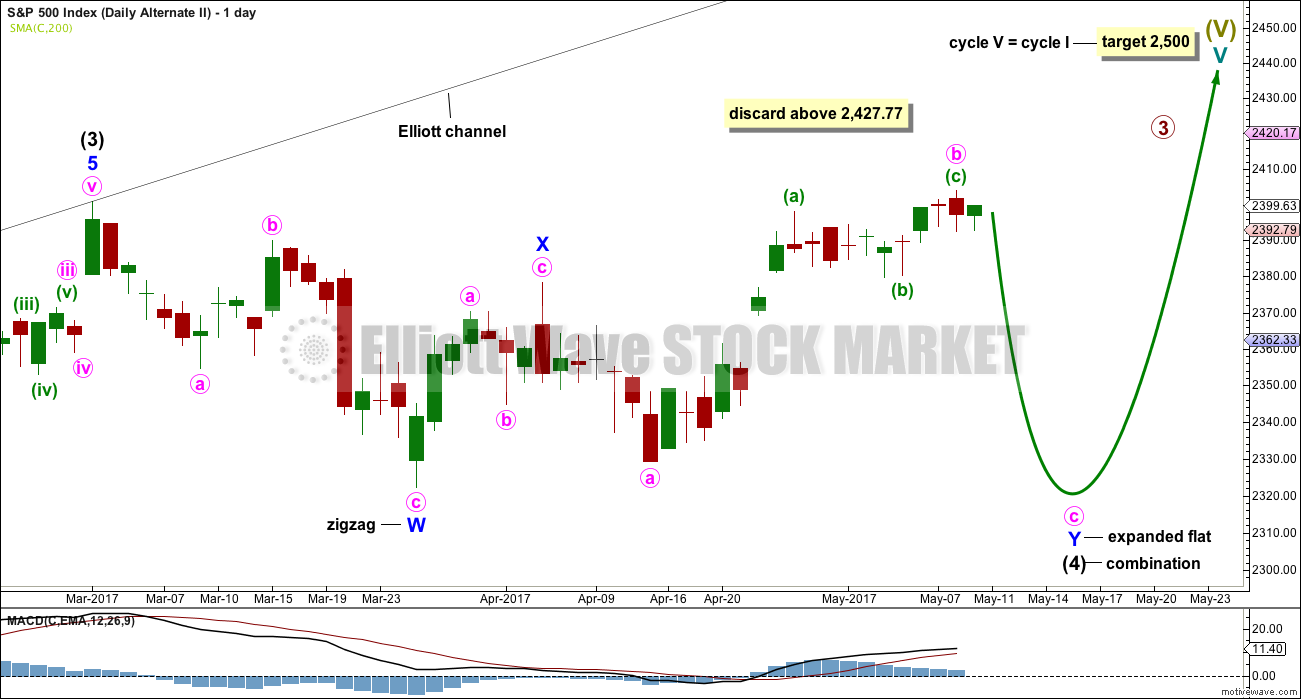
What if intermediate wave (4) was not a complete triangle but is still unfolding as a double combination?
Double combinations are very common structures. This would still provide perfect alternation in structure with the double zigzag of intermediate wave (2). Although double zigzags and double combinations are both labelled W-X-Y, they are very different structures and belong to different groups of corrections.
The purpose of combinations is the same as triangles, to take up time and move price sideways. Intermediate wave (2) lasted 58 days. So far intermediate wave (4) has lasted 49 days. If it continues for another one to two weeks, it would still have excellent proportion with intermediate wave (2).
This alternate wave count now has some support from classic technical analysis, particularly extreme ADX at the weekly chart level. If price suffers a quick reversal, then this would be the new main wave count.
ALTERNATE HOURLY CHART
Click chart to enlarge.
Subdivisions within the correction here labelled minuette wave (b) and the upwards wave here labelled minuette wave (c) are now seen in the same way for both wave counts.
Minute wave b is now a 1.52 length of minute wave a. This is longer than the common range of up to 1.38, but still within allowable limits of up to 2. The higher minute wave b goes the lower the probability that this wave count is correct.
However, I have seen plenty of expanded flat corrections with B waves longer than 1.38 times the length of their A waves. This wave count remains entirely acceptable.
A new low now below 2,384.53 would see the main wave count discarded in favour of this alternate. If that happens, then expect a deeper and sharper pullback to end intermediate wave (4).
TECHNICAL ANALYSIS
WEEKLY CHART
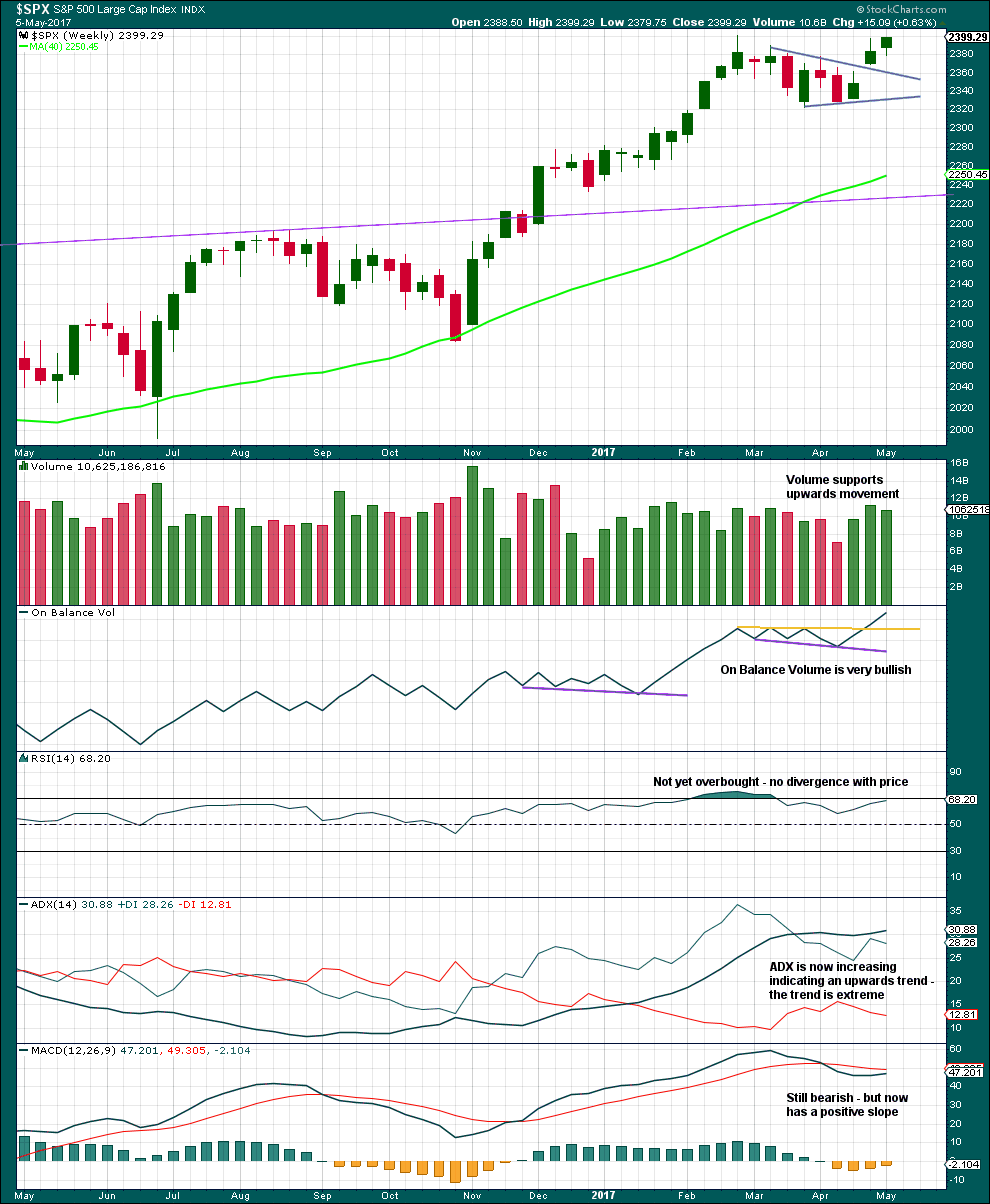
Click chart to enlarge. Chart courtesy of StockCharts.com.
Volume for the last three upwards weeks is all stronger than the two downwards weeks prior. There is more support for upwards movement than downwards. This is bullish.
The only concern here is ADX is extreme. Within this bull market, beginning in March 2009, this has happened at the weekly chart level on four occasions: January 2010, the end of February 2011, early June 2013, and late July 2014. On each occasion it was immediately followed by three to four weeks of downwards movement.
Extreme ADX at the weekly chart level supports the alternate Elliott wave count.
Very bullish On Balance Volume supports the main Elliott wave count.
DAILY CHART
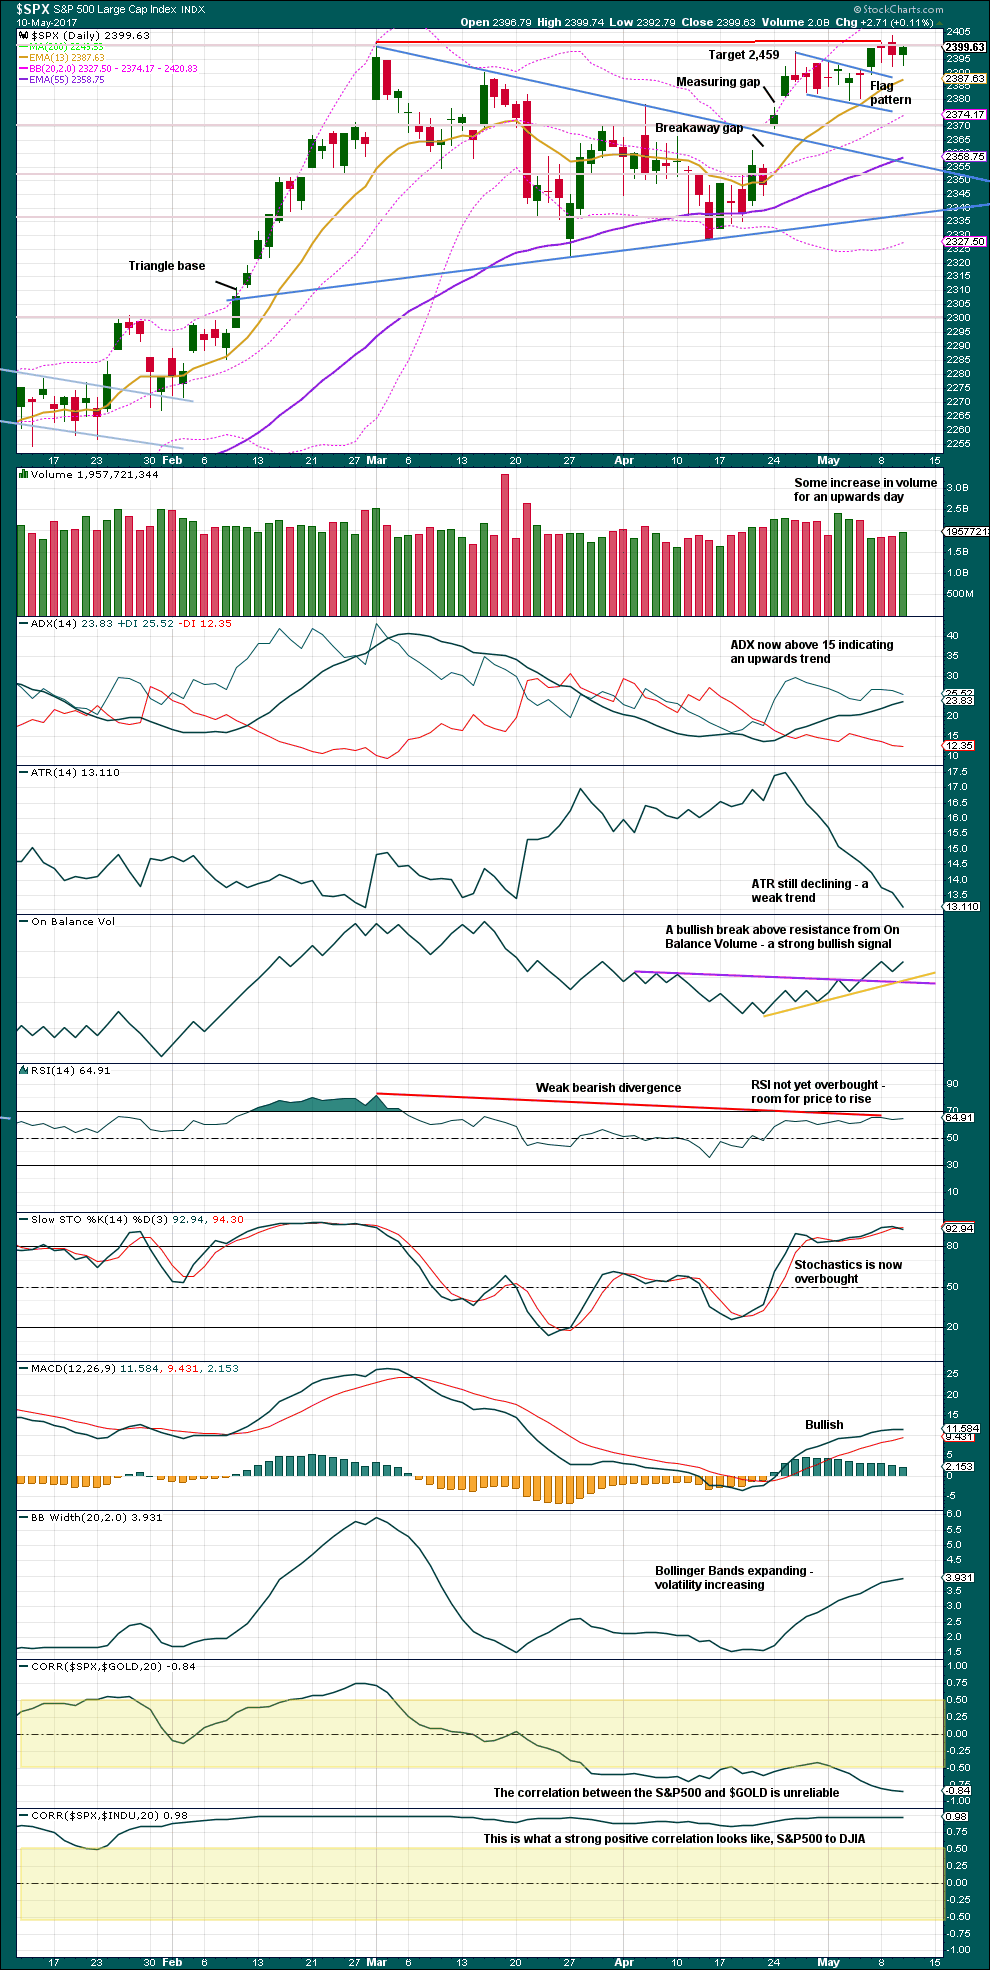
Click chart to enlarge. Chart courtesy of StockCharts.com.
The long lower wicks on the last three daily candlesticks are bullish. It looks reasonable to expect a new all time high tomorrow or very soon.
The target following the breakout from the flag pattern remain in place and is the same.
Volume today is slightly bullish. On Balance Volume is very bullish (give this weight).
MACD, ADX and Bollinger Bands are bullish.
ATR does not support the upwards trend.
There is room for price to rise further: RSI is not overbought, Stochastics does not exhibit divergence with price, and ADX is not yet extreme.
VOLATILITY – INVERTED VIX CHART
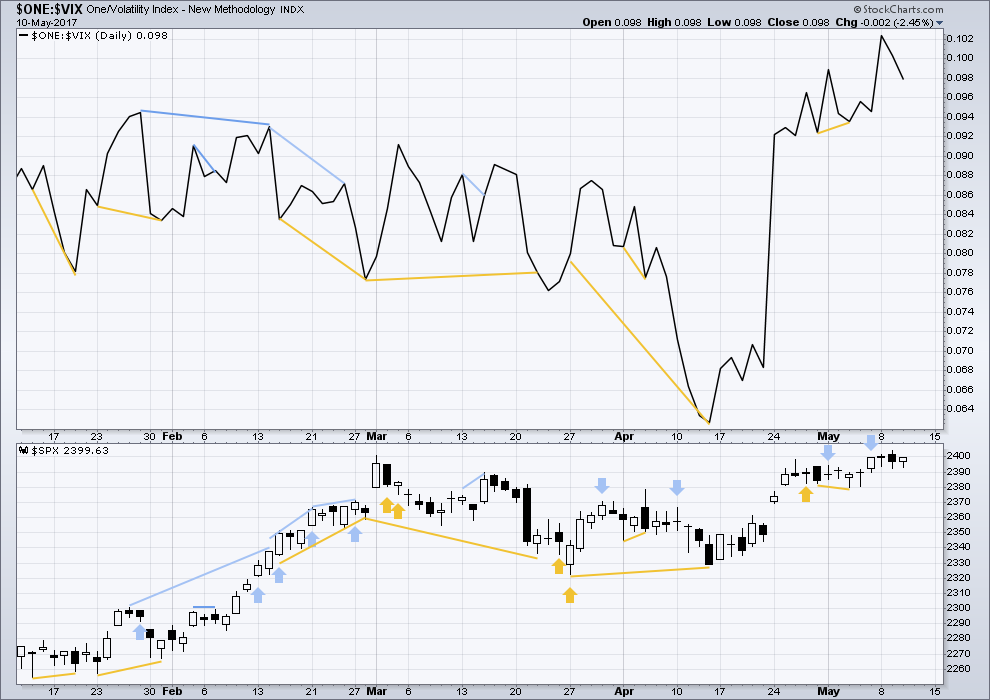
Click chart to enlarge. Chart courtesy of StockCharts.com.
Normally, volatility should decline as price moves higher and increase as price moves lower. This means that normally inverted VIX should move in the same direction as price.
It is noted that there are now six multi day instances of bullish divergence between price and inverted VIX, and all have been followed so far by at least one upwards day if not more. This signal seems to again be working more often than not. It will again be given some weight in analysis.
Because today was an inside day it will not be read as diverging with VIX, although today’s candlestick did close green and the balance of volume was upwards. Any divergence would be too weak to be considered here.
BREADTH – AD LINE
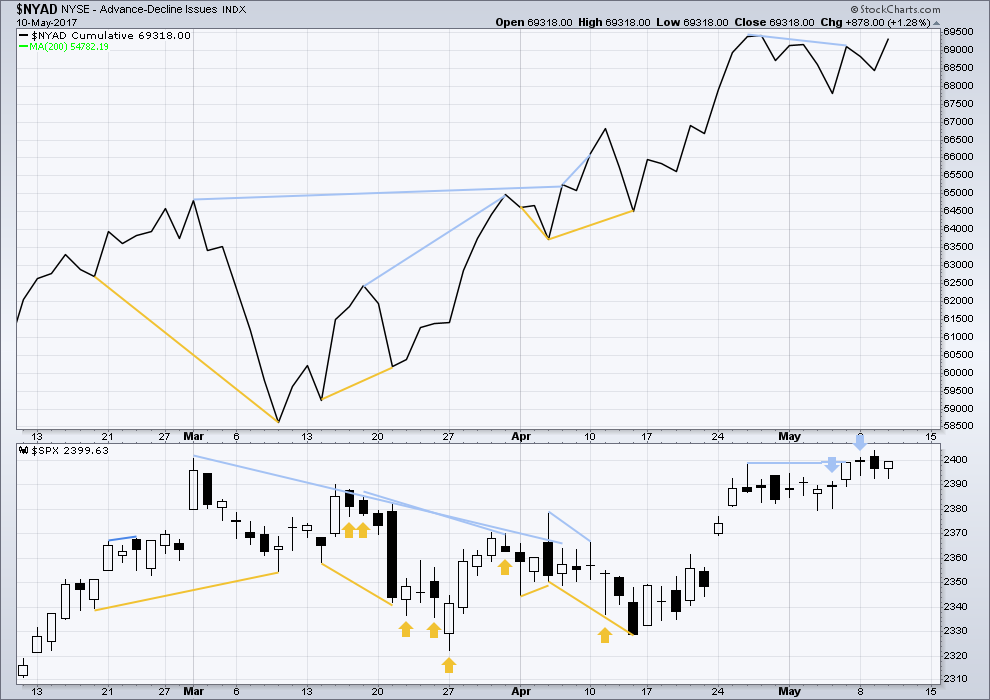
Click chart to enlarge. Chart courtesy of StockCharts.com.
There is no new divergence today. The balance of upwards movement today had support from increasing market breadth.
DOW THEORY
The DJIA, DJT, S&P500 and Nasdaq continue to make new all time highs. This confirms a bull market continues.
The following lows need to be exceeded for Dow Theory to confirm the end of the bull market and a change to a bear market:
DJIA: 17,883.56.
DJT: 7,029.41.
S&P500: 2,083.79.
Nasdaq: 5,034.41.
Charts showing each prior major swing low used for Dow Theory are here.
This analysis is published @ 09:14 p.m. EST.
For any members who own BitCoin:
I’ve just done an Elliott wave analysis on this market over at ElliottWaveGold.com. It’s free, public.
Hourly alternate updated:
two overlapping first and second waves now within minute wave c
That’s my interpretation as well; nested waves that could break down fast only to be propped up one more time; I hope only one more at least
It’s possible that minor 2 is moving lower, was not complete.
But if that’s the case then it should have one more spike down
Take a look at those long lower SPX wicks the last two days. Either the banksters are determined to not let this baby correct or the crowd is in full blown BTFD mode and with a vengeance. I exited the short leg of bearish diamond 208.5/210 call spreads this morning but holding on to the 210 calls just in case. This is nutso! Either VIX heads for the moon tomorrow or another terrific buying opportunity will set up. The longer the correction is delayed, the harder and farther this thing is going to fall when it does arrive. Take care everybody!
Those long lower wicks look very bullish
It is entirely possible that we do not yet have an interim high. This move back up is getting quite deep and I am wondering if the sharp move down was some kind of C wave ahead of a final move up to an interim top…just musing out loud…
I am expecting the banksters to fight the decline tooth and claw. I would not be at all surprised to see an almost 100% retrace of the wave down….
The long upper wick in VIX today again highlights the relentless selling of volatility regardless of where the market is headed. It does not always signal an imminent reversal in VIX.
There will probably be a valiant attempt to fill the gap at 2399.63 from yesterday’s close before we get going in earnest to the downside….
SVXY has two open gaps both likely to be filled, at 145.05 and 127.88.
I expect Mr. Market to dislodge quite a few giddy bulls ahead of the final wave up. It should be a doozey…enjoy the ride… 🙂
It looks like the Alternate daily and Alternate hourly counts will become the main counts. SPX 2384.53 has been breached to the downside. This portends more downside movement for the next week or two.
Now to look for my best exit strategy today or tomorrow for my long positions.
It looks that way. I think we may have to consider the possibility that we are actually in Primary 4, with only Primary 5 to go.
Maybe not…
I should have held that long VIX trade.
The banksters have even çme doubting my RTM instincts! lol! 🙂
Third wave down…
They are not going to stop stupidly trying to short volatility. Look for a sharp retreat, courtesy of mindless bots too dumb to recognize a change in trend…bid opened at 1.30 for next week 10.00 strike calls…
Looking for another VIX smackdown early. Any move below 10.00 is free money. It is tracing out another saucer bottom ahead of a probable move higher.
Eyeing 10.00 strike calls for a good entry.
VIX suppression has resulted in unusually favorable spreads…
Pretty fun watching the algos run them over for once…..
Hey Chris. were you and I the only bearish blokes? 🙂
I guess Peter was also looking for a third. I was glad to hear Lara OK that possible count…
I guess you’re right Verne. It’s bound to start sooner rather than later, but as evidenced today, the banksters are not planning on stifling there manipulation of the markets and theft from the working class anytime soon, so something big has got to spook them, in my opinion, before this thing really has some legs. As an aside, my AI fund is now only 27% allocated with 75% of that short. Last time it did this was July 2015, so some sort of volatility should occur soon.
Foist! 🙂
DAG GUM IT,, dat darn wabbit
🙂