
An outside day remains above support. Classic analysis with a heavy reliance on On Balance Volume is used to determine which Elliott wave count is more likely.
Summary: A brief shallow pullback may have moved sideways and slightly lower on Friday. This may present an opportunity to join the upwards trend. Stops may be set just below the last gap which has its low at 2,356.18. The target is at 2,469.
A new low below 2,344.51 would be bearish; if that happens, expect price to continue lower to 2,319.
Always remember my two Golden Rules for trading:
1. Always use a stop.
2. Invest only 1-5% of equity on any one trade.
New updates to this analysis are in bold.
Last monthly and weekly charts are here. Last historic analysis video is here.
MAIN ELLIOTT WAVE COUNT
WEEKLY CHART
Click chart to enlarge.
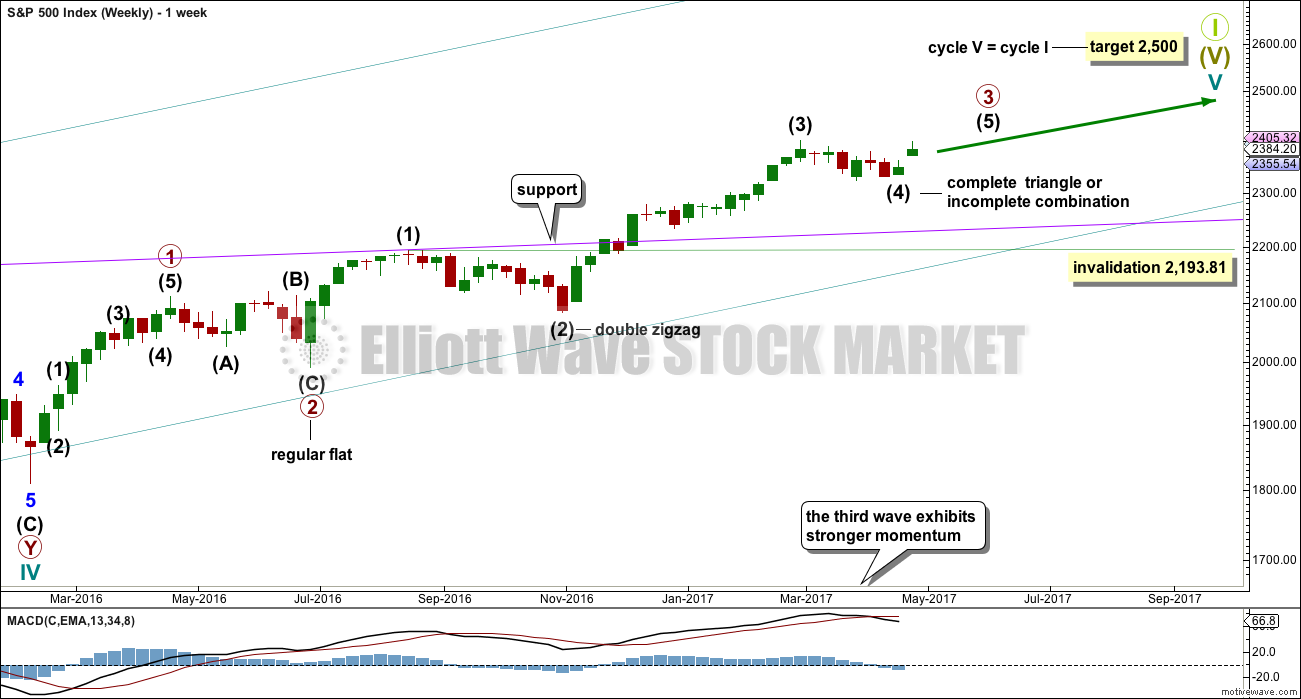
This wave count sees the middle of primary wave 3 a stretched out extension, which is the most typical scenario for this market.
Primary wave 3 may be incomplete. A target is now calculated for it on the daily chart.
There is alternation within primary wave 3 impulse, between the double zigzag of intermediate wave (2) and the possible triangle or combination of intermediate wave (4).
When primary wave 3 is a complete impulse, then a large correction would be expected for primary wave 4. This may be shallow.
Thereafter, primary wave 5 may be expected to be relatively short, ending about the final target at 2,500.
DAILY CHART
Click chart to enlarge.
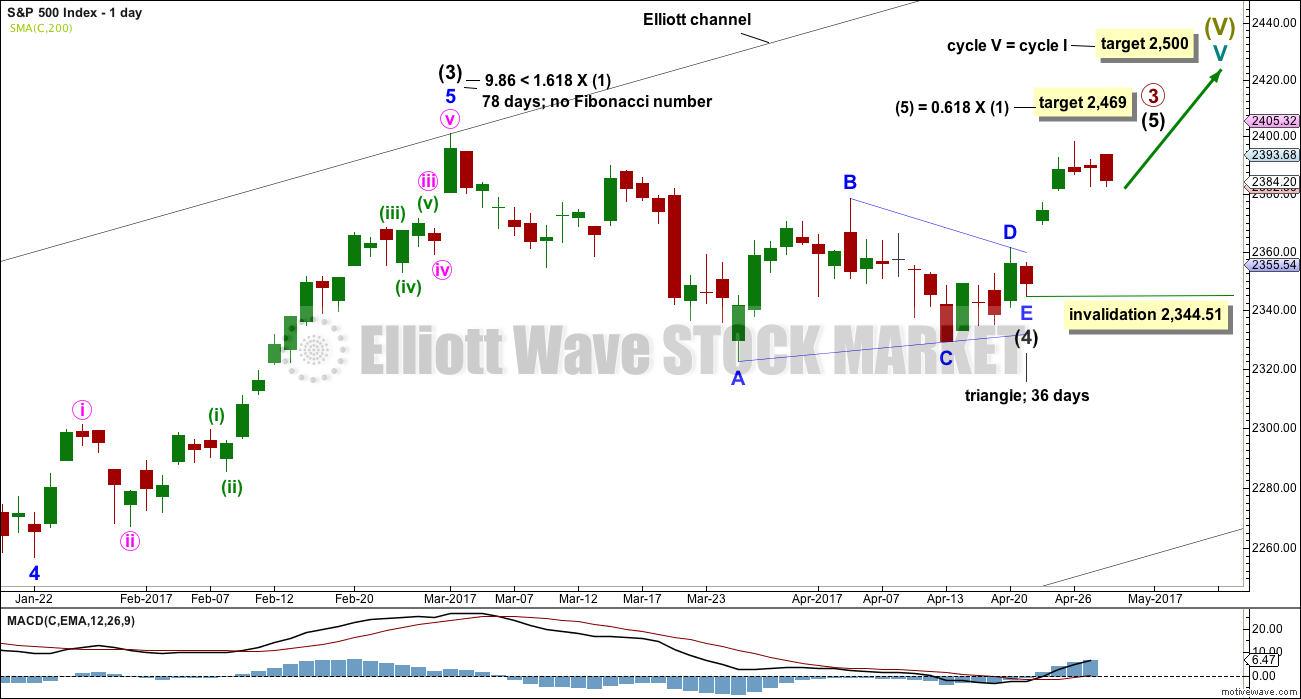
Primary wave (4) may be a complete regular contracting triangle. It may have come to a surprisingly swift end with a very brief E wave.
There is already a Fibonacci ratio between intermediate waves (3) and (1). This makes it a little less likely that intermediate wave (5) will exhibit a Fibonacci ratio to either of intermediate waves (1) or (3); the S&P often exhibits a Fibonacci ratio between two of its three actionary waves but does not between all three.
Within intermediate wave (5), no second wave correction may move beyond the start of its first wave below 2,344.51.
HOURLY CHART
Click chart to enlarge.
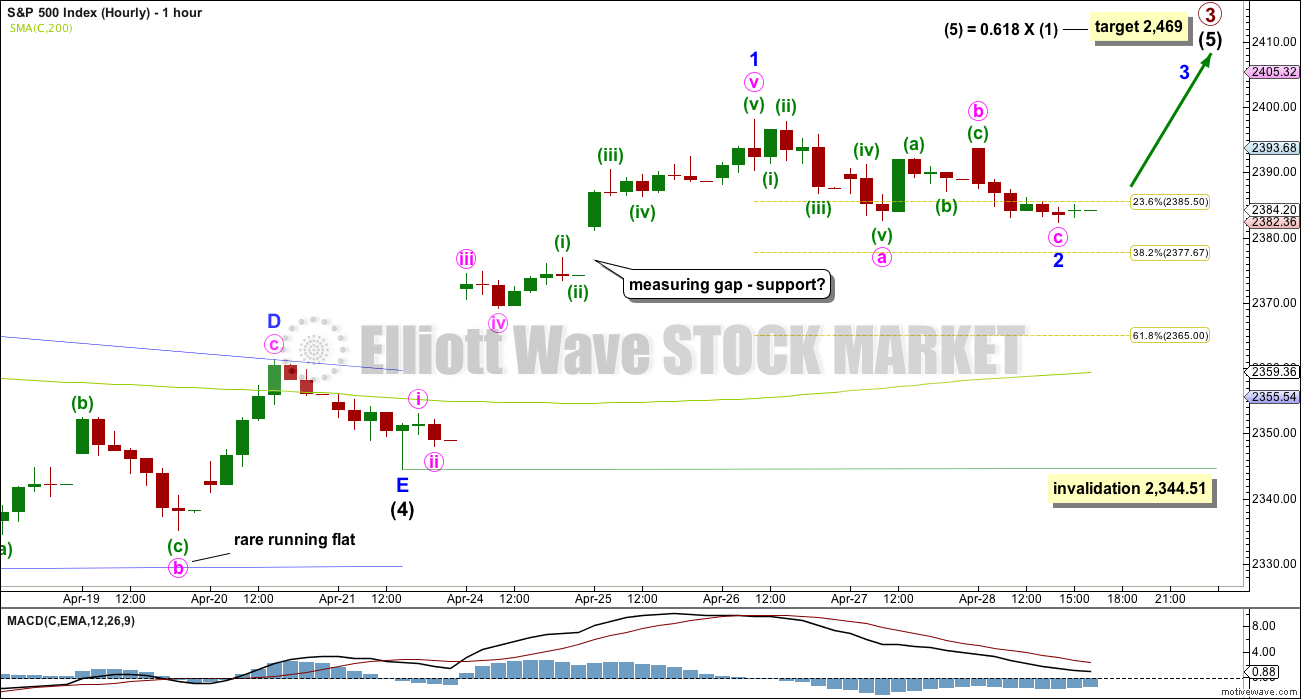
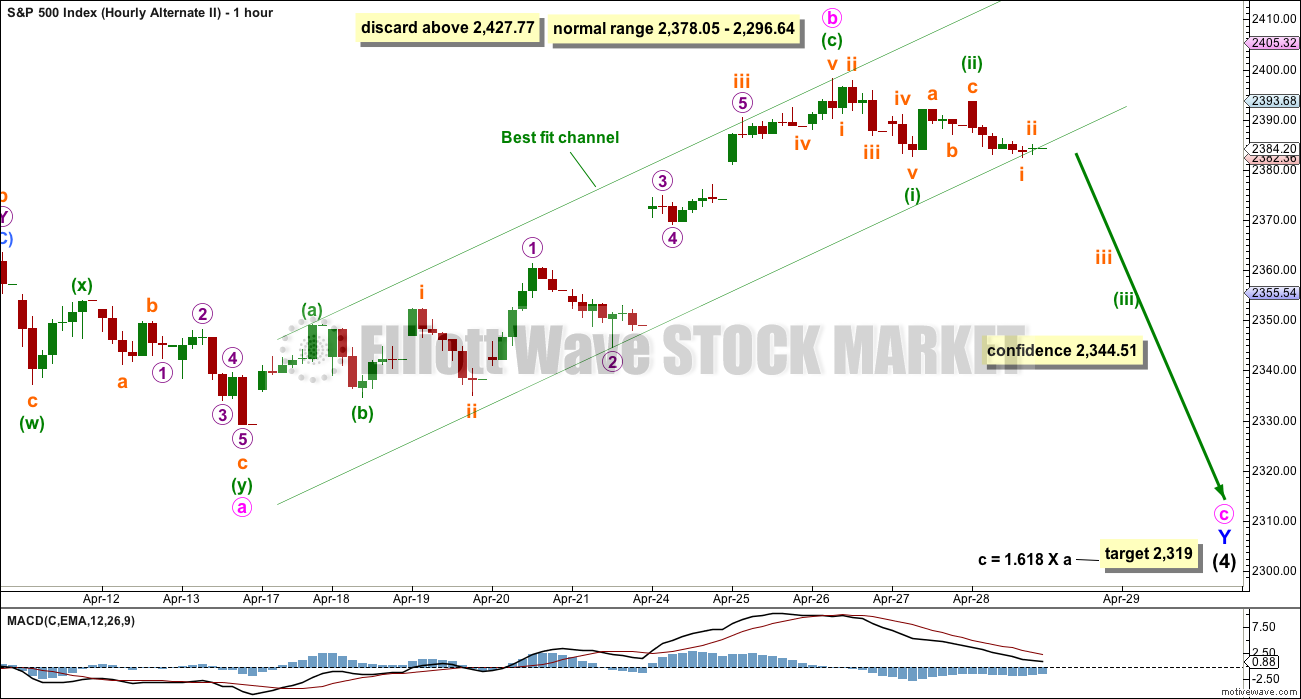
The triangle may have come to a surprisingly quick end. Triangles normally take their time, so this quick end does slightly reduce the probability of this first wave count. The rare running flat within minor wave D also slightly reduces the probability. For these reasons an alternate is provided below.
If the triangle is over, then the next wave up has begun. A five up may be complete. A three down for minor wave 2 may have continued mostly sideways during Fridays session.
If the last gap is correctly named as a measuring gap, then it may not be filled; the lower edge may provide support. If this is the case, then minor wave 2 may be a relatively shallow correction, which may now be over. Within a new trend for this market, the early second wave corrections are often surprisingly brief and shallow.
If price closes the gap, then use the 0.618 Fibonacci ratio as the next target for minor wave 2.
Minor wave 2 may not move beyond the start of minor wave 1 below 2,344.51.
If price does make a new low below 2,344.51, then the alternate below shall be used.
ALTERNATE DAILY CHART
Click chart to enlarge.
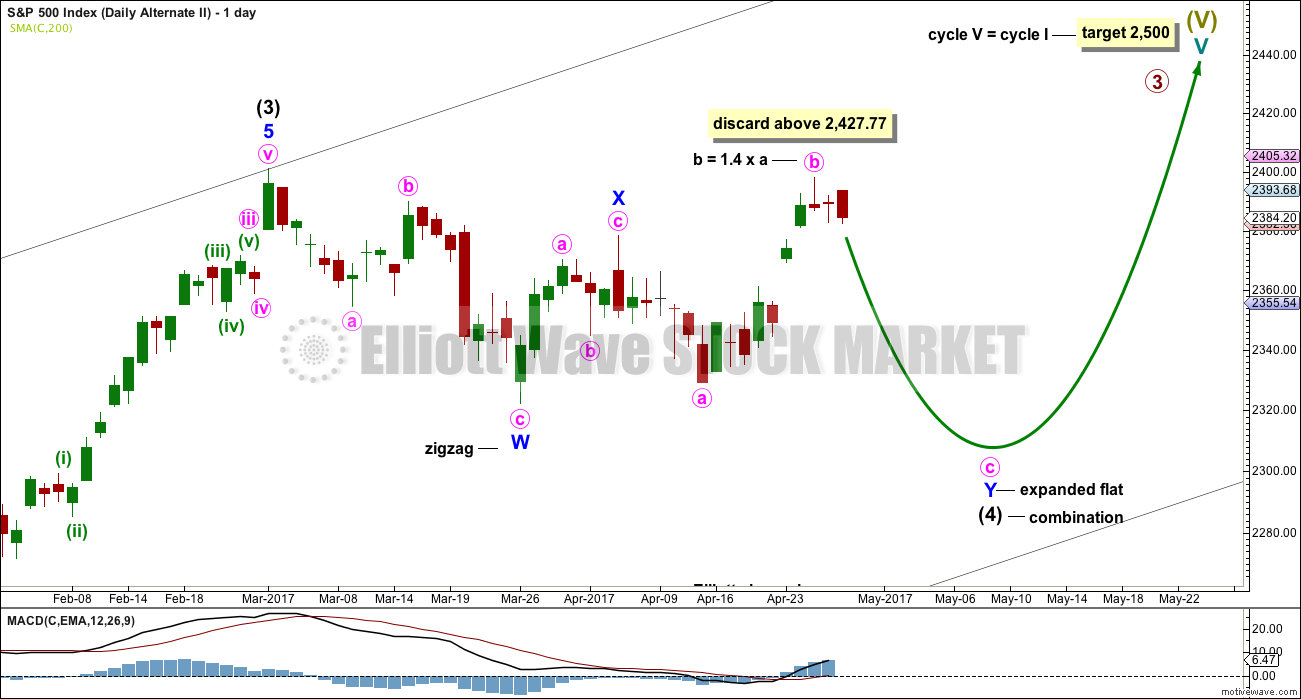
What if intermediate wave (4) was not a complete triangle but is still unfolding as a double combination?
Double combinations are very common structures. This would still provide perfect alternation in structure with the double zigzag of intermediate wave (2). Although double zigzags and double combinations are both labelled W-X-Y, they are very different structures and belong to different groups of corrections.
The purpose of combinations is the same as triangles, to take up time and move price sideways. Intermediate wave (2) lasted 58 days. So far intermediate wave (4) has lasted 38 days. If it continues for another two or three weeks, it would still have excellent proportion with intermediate wave (2).
Although this wave count actually has a better look than the main wave count, it does not have support from classic technical analysis. For this reason it will be published as an alternate with a lower probability.
ALTERNATE HOURLY CHART
Click chart to enlarge.
The problem of the running flat seen on the main hourly chart is here resolved.
The second structure of the combination may be an expanded flat labelled minor wave Y. There is no rule regarding the maximum length of B waves within flats, but there is an Elliott wave convention that states when the potential B wave reaches twice the length of the A wave the idea of a flat should be discarded based upon a very low probability. That price point would be at 2,427.77.
The most common Fibonacci ratio is used to calculate a target for minute wave c. If minute wave b moves higher, then this target must be moved correspondingly higher.
A best fit channel is used to contain minute wave b. If this channel is breached by downwards movement, it would be indicating that minute wave b is over and minute wave c is then underway.
Downwards movement within Thursday’s session fits better as a three than it does as a five. That structure offers more support for the main wave count than this alternate.
TECHNICAL ANALYSIS
WEEKLY CHART
Click chart to enlarge. Chart courtesy of StockCharts.com.
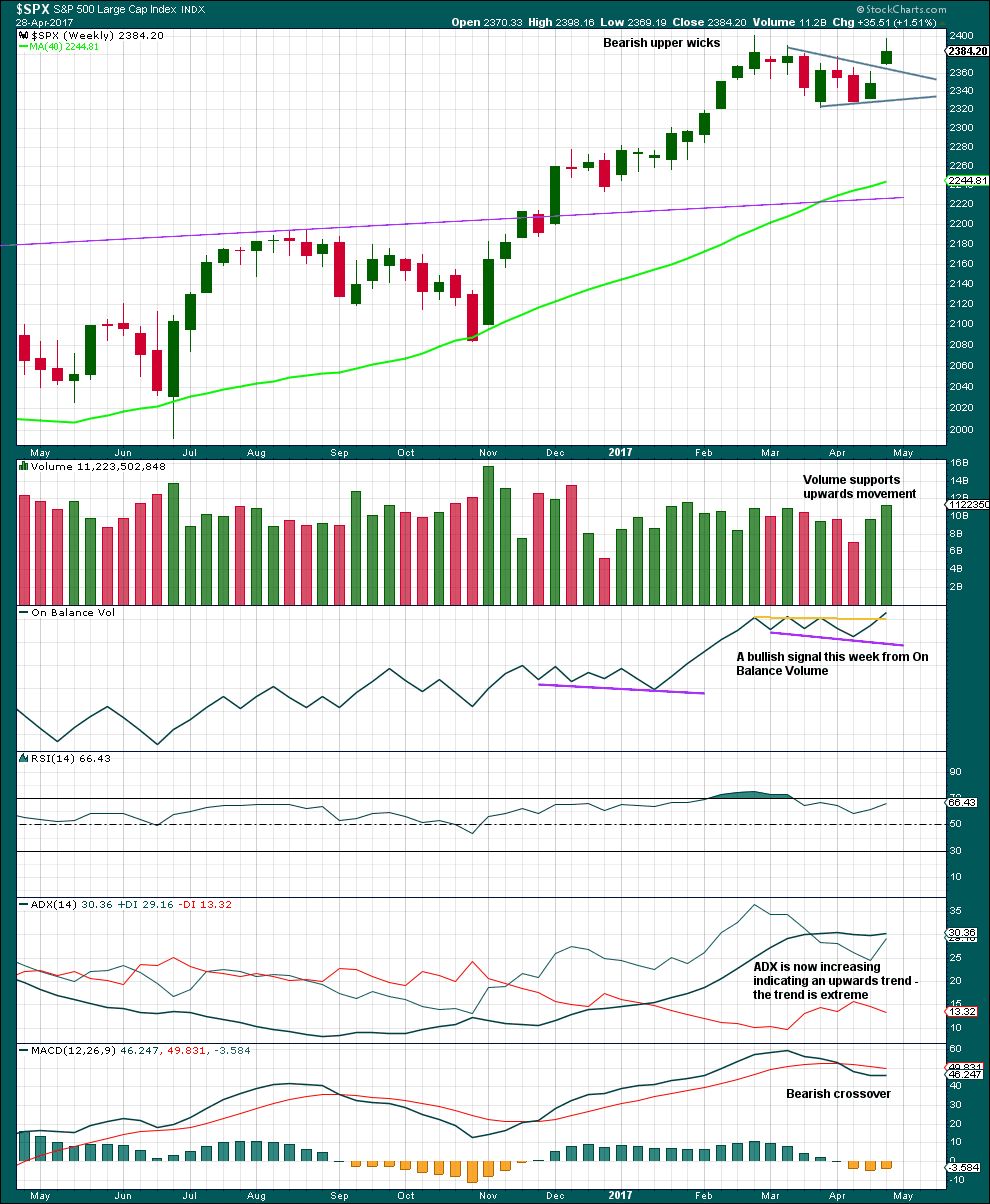
This chart is bullish and strongly supports the main wave count. However, it is concerning that ADX is extreme. This does not mean price must turn down here; it only puts some doubt on how much further price can go up.
DAILY CHART
Click chart to enlarge. Chart courtesy of StockCharts.com.
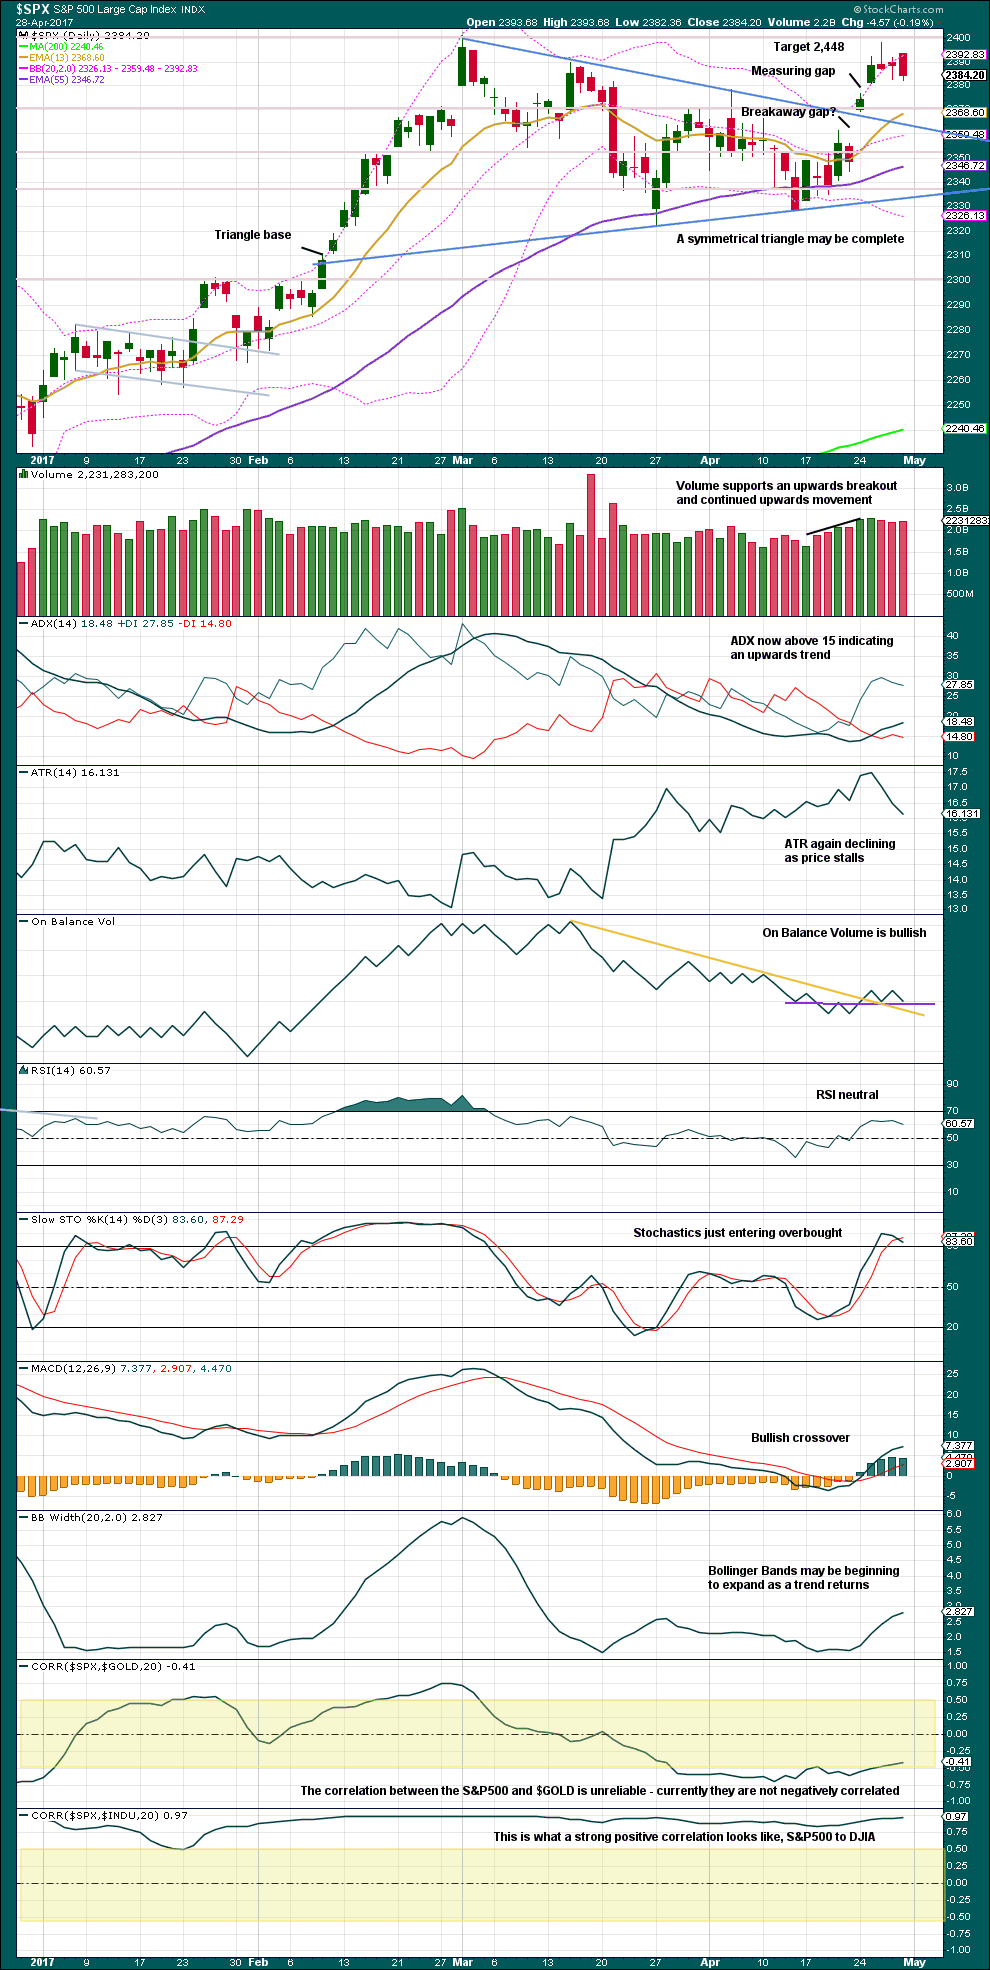
So far the last gap labelled a measuring gap is holding support. Assume this gap is a measuring gap while it remains open, until proven otherwise.
The target remains the same.
This chart remains bullish. Support for price and support for On Balance Volume may halt the fall in price here. Next week looks most likely to be upwards.
VOLATILITY – INVERTED VIX CHART
Click chart to enlarge. Chart courtesy of StockCharts.com.
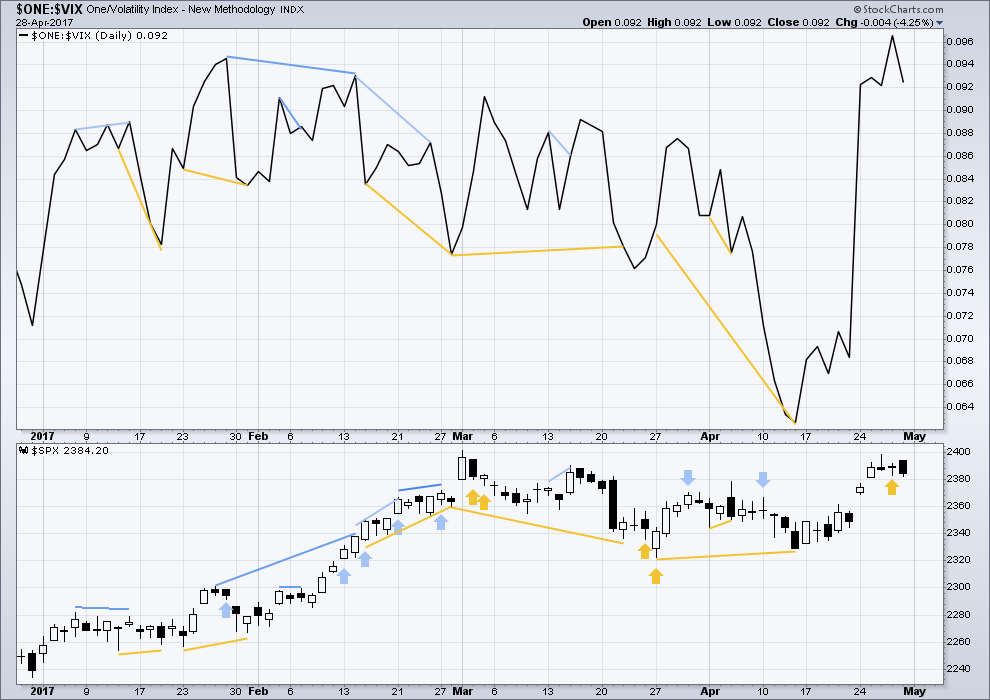
Normally, volatility should decline as price moves higher and increase as price moves lower. This means that normally inverted VIX should move in the same direction as price.
It is noted that there are now six multi day instances of bullish divergence between price and inverted VIX, and all have been followed so far by at least one upwards day if not more. This signal seems to again be working more often than not. It will again be given some weight in analysis.
Single day divergence with price and VIX yesterday has been followed by an outside day. This divergence is considered to have again failed. It should not be given weight.
BREADTH – AD LINE
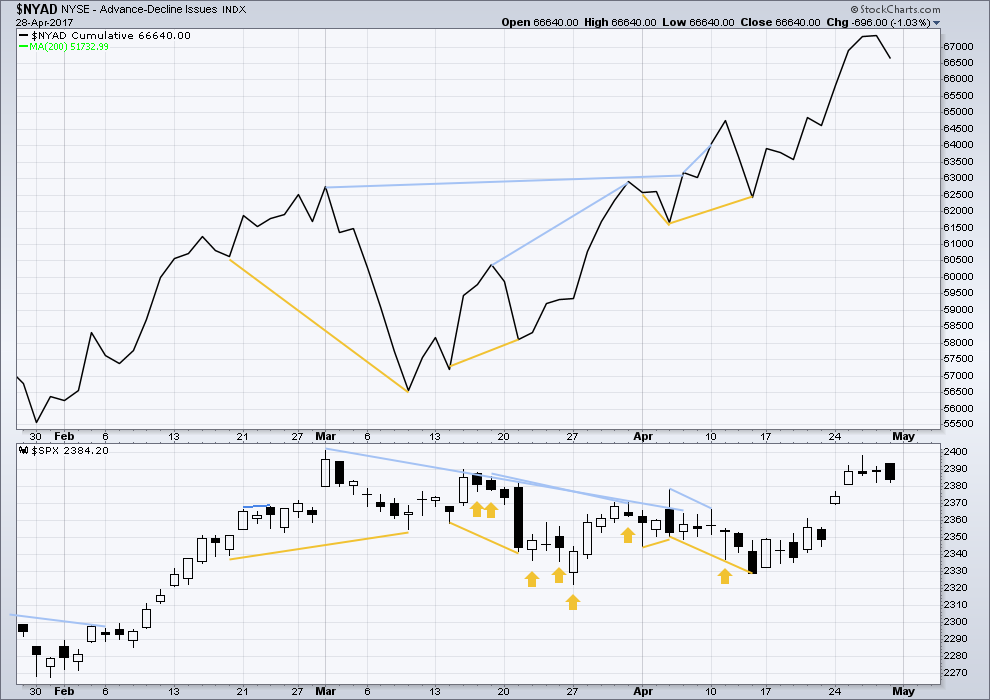
Click chart to enlarge. Chart courtesy of StockCharts.com.
The rise in price has support from a rise in market breadth. Lowry’s measures of market breadth do not at this stage warn of an impending end to this bull market. They show an internally healthy bull market that should continue for at least 4-6 months.
No new divergence is noted today between price and the AD line. There is still longer term bearish divergence, but this has not proven reliable lately, so it will not be considered.
DOW THEORY
The DJIA, DJT, S&P500 and Nasdaq continue to make new all time highs. This confirms a bull market continues.
The following lows need to be exceeded for Dow Theory to confirm the end of the bull market and a change to a bear market:
DJIA: 17,883.56.
DJT: 7,029.41.
S&P500: 2,083.79.
Nasdaq: 5,034.41.
Charts showing each prior major swing low used for Dow Theory are here.
This analysis is published @ 11:45 p.m. EST on 29th April, 2017.
If there was any doubt about the complete decoupling of VIX from a gauge of market risk there you have it – single digits! I am now starting to wonder if it even actually still represents the SPX put/call ratio.
Just on principle, I picked up 50 May 17 11.50 strike calls for 0.80
I am quite sure it will promptly go to 8.50 and stop me out…lol!
I agree, Verne. I’ve been closely watching XIV/VXX lately.
Would love to trade them for their high volume and “oomph” factor, but can’t quite make myself believe in their price moves enough to take serious trades right now.
Maybe they can be of some use to us as leading indicators of actual market movements to follow a day or two later — at least for a while…
I hear ya. Those ETFs are useless as any kind of indicator of probable market direction. I am also starting to wonder to what degree they are even an accurate measure of market sentiment. The kind of divergence we are seeing is suggesting to me derivatives running amuck….
If we are to believe VIX is truly us telling anything about the SPX put/call ratio, sentiment is now more bullish than at market highs we saw earlier this year. I suppose it is entirely possible, and if that is indeed the case we could see a new ATH…but something just does not quite add up. Funny how it seems I have been saying that for quite awhile! 🙂
Attached chart of SPY Vs VIX. Please see the performance in 2006 – 2007. Bottom in VIX does not mean Top in Market. VIX has decoupled from the market as the market was overbought and kept going higher.
That is a very interesting chart and I think confirms the disconnect. It is interesting that the divergence back then saw VIX already on the move higher prior to the market top. Volatility did something the exact opposite at the last ATH as SVXY continued to plow higher for serveral WEEKS after the market had topped! The markets topped on May 1 yet SVXY continued higher from 128.75 on March 01 to 148.89 on March 21. It went on to make triple tops at around 145 on March 29 and again on April 5. We are again today seeing the same kind of divergence with a new ATH high in SVXY with no corresponding market highs. These VIX derivatives no longer have any correlation to market price action. Volatility instruments and the Yen are being shorted to buy the market in a pairs trade regardless of what the market is doing. This is the kind of thing I would have expected for a second wave after a final top was in when it is not unusual to see mania that exceeds the actual top. Considering that we are still expecting new all time highs, we are certainly in uncharted territory.
The unwind should be interesting.
BTW, (I know most of you know this) SVXY is an inverse VIX ETF so its going higher meant that volatility was falling at the same time as the market, consistent with traders and bots shorting vol under ALL market conditions. Incredible!
I think we need one more push up to complete the possible B wave.
Today’s action clearly some kind of consolidation. Let’s see what tomorrow brings!
I agree Peter and Verne. This could still be primary 4 continuing sideways.
For now, I’ll label it intermediate (4). Mostly to keep the number of charts manageable. And because it makes no difference at this stage to direction or structure.
Almost no change to the wave count nor analysis today with a tiny upwards day. That small movement sees the situation the same. Let’s see what volume and On Balance Volume will have to say…
Every time I think I have seen this market hit an extreme as anomalous as it could possibly get, it does one better. Yet another divergent high in SVXY today. I guess I will just continue to short it around the 145.00. level The algos are relentlessly shorting volatility regardless of price action. I have never seen anything quite like this. Remarkable! A possible C wave down should take it below its recent low of 120.33 for yet another 10 bagger. I guess we should thank the bots for these unusual opportunities.
I’m thinking the alternate is starting to look stronger.
On June E-Mini futures wave b of the expanded flat is nearly exactly 1.382 times the length of wave a.
Plus the overall form looks more like 3 down from Mar 1 high, and 3 up into last weeks high
It is indeed. We should see an impulsive five down to conclude this meandering correction. Just in time for “Sell in May”. Time to get ready for a blow off final wave up…
Agreed. But I am starting to think that we are actually in Primary 4, rather than Intermediate 4 of Primary 3. We will see soon enough, but this sideways movement for the last 2 months is getting a bit long for an Intermediate degree wave.
Again I agree. Another wave down would lend strong credence to that idea as the wave proportion would be much better. Timing for a Fall top would be ideal.
well ,, look whos first again
Way to go doc. You doctors work 24/7.