
Upwards movement was expected for the short term. Price remains just below the invalidation area for the Elliott wave count.
Summary: The Elliott wave count expects this potential breakout is false, that price will move lower for at least a few days in choppy overlapping movement back within the prior consolidation zone. Classic analysis today does not support this view, an upwards breakout from a symmetrical triangle may have occurred today. If the classic view is correct, then price should tell us early tomorrow with movement reasonably above 2,378.36. If the Elliott wave count is correct, then price should reverse tomorrow.
New updates to this analysis are in bold.
Last monthly and weekly charts are here. Last historic analysis video is here.
MAIN ELLIOTT WAVE COUNT
WEEKLY CHART
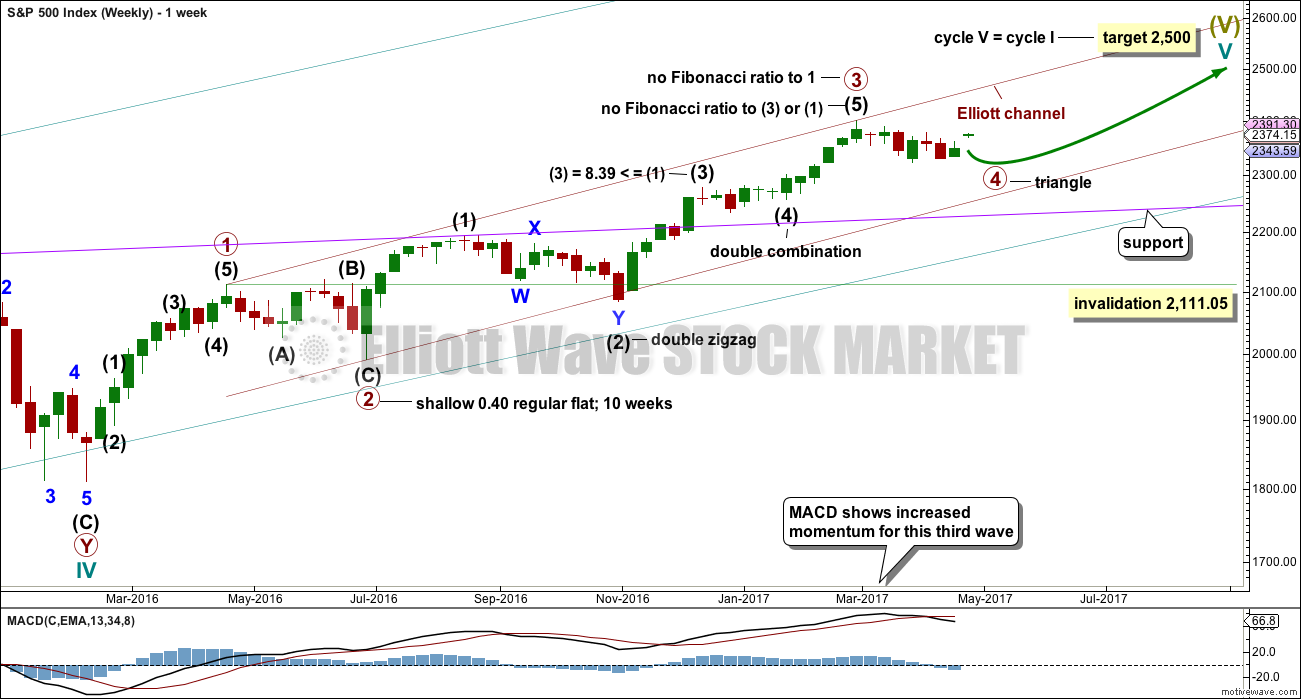
Click chart to enlarge.
It is possible that primary wave 3 may be over.
Primary wave 4 may continue.
Primary wave 2 was a flat correction. Primary wave 4 may be exhibiting alternation as a triangle.
Primary wave 2 lasted 47 days (not a Fibonacci number). So far primary wave 4 is incomplete. If it exhibits a Fibonacci duration, it may end in another 18 days to total a Fibonacci 55. However, at this stage that looks to be too long. It may end more quickly and not exhibit a Fibonacci duration.
Primary wave 4 may not move into primary wave 1 price territory below 2,111.05.
DAILY CHART
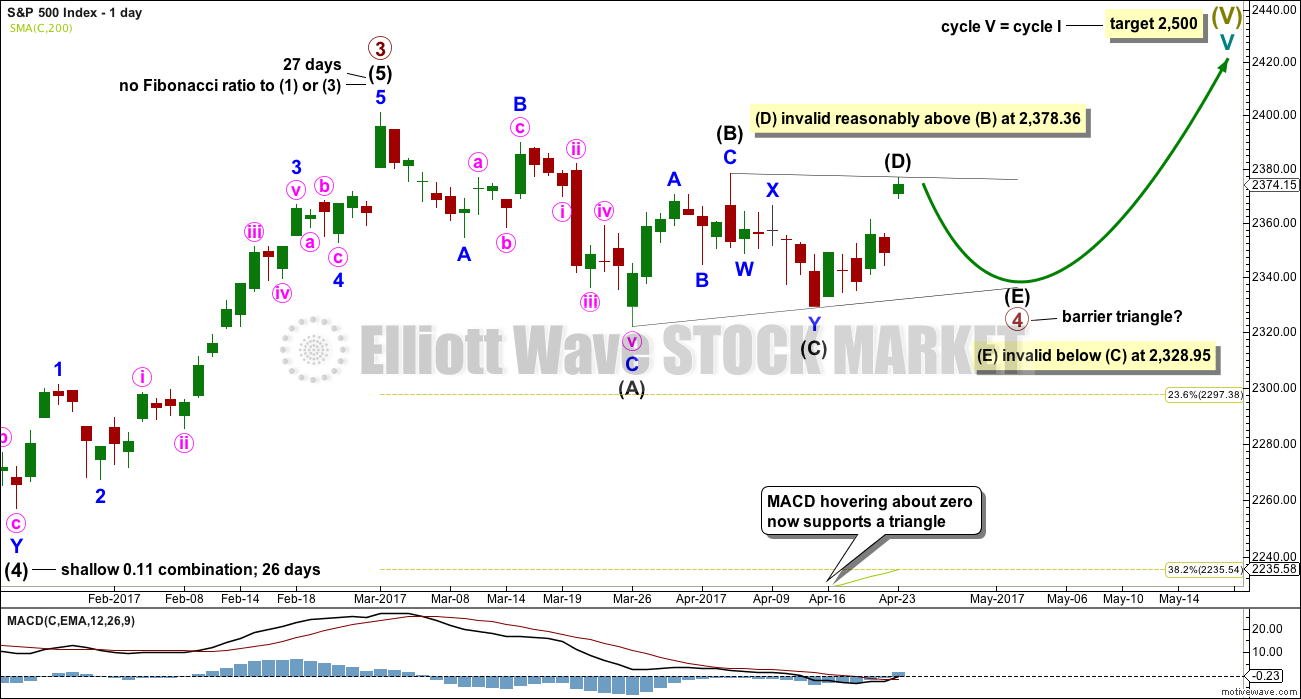
Click chart to enlarge.
This wave count looks at the possibility that a large barrier triangle may be completing for a fourth wave.
This idea is now supported by MACD hovering about the zero line as the triangle unfolds.
There would still be adequate alternation between the shallow 0.40 expanded flat of primary wave 2 and the more shallow triangle.
Primary wave 2 lasted 47 days. Triangles are some of the longest lasting corrective structures. So far this one may have lasted 37 days. It may end in a total Fibonacci 55 days.
A barrier triangle may have intermediate wave (D) end about the same level as intermediate wave (B) at 2,378.36; as long as the (B)-(D) trend line remains essentially flat the triangle would remain valid. In practice, this means that intermediate wave (D) can move a little above 2,378.36. This is the only Elliott wave rule which is not black and white.
If price moves far enough above 2,378.36 tomorrow, so that the (B)-(D) trend line no longer looks “essentially flat” on the hourly and daily charts, then my labelling of primary wave 4 may be wrong; it may be already over. If the triangle is invalidated tomorrow, then assume the upwards trend has resumed and that primary wave 5 may be underway.
For barrier triangles, intermediate wave (E) may not move beyond the end of intermediate wave (C) below 2,327.58.*edit: 2,328.95.
HOURLY CHART
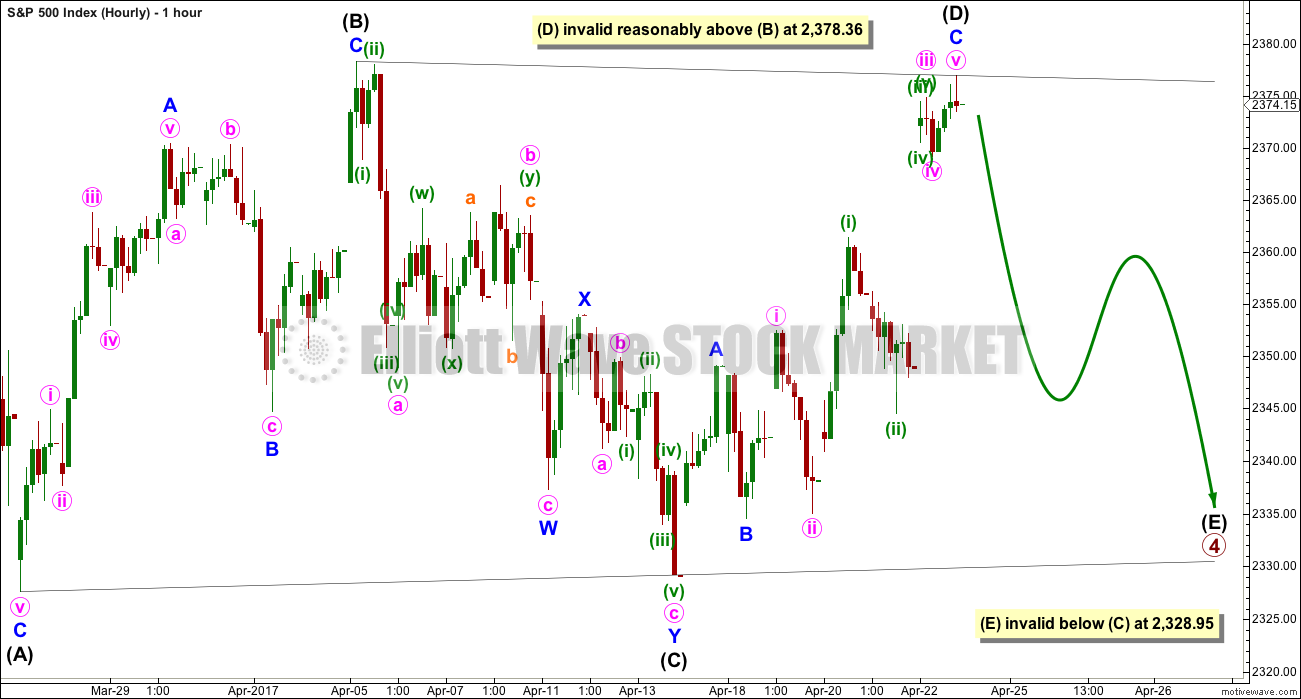
Click chart to enlarge.
Only one of a triangle’s five subwaves may subdivide as a more complicated multiple. So far this may be intermediate wave (C).
Intermediate wave (D) may be a complete zigzag. A final zigzag down for intermediate wave (E) may unfold. This would be most likely to end short of the (A)-(C) trend line. If it doesn’t end there, then it may slightly overshoot the trend line.
Intermediate wave (E) should last at least a few days to possibly over a week.
The purpose of triangles is to take up time, move price sideways, and test our patience. They do the latter extremely well.
If this structure unfolds as expected, then we shall have a good entry at the end of the triangle to join the larger upwards trend for a fifth wave up to 2,500. More experienced traders may try to trade the subwaves of the triangle, but this does involve a greater level of risk. Trading a consolidation using a reversion to the mean approach or a swing system from support to resistance and back again necessarily involves more risk than trading a trending market.
ALTERNATE WEEKLY CHART
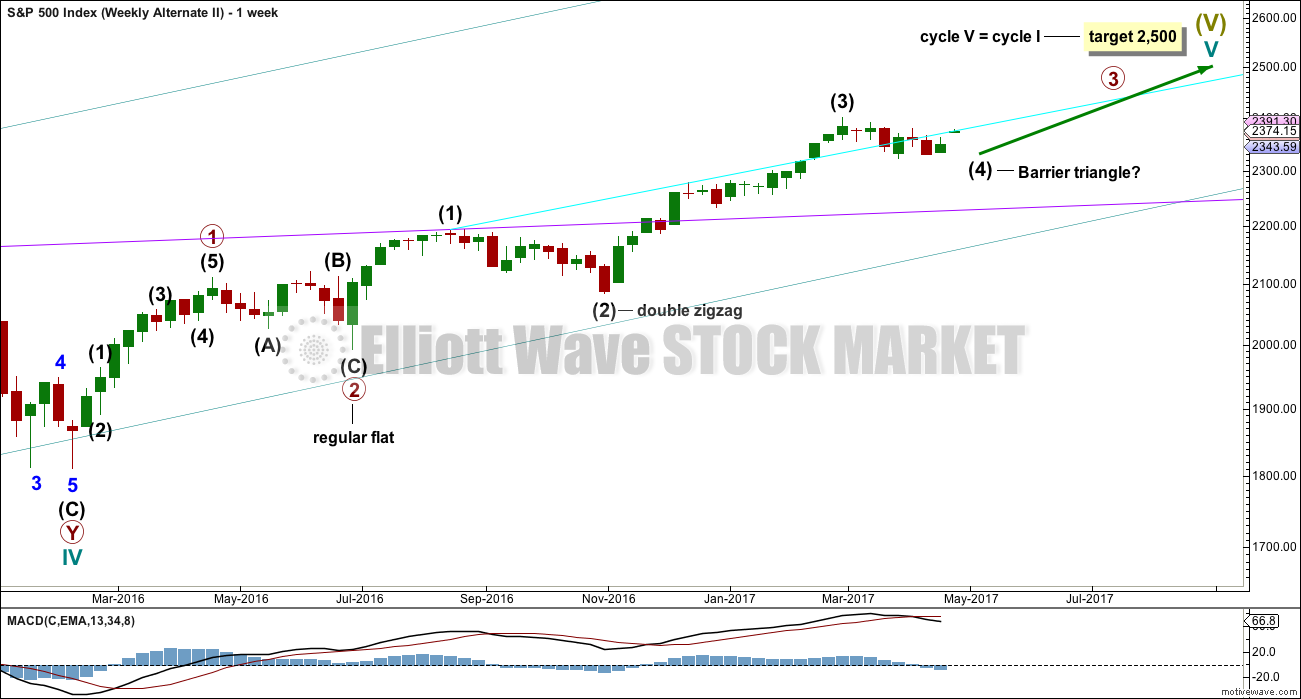
Click chart to enlarge.
This wave count is identical to the main wave count up to the low labelled intermediate wave (2). Thereafter, the upwards wave here labelled intermediate wave (3) is seen differently.
It is possible that only intermediate wave (3) is over, that primary wave 3 is incomplete.
The triangle may be moved down one degree; it may be only intermediate wave (4).
If this wave count is right, then after the current correction is over another large correction should unfold along the way up to the final target. This target would assume both intermediate wave (5) and primary wave 5 are short and possibly also brief.
TECHNICAL ANALYSIS
WEEKLY CHART
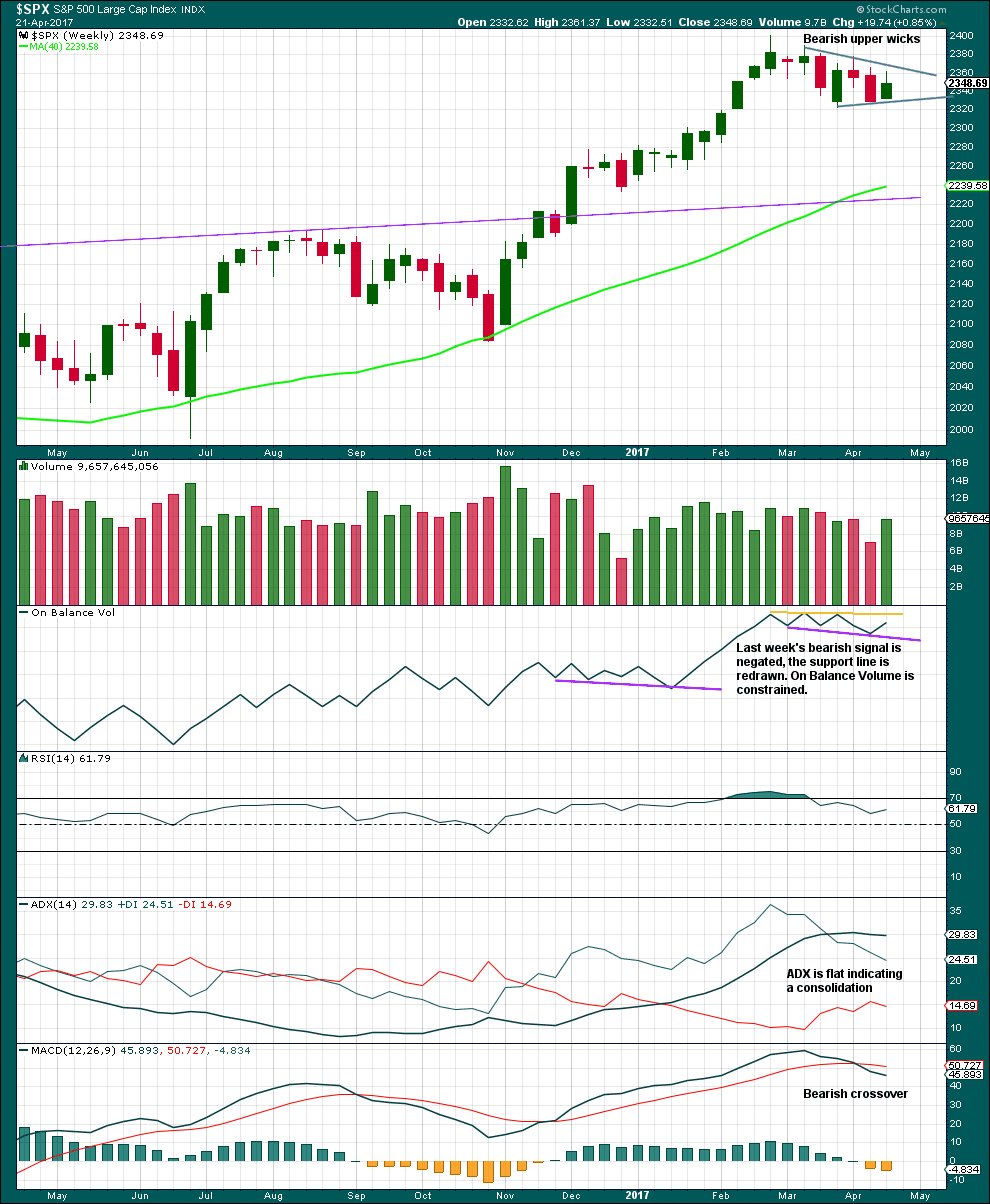
Click chart to enlarge. Chart courtesy of StockCharts.com.
An upwards week has stronger volume, but the bearish wicks of the last two candlesticks indicate more downwards movement.
On Balance Volume is constrained between support and resistance.
ADX indicates a consolidation. This supports the triangle.
RSI is neutral and MACD is bearish.
DAILY CHART
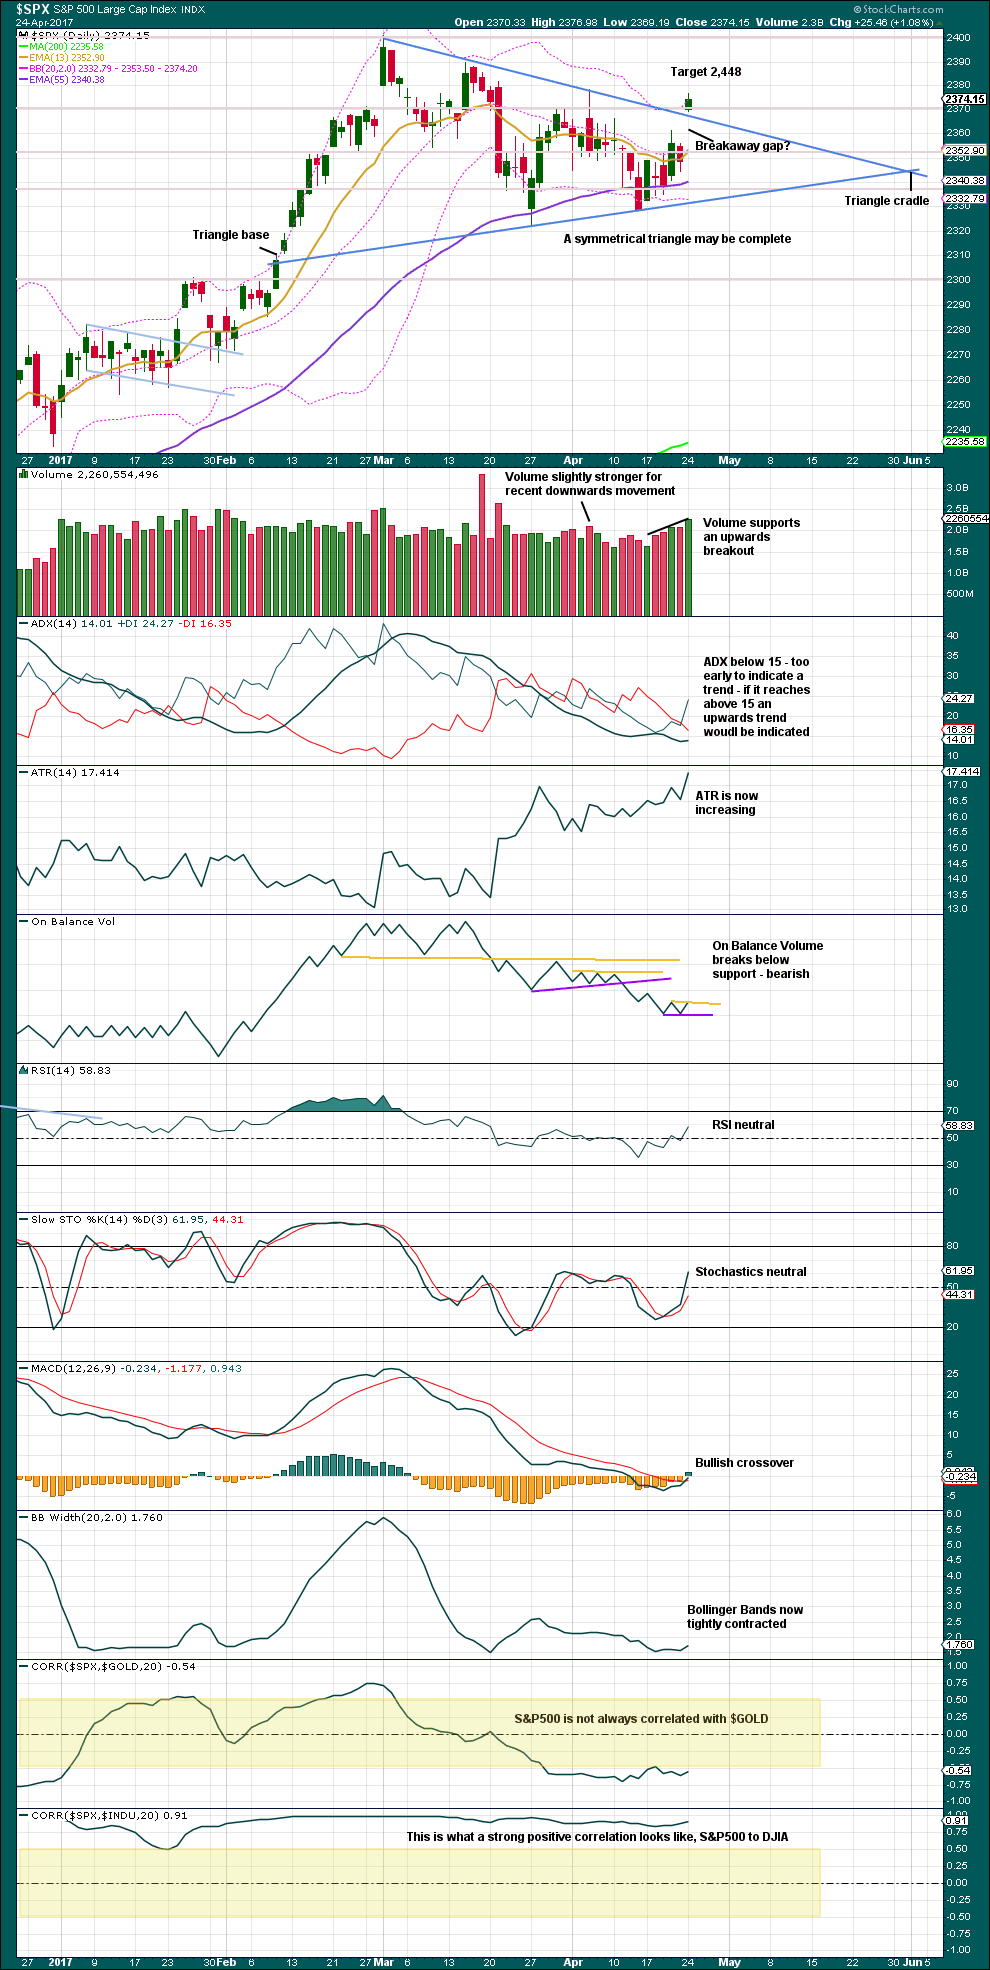
Click chart to enlarge. Chart courtesy of StockCharts.com.
It looks like today may have been a breakout from the symmetrical triangle pattern. This session closed above the upper trend line on a day with some increase in volume.
But Kirkpatrick and Dhalquist warn that “symmetrical triangles have many false breakouts and must be watched carefully”.
This possible breakout looks to have come about 64% of the distance from base to cradle. Highest percentage performance following triangle breakouts come from breakouts generally around 60%-70% of this distance.
The increase in ATR today may also offer some support to this possible breakout. MACD also offers bullish support, but ADX and On Balance Volume do not.
The target is calculated from adding the vertical difference between the initial upper and lower triangle reversal points (78.73 points) to the breakout point, taken at today’s low.
Throwbacks to support after an upwards breakout from a symmetrical triangle occur only 37% of the time, so this price point may offer a good entry point to join the upwards trend if this breakout is true. If it is true, then the breakaway gap should not be filled. Stops for long positions may be set a little below the upper trend line. Keep stops tight in case the breakout is false.
Always use a stop. Do not invest more than 1-5% of equity on any one trade.
VOLATILITY – INVERTED VIX CHART
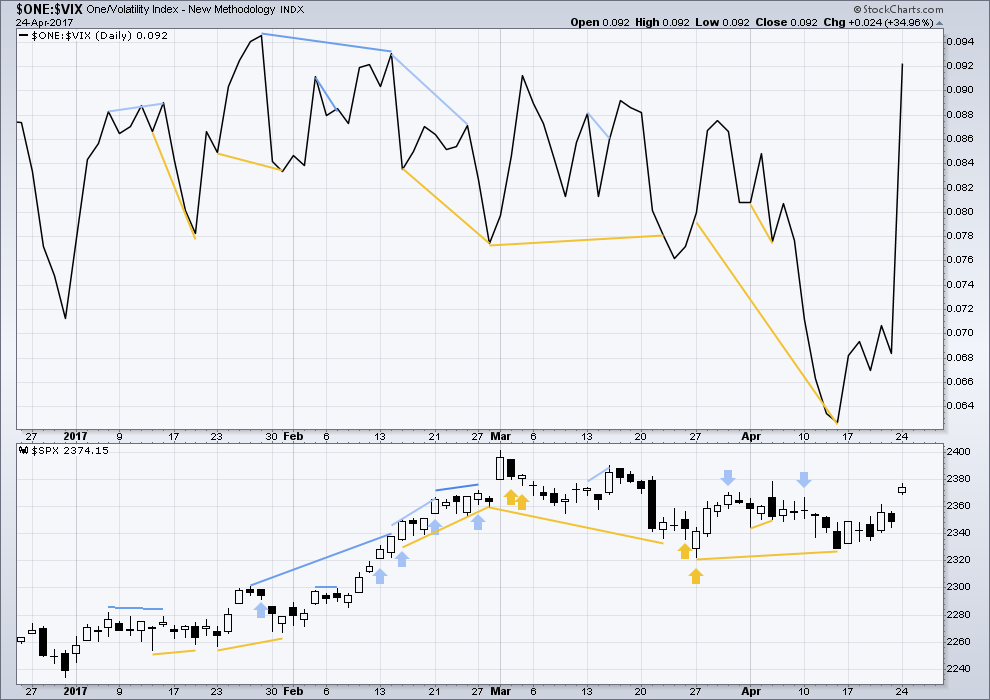
Click chart to enlarge. Chart courtesy of StockCharts.com.
Normally, volatility should decline as price moves higher and increase as price moves lower. This means that normally inverted VIX should move in the same direction as price.
It is noted that there are now six multi day instances of bullish divergence between price and inverted VIX, and all have been followed so far by at least one upwards day if not more. This signal seems to again be working more often than not. It will again be given some weight in analysis.
There is no new short nor mid term divergence today noted between price and VIX. There is longer term divergence, but this has not proven to be reliable enough to consider.
BREADTH – AD LINE
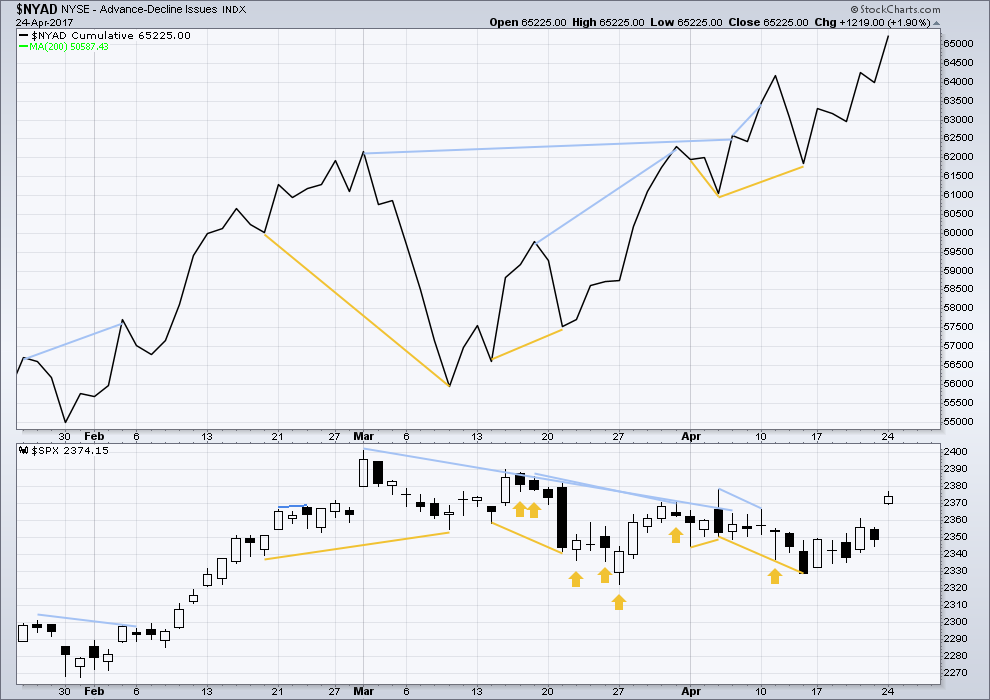
Click chart to enlarge. Chart courtesy of StockCharts.com.
The rise in price has support from a rise in market breadth. Lowry’s measures of market breadth do not at this stage warn of an impending end to this bull market. They show an internally healthy bull market that should continue for at least 4-6 months.
No new divergence is noted today between price and the AD line. There is longer term bearish divergence, but this has not proven reliable lately, so it will not be considered.
DOW THEORY
The DJIA, DJT, S&P500 and Nasdaq continue to make new all time highs. This confirms a bull market continues.
The following lows need to be exceeded for Dow Theory to confirm the end of the bull market and a change to a bear market:
DJIA: 17,883.56.
DJT: 7,029.41.
S&P500: 2,083.79.
Nasdaq: 5,034.41.
Charts showing each prior major swing low used for Dow Theory are here.
This analysis is published @ 11:22 p.m. EST.
Wow. Normally you have to be patient with triangles as they end. This one came to a very swift conclusion.
I’ve tried to see another structure complete for the fourth wave but only a triangle will fit.
I’m going to swap my wave count over with the alternate, I think Peter is right and this wave was intermediate (4). Primary 4 will be the alternate. Haven’t done that yet on the hour chart so you’ll have to use your imaginations there 🙂
Absolutely amazing! Price did not even descend in the usual and customary kiss good-bye of the top line of the triangle! New highs ahoy!
Have a great evening all!
I think I read somewhere that E waves of triangles are the only ones that EW formally recognizes as being associated with an event, in the above case its brevity being attributed to the French election outcome. We saw something similar with the Euro recently but I cannot remember if it was Brexit or the US election.
Taking the money and running as fast as my chubby little legs will allow on ES! 🙂
Mercy, mercy me! The entire cosmos is BULLISH! 🙂
Every roll banged up, every VIX green print slammed down. Don’t they know the market is already up…..???WTF
I know it does not fit the wave count but boy this move sure looks and feel like a manic second wave…the plunge in volatility is also exactly what I would have expected….perhaps we are completing a short fifth wave ahead of a larger correction but even that would still require new highs.
I’m actually wondering if we are still in Intermediate 3 and have just finished Minor 4, with Minor 5 underway (going back to one of Lara’s older counts). I just don’t think the count that has this recent move sideways as Intermediate 4 has the right look.
When I was still getting Hochberg’s short term update from EWI he was calling this correction a minor four, but it was minor four of an intermediate five of a primary five. Unless we have entered a new paradigm of mean reversion abrogation, this thing does not have too much life left imho…
Not a bad idea. I was thinking along those lines for a while until you look back at the extent of this recent correction and comparing it to Minor 2, to me it looks far too big and out of proportion to be of the same degree.
Reply meant for Peter R’s comment
DJI up over 200 points and my long VIX trade in the green? Something wicked this way comes…be careful people. This is NOT normal…
Kookey dukes…..I’m selling Jun 160 SVXY in my PA and re-buying UVXY with proceeds, for what it’s worth. Sold my all time favorite company CAT just now. Had it since 2009 🙁
I am buying the May 140 SVXY puts outright. They are a bit rich but I think it will make a new low the next wave down. I suspect quite a few folk are chasing this pop. Glad I grabbed the ES contracts….
Defended short position with long ES 2375.00 trade. Holding both
I think the fourth wave is done and it was an intermediate wave.
I think you’re right. And I’m going to change my main wave count over to that.
So far ES remains constrained by strong resistance in the 2375 area. Futures up slightly. A possible C wave down beginning today should begin with an impulse down, or the possible break-out confirmed with a move above 2378.36 on solid volume.
VIX remarkably, once again trading below 11.00!
Looking at the possibility where,if not a triangle,then a W,X,Y for four where we could now be about to start c of Y down to finish four.
Or if it prolongs more, b of Y continues correcting before c starts
If you have (Y) beginning where I have (B) of the triangle it works.
But it needs B of the second zigzag to not move beyond the start of A above that point, 2,378.36.
A will fit on the hourly chart as a leading contracting diagonal, but it looks all wrong because it doesn’t fit within trend lines. Diagonals should fit within trend lines.
Ok ta. I can get converging lines for the leading diagonal but let’s see what happens.
On a different matter, I have the low on the 13th April as 2328.95 – an important price.
I’ve checked it from 2 different sources, both agreeing. Do I have an incorrect price?
I’m so sorry, that’s my mistake. And you’re right Peter, the low for the 13th of April is 2,328.95.
I’ll fix charts and text in the analysis.
The leading diagonal I refer to has converging trend lines, but the movement doesn’t fit within them. That’s the problem.
Good call Lara. I’ll need to brush up on my Diagonal Triangle rules
hey,, guess what