
Price continues to move sideways.
Summary: Only one wave count is left now, which expects sideways movement to continue for another 20 sessions. Thereafter, the upwards trend should resume towards the final target at 2,500.
New updates to this analysis are in bold.
Last monthly and weekly charts are here. Last historic analysis video is here.
MAIN ELLIOTT WAVE COUNT
WEEKLY CHART
Click chart to enlarge.
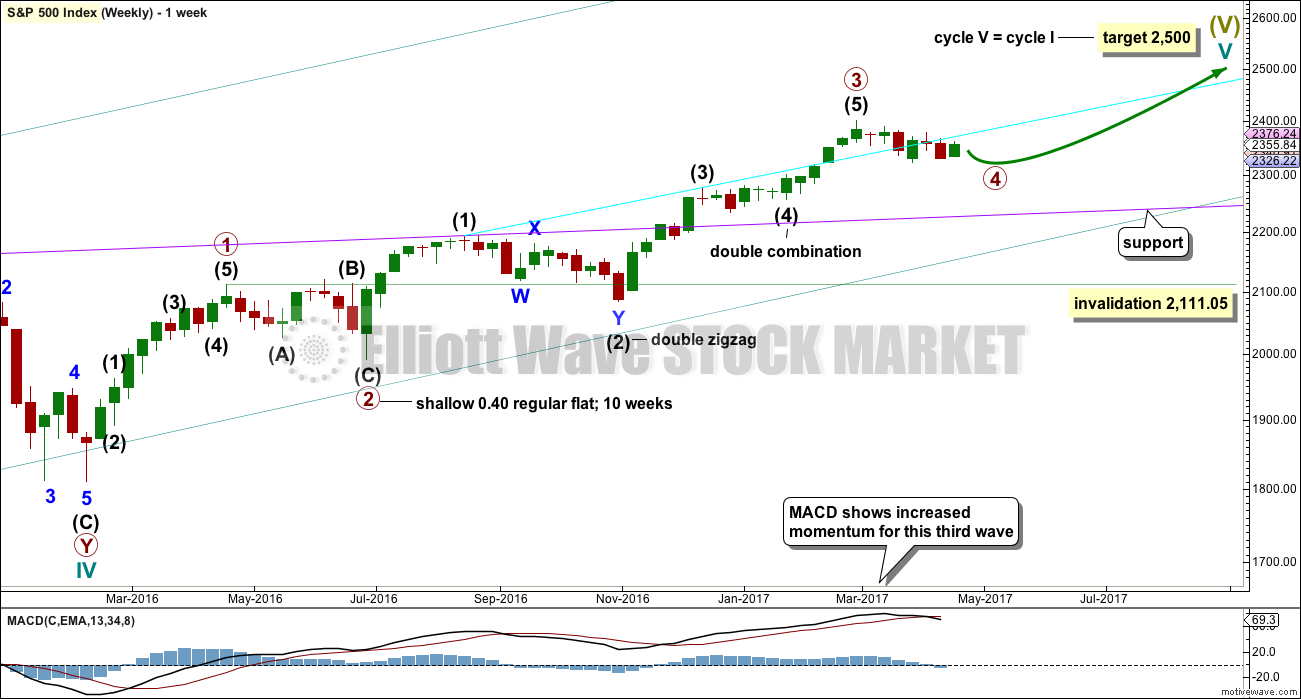
It is possible that primary wave 3 may be over.
There is another idea which sees only intermediate wave (3) within primary wave 3 complete (thank you to our new member Peter for emailing me his chart) and intermediate wave (4) now continuing.
At this stage, I will follow these ideas but publish only one, primary wave 4. If the alternate idea of intermediate wave (4) begins to diverge substantially in terms of direction expected, then it will be published.
Primary wave 4 may continue.
Primary wave 2 was a flat correction. Primary wave 4 may be exhibiting alternation as a triangle.
Primary wave 2 lasted 47 days (not a Fibonacci number). So far primary wave 4 is incomplete. If it exhibits a Fibonacci duration, it may end in another 20 days to total a Fibonacci 55.
Primary wave 4 may not move into primary wave 1 price territory below 2,111.05.
DAILY CHART
Click chart to enlarge.
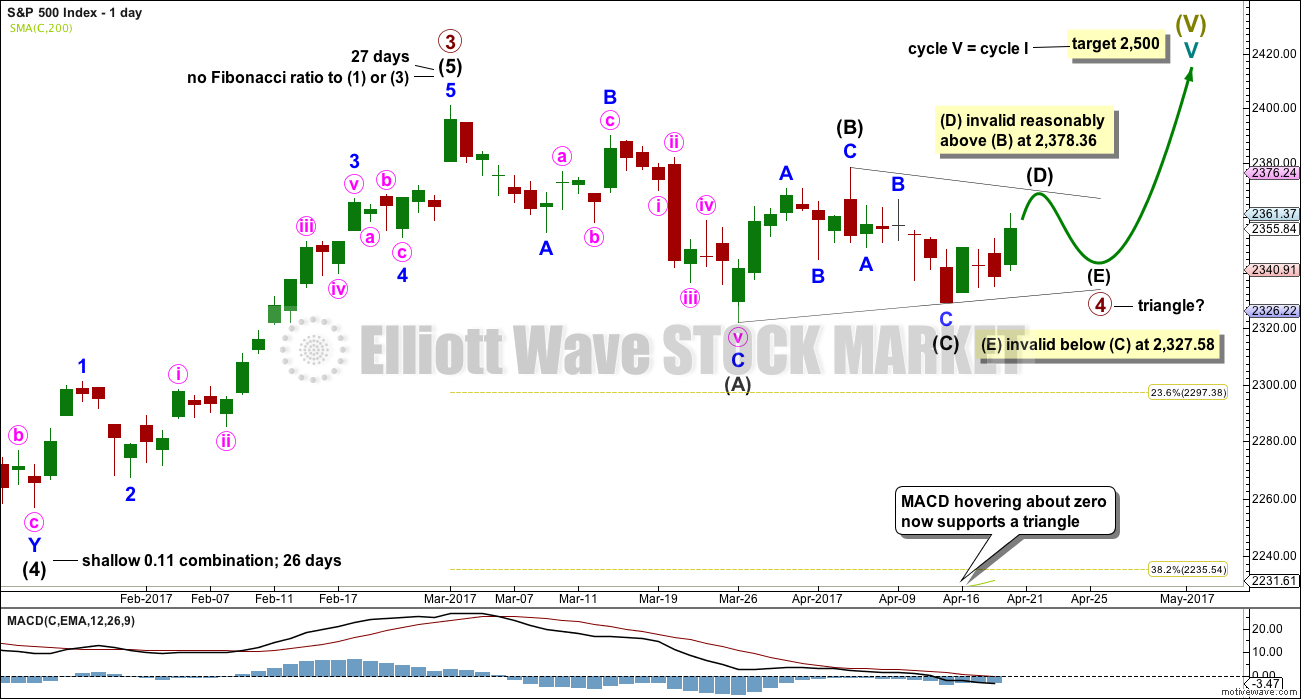
This wave count looks at the possibility that a large regular contracting triangle may be completing for a fourth wave. This may be primary wave 4, but it may also be intermediate wave (4) within primary wave 3. Both ideas would have subdivisions labelled the same way and both ideas would see the triangle incomplete.
This idea is now supported by MACD hovering about the zero line as the triangle unfolds.
There would still be adequate alternation between the shallow 0.40 expanded flat of primary wave 2 and the more shallow triangle.
Primary wave 2 lasted 47 days. Triangles are some of the longest lasting corrective structures. So far this one may have lasted 35 days. It may end in a total Fibonacci 55 days.
A contracting triangle may not have intermediate wave (D) move beyond the end of intermediate wave (B) at 2,378.36.
A barrier triangle may have intermediate wave (D) end about the same level as intermediate wave (B) at 2,378.36; as long as the (B)-(D) trend line remains essentially flat the triangle would remain valid. In practice, this means that intermediate wave (D) can move a little above 2,378.36. This is the only Elliott wave rule which is not black and white.
For both contracting and barrier triangles, intermediate wave (E) may not move beyond the end of intermediate wave (C) below 2,327.58.
HOURLY CHART
Click chart to enlarge.
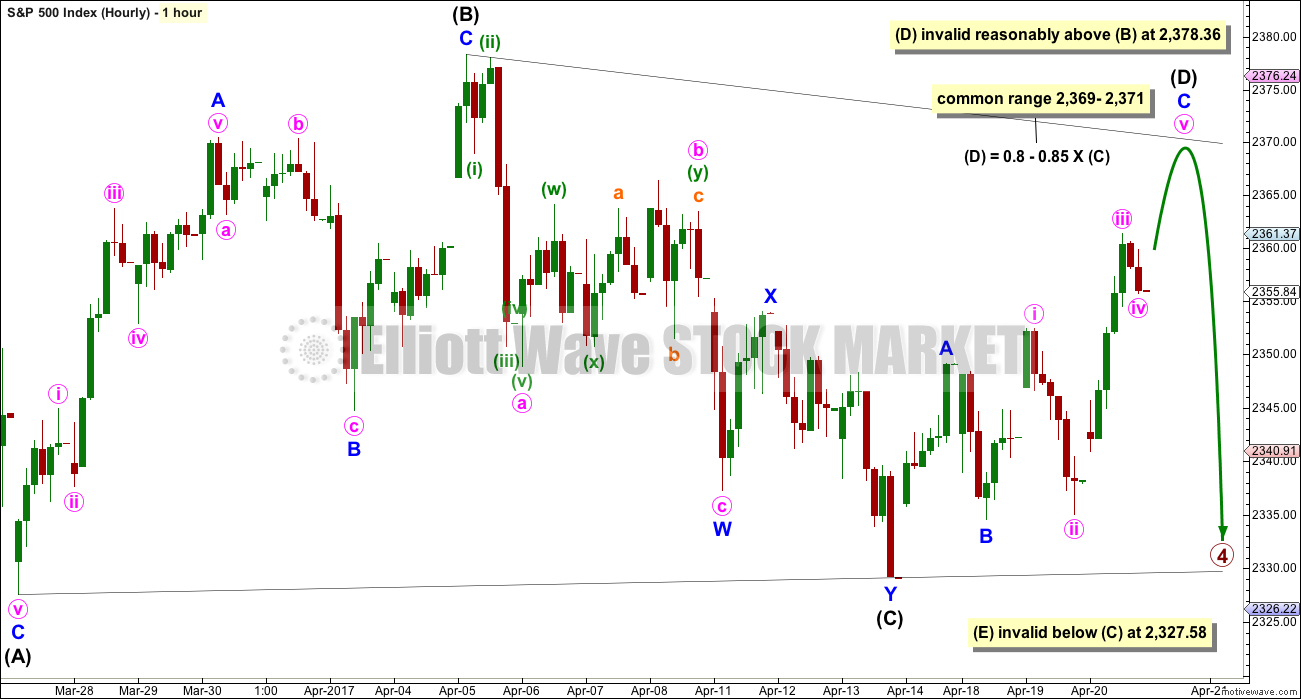
Only one of a triangle’s five subwaves may subdivide as a more complicated multiple. So far this may be intermediate wave (C).
Intermediate wave (D) may be an incomplete zigzag. The common range is based upon my experience over the years with triangles; they often exhibit subwaves which are about 0.8 to 0.85 the length of the prior wave.
When intermediate wave (D) is over, then a final zigzag down for intermediate wave (E) may unfold. This would be most likely to end short of the (A)-(C) trend line. If it doesn’t end there, then it may slightly overshoot the trend line.
This chart is somewhat squashed up; it does not show that the triangle is expected to continue for another few weeks.
The purpose of triangles is to take up time, move price sideways, and test our patience. They do the latter extremely well.
If this structure unfolds as expected, then we shall have a good entry at the end of the triangle to join the larger upwards trend for a fifth wave up to 2,500. More experienced traders may try to trade the subwaves of the triangle, but this does involve a greater level of risk. Trading a consolidation using a reversion to the mean approach or a swing system from support to resistance and back again necessarily involves more risk than trading a trending market.
TECHNICAL ANALYSIS
WEEKLY CHART
Click chart to enlarge. Chart courtesy of StockCharts.com.
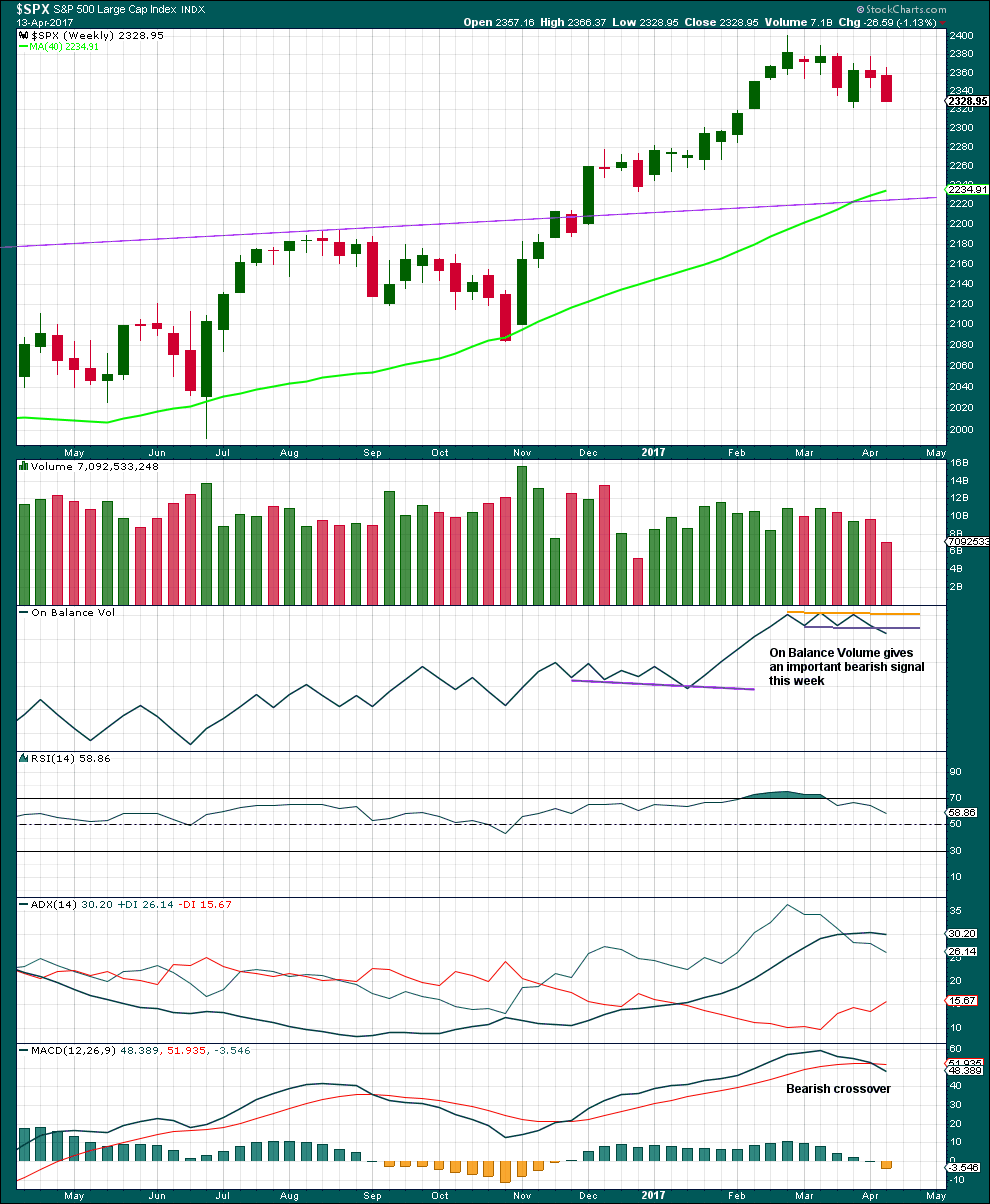
Although a strong downwards week has lighter volume, because last week was a short week this should not be read as bullish.
The signal from On Balance Volume should be given weight; it supports the main Elliott wave count. In conjunction with MACD, this is overall a fairly bearish weekly chart.
DAILY CHART
Click chart to enlarge. Chart courtesy of StockCharts.com.
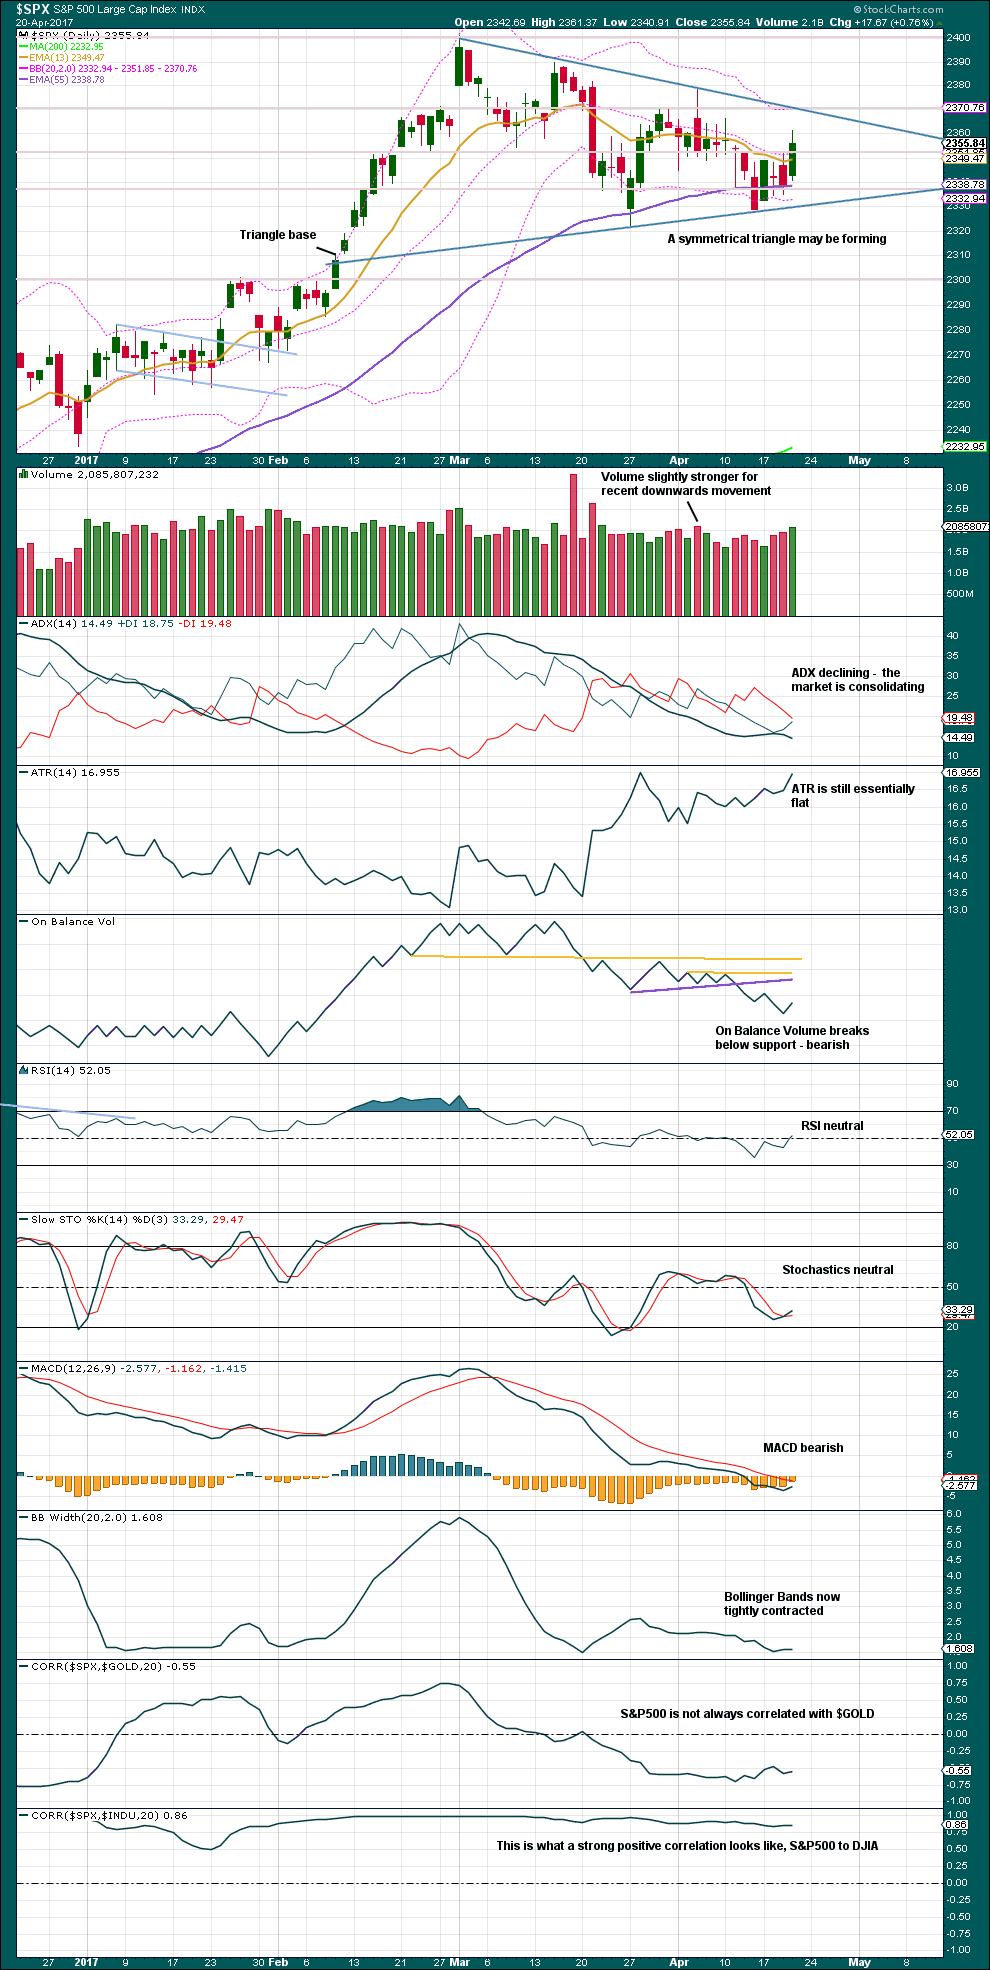
A large symmetrical triangle looks like is forming. With two minor swing highs and two minor swing lows, trend lines may now be drawn about this pattern.
Volume usually trends downwards during a triangle pattern (86% of the time). In this case, that is not happening yet but may still do as the triangle continues.
More white space is added to the right hand side of the chart. The apex (or cradle) will be seen as the triangle continues. A breakout from a triangle commonly occurs between 73% to 75% of the length of the triangle from base to apex (Kirkpatrick and Dhalquist, page 318).
After the breakout, pullbacks occur 59% of the time. High volume on the breakout should be expected, which would increase the performance of the breakout.
ADX and Bollinger Bands support the idea of a consolidating market.
MACD remains bearish. On Balance Volume remains bearish.
RSI and Stochastics remain neutral.
VOLATILITY – INVERTED VIX CHART
Click chart to enlarge. Chart courtesy of StockCharts.com.
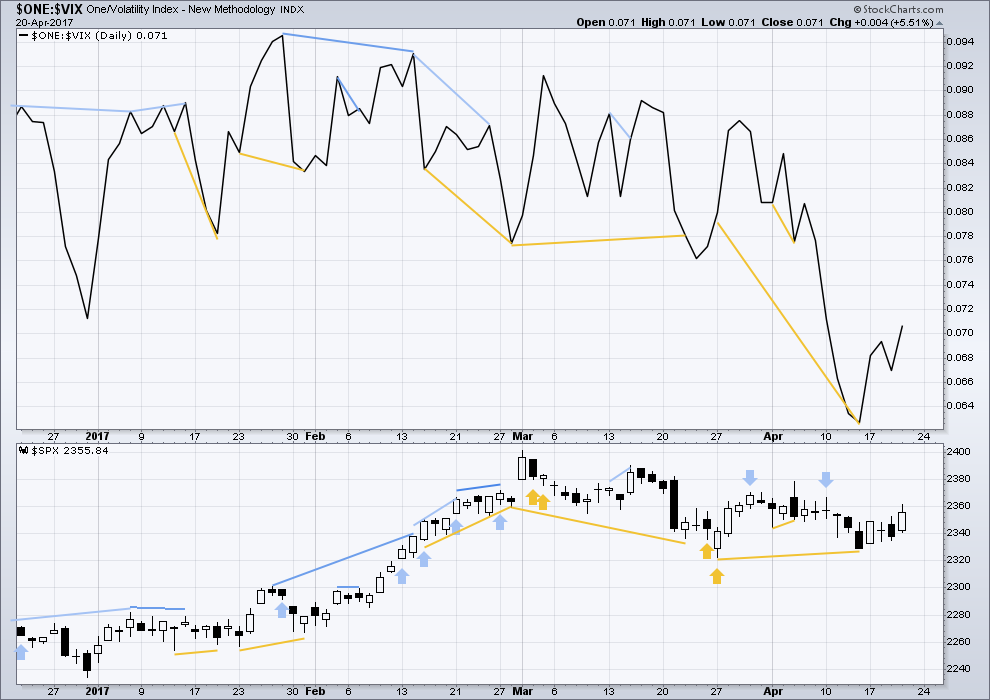
Normally, volatility should decline as price moves higher and increase as price moves lower. This means that normally inverted VIX should move in the same direction as price.
It is noted that there are now six multi day instances of bullish divergence between price and inverted VIX, and all have been followed so far by at least one upwards day if not more. This signal seems to again be working more often than not. It will again be given some weight in analysis.
There is no new divergence today noted between price and VIX.
BREADTH – AD LINE
Click chart to enlarge. Chart courtesy of StockCharts.com.
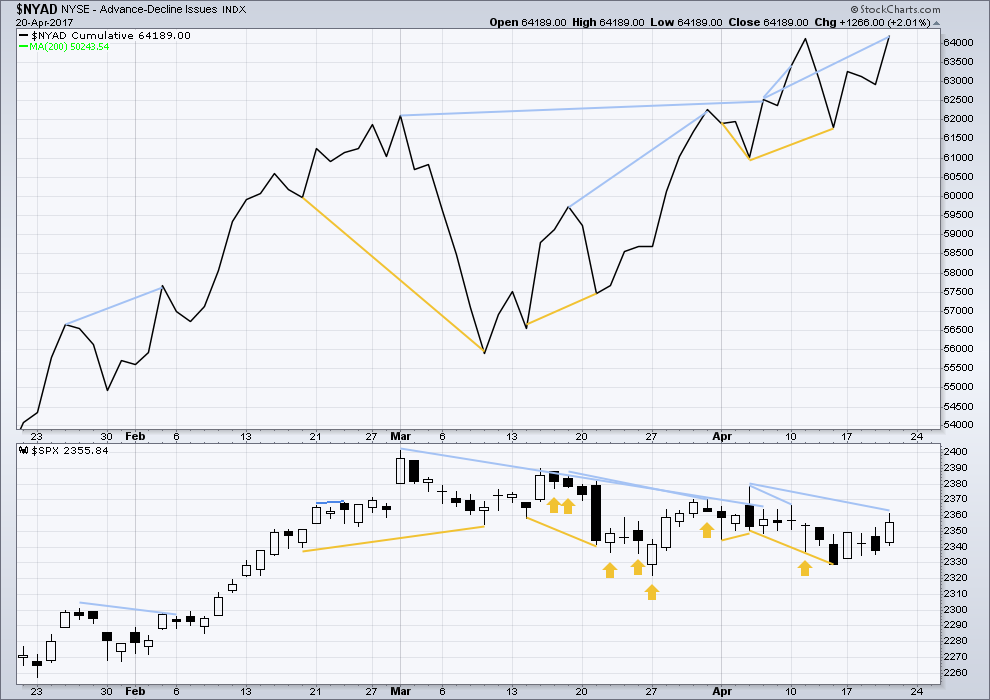
The rise in price has support from a rise in market breadth. Lowry’s measures of market breadth do not at this stage warn of an impending end to this bull market. They show an internally healthy bull market that should continue for at least 4-6 months.
No new reasonable divergence is noted today between price and the AD line. The AD line has made a very slight new high above the high for the 11th of April, and price has also made a new high above this point.
DOW THEORY
The DJIA, DJT, S&P500 and Nasdaq continue to make new all time highs. This confirms a bull market continues.
The following lows need to be exceeded for Dow Theory to confirm the end of the bull market and a change to a bear market:
DJIA: 17,883.56.
DJT: 7,029.41.
S&P500: 2,083.79.
Nasdaq: 5,034.41.
Charts showing each prior major swing low used for Dow Theory are here.
This analysis is published @ 10:33 p.m. EST.
Options expiration guaranteed the banksters would try to keep the market flat and in that they have succeeded. Hopefully E down completes in a day or two so we can get our final wave. With the triangle pretty much confirmed it should be short and sweet.
Have a great week-end everybody!
Will do. And you too Verne 🙂
Updated hourly chart before the close:
Overlapping. I tried to see if minor A could be a leading diagonal over at todays high, but it would have it’s third wave the shortest so no, that doesn’t work.
So minor C of intermediate (D) may be unfolding as an ending diagonal. The most common type by a fair margin is a contracting diagonal, so expect minute iii to be shorter than 26.83 so it’s shorter than minute i.
So far this big triangle looks legit. Unfortunately what that means is this market may be in a big very time consuming consolidation. They’re the worst to try and trade. Only the experts should attempt it. The rest of us should wait patiently on the sidelines.
This one’s for you Verne 🙂
May everyone have a very relaxing and refreshing weekend.
That leading diagonal idea did cross my mind earlier as well. An ending diagonal would be great as it would quickly retrace to the AC trend-line and definitely worth a quick scalp, and then…..up we go. Thanks for the update! 🙂
Israeli warplanes are attacking Syrian troop positions.
I guess what happened is that Trump just announced that “massive” tax cuts are coming next week and supposedly all the shorts went running for cover. BS! What shorts??!!!
For the triangle, the E wave down has to stay above the C wave low of around 2327.58. If it is a H&S it will break through as the neckline is around 2329.00 . If the triangle low holds the move up will be very sharp and will offer an excellent long trade with a very clearly defined stop.
all kinds of tom foolery today
Can you believe it???!!!
Selling second batch of bearish SPY credit spreads 238/239 strikes. Limit credit of 0.10
Did you see Bank of America’s Liquidity Supernova Update? Banksters bought $1 trillion!
Figures!
Wow!
Keeping in mind the fact that sentiment drives the waves, I recently alluded to the fact that institutions, and hedge funds have been exiting the markets the last eighteen months, and that the inflows during the last market run-up came primarily from retail investors. The chart is striking. January brought in ETF inflows of 35 billion and February brought in 52 billion. This represents the highest two month inflow on record! Schwabb confirms that they have recently seen the most brokerage accounts opened in 17 years.
Some are contending that this means we are only in the middle of the rally with much more upside to come. Meanwhile, the insiders have only increased their rates of selling out of their positions, now at the fastest rate in six years, since 2011. They unloaded 9.9 billion in February, and 9.7 billion in March. Interestingly enough, seventeen years ago was the year 2000. Remember what happened?
Here is the bottom line question: How long can the sentiment of the so-called “Dumb Money” keep the markets afloat??!! 🙂
I’ll take a punt on answering that one Verne.
A surprisingly long time is my answer.
Bubbles have a tendency to inflate further and continue for longer than anyone watching would expect. It’s impossible to predict their end, but I’m learning that you have to be patient and expect them to continue for what looks like an impossibly long time.
Actually the A-C trend-line is not that far below where the index is trading currently, and unless E traces out another three wave structure it could be easily tagged today.
A move below 2338.17 fills open gap from yesterday and probably means wave E down of triangle underway…it usually falls short of the A-C trend-line (2327.58) and considering all the bankster pumping we have been seeing, this is quite likely.
It seems to me that we can expect the banksters to keep ramping this market until the wave structure is completed. We continue to see slow, languid, tortured declines and sharp, manic reversals to the upside. When was the last time you saw a two hundred point down day that stuck??
I think Lara is right on the money with the triangle count, which means we have limited downside before the corrective structure is completed. I am going to actually start to get positioned for the eventual resumption of the uptrend by not trying to short the index outright, but indirectly via bearish call spreads for the E wave down. These will be one point spreads as the object is not so much to make a big profit, as it is to get positioned for the resumption of the uptrend as cheaply (or even cost-free) as possible. As the end of E approaches, the short side of the spread can be closed, while staying long the market via long calls. Today opening May 12 240/241 bear call spread
for 0.10 limit credit.
In fact, the D wave may have already completed based on Lara’s current hourly count, which has been invalidated with today’s downward movement. We could be looking at a quick E wave, and then a turn up.
Yep!
Lara,
I’m wondering if we could still be in the B wave of the triangle at intermediate degree, tracing out a complex wave for Wave B. If we rise above 2378, would this be a possibility? It would certainly allow for this triangle to drag out longer, which for the main wave count of Primary Wave 4 would seem to make sense.
Thanks,
Peter
Will chart this idea and look into it today Peter.
Thanks, Lara. Also, once we resume the uptrend, will there by any way to tell if we are in Primary 5 as opposed to a fifth wave at lesser degree.
Enjoy the weekend!
Keeping a sharp eye on the 50 day sma 2356.34 S solid close above it may signal a resumption of the bullish trend. I am not expecting that, but in these markets one has to expect the unexpected… 🙂
Aha. First again.