
Downwards movement was expected to begin the new trading week. This is not what happened. Upwards movement invalidated the hourly Elliott wave count.
Summary: If price makes a new high above 2,353.99, then the alternate would have more confidence. Expect the next wave up to new all time highs is most likely underway. If price makes a new low below 2,322.25, then expect a deeper pullback is continuing towards a target at 2,299 – 2,297.
Classic analysis still favours a deeper pullback here.
New updates to this analysis are in bold.
Last monthly and weekly charts are here. Last historic analysis video is here.
MAIN ELLIOTT WAVE COUNT
WEEKLY CHART
Click chart to enlarge.
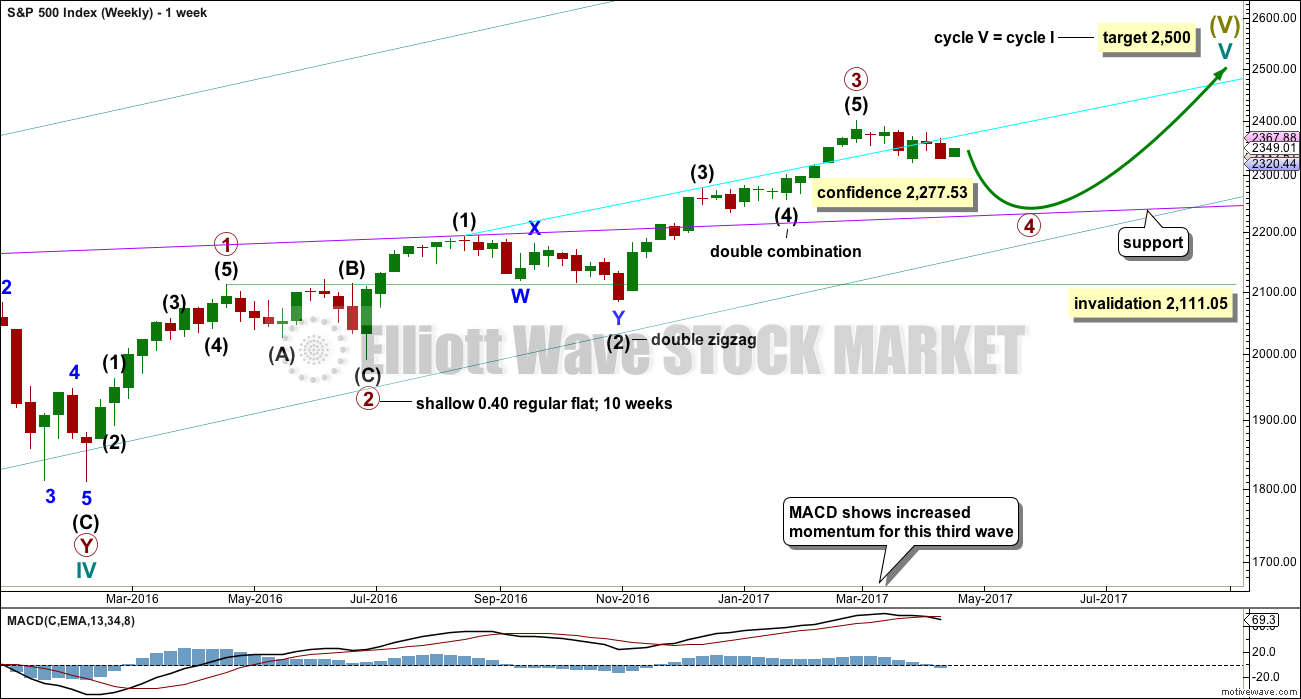
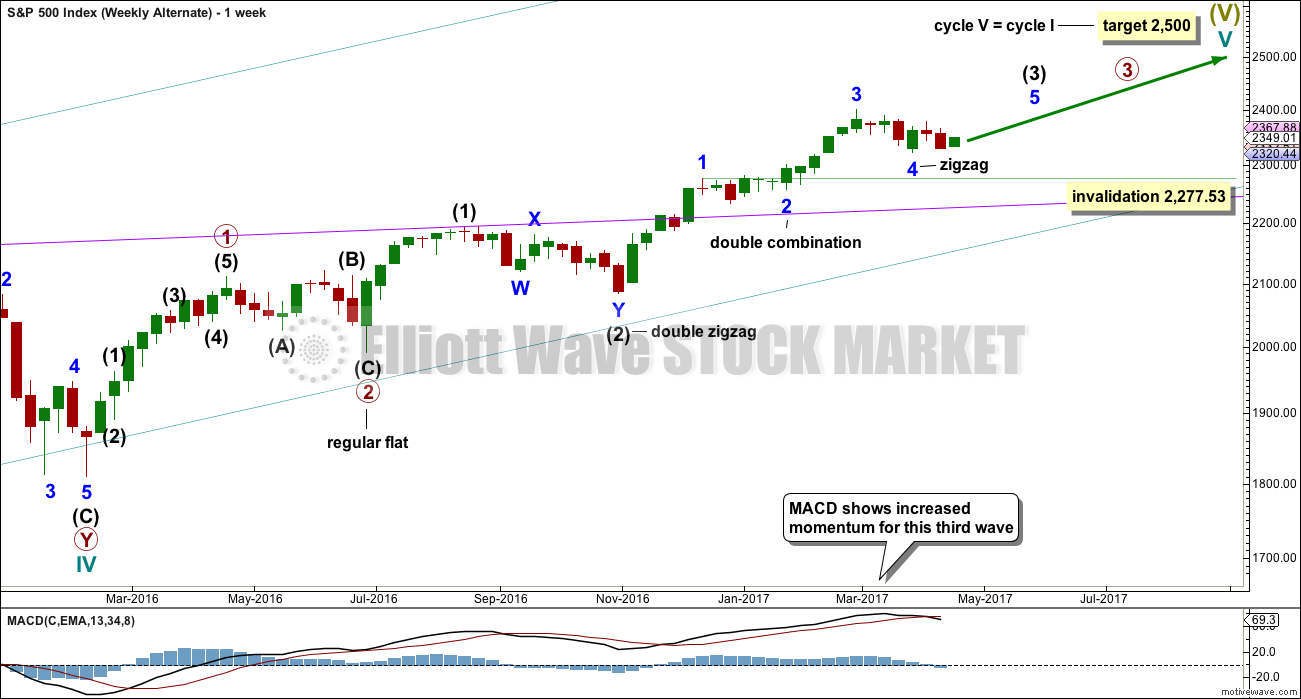
The degree of labelling within primary wave 3 is here moved up. It is possible that primary wave 3 may be over.
Primary wave 4 may continue lower.
To exhibit alternation with primary wave 2, primary wave 4 may be most likely a single or multiple zigzag. It may also be a triangle.
Primary wave 2 was a flat correction lasting 47 days (not a Fibonacci number). Primary wave 4 may be unfolding as a double zigzag. It may total a Fibonacci 34 or 55 sessions. If it totals a Fibonacci 34 sessions, it may end next Friday.
Primary wave 4 may not move into primary wave 1 price territory below 2,111.05.
DAILY CHART
Click chart to enlarge.
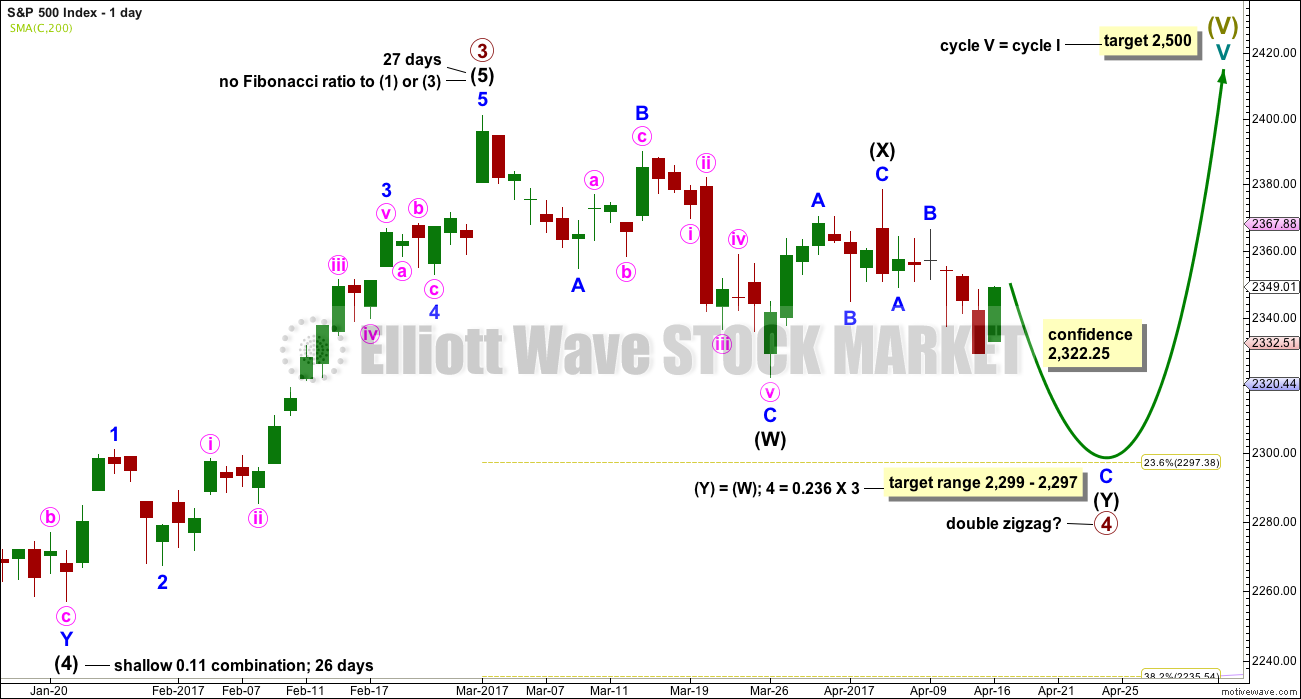
Within double zigzags, the X wave is almost always brief and shallow. There is no rule stating a maximum for X waves, but they should not make a new price extreme beyond the start of the first zigzag in the double.
X waves within combinations may make new price extremes (they may be equivalent to B waves within expanded flats), but in this instance primary wave 4 would be unlikely to be a combination as it would exhibit poor alternation with the flat correction of primary wave 2.
For this wave count intermediate wave (X) may now be complete.
If a new high above 2,400.98 is seen, then this wave count would be discarded.
The correction for primary wave 4 should be a multi week pullback, and it may not move into primary wave 1 price territory below 2,111.05.
A target is calculated for primary wave 4 to end based upon primary and intermediate degrees. This target would see primary wave 4 end just short of the fourth wave of one lesser degree price territory, that of intermediate wave (4) which has its range from 2,277.53 to 2,233.62. If the target at 2,299 – 2,297 is wrong, then it may not be low enough.
HOURLY CHART
Click chart to enlarge.
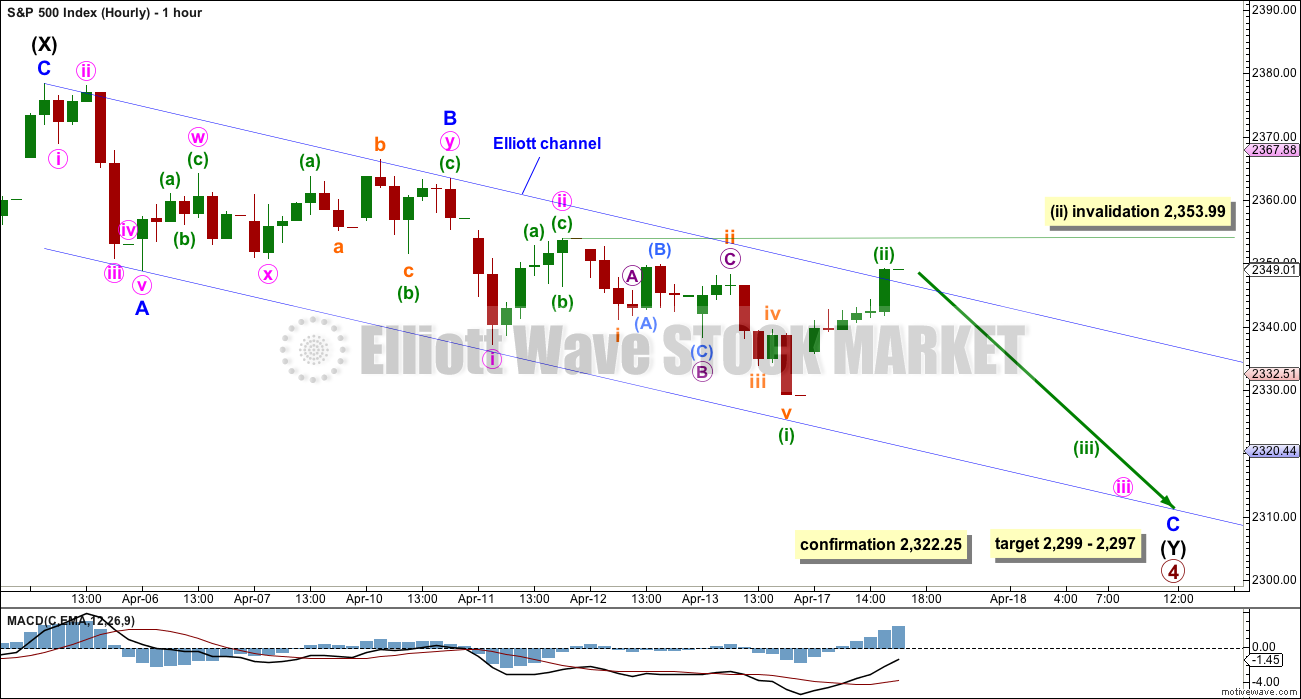
The second zigzag in the double is labelled intermediate wave (Y) and minor waves A and B may be complete within it.
Minor wave C may be underway, unfolding as an impulse; the structure looks incomplete. Within it the strongest portion may have passed on Thursday.
Minor wave C must complete as a five wave structure. It may find support about the lower edge of the Elliott channel.
When minuette wave (iii) is complete, then the following correction for minuette wave (iv) may not move into minuette wave (i) price territory above 2,341.18.
5 MINUTE CHART
Click chart to enlarge.
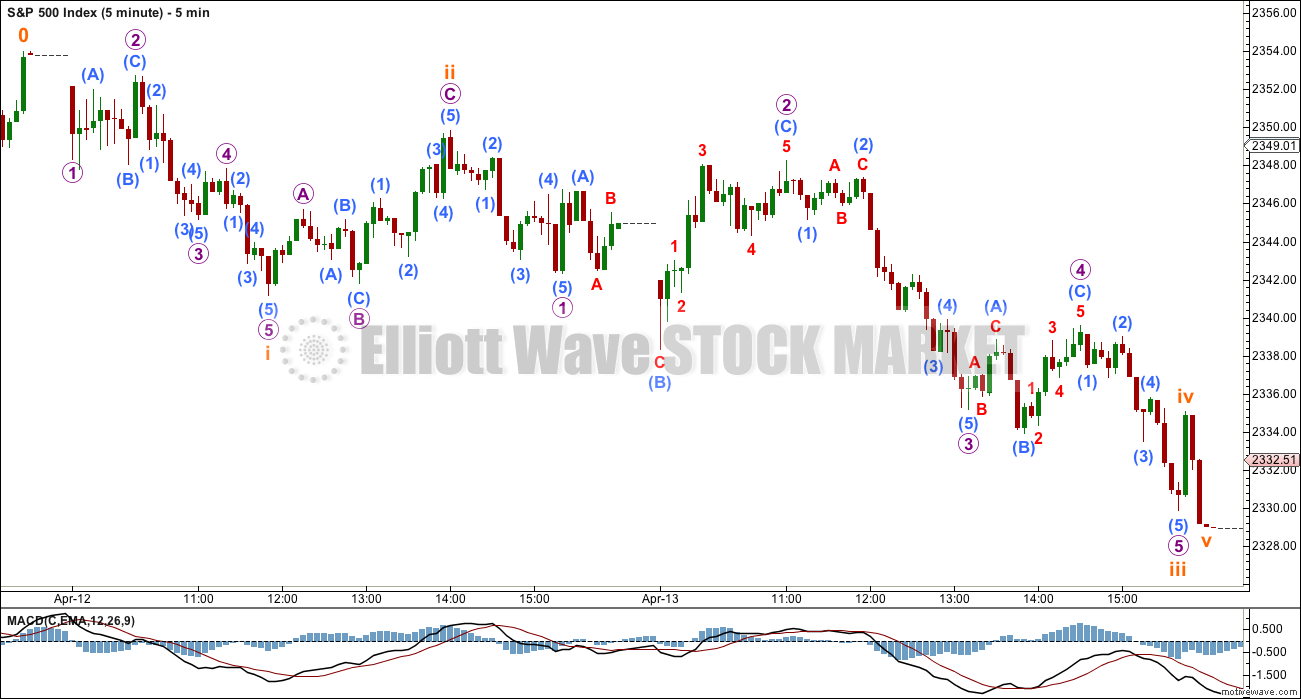
Subdivisions for minuette wave (i) do not show up neatly on the hourly chart. This five minute chart shows how this portion of movement has been analysed.
A quick shallow wave for subminuette wave iv gives the whole movement a three wave look at higher time frames, but it all fits neatly at lower time frames.
ALTERNATE ELLIOTT WAVE COUNT
WEEKLY CHART
Click chart to enlarge.
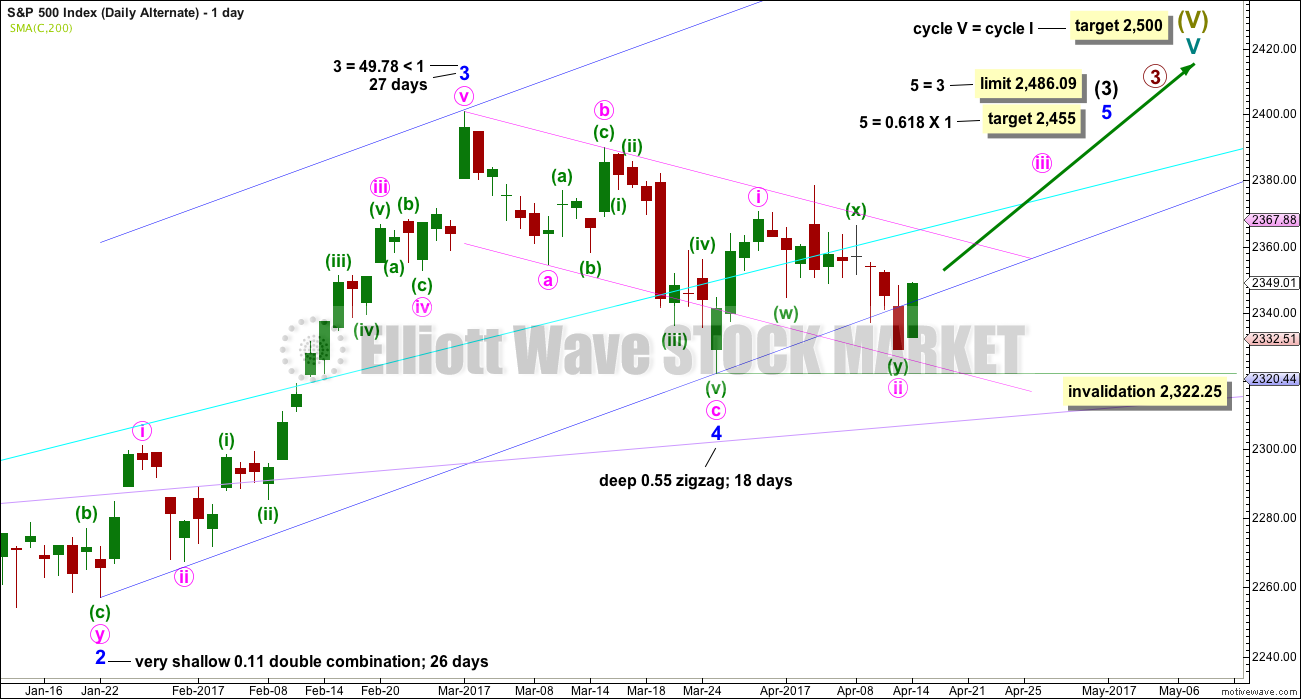
Cycle wave V is an incomplete structure. Within cycle wave V, primary wave 3 may be incomplete.
Within primary wave 3, intermediate wave (3) may be an incomplete impulse.
Within intermediate wave (3), if minor wave 4 continues, then it may not move into minor wave 1 price territory below 2,277.53.
DAILY CHART
Click chart to enlarge.
This wave count expects the just completed correction is minor wave 4. Within minor wave 5, minute wave ii may not move beyond the start of minute wave i below 2,322.25.
Minor wave 4 is a little below the fourth wave of one lesser degree. Because it has now clearly breached an Elliott channel drawn using the first technique, the channel is now redrawn using Elliott’s second technique. There is good alternation between the very shallow combination of minor wave 2 and the deeper zigzag of minor wave 4.
A target for minor wave 5 is calculated.
The Elliott channel about minor wave 4 is drawn on the daily chart. The upper edge may be providing some resistance. Once price can break above this channel, then upwards momentum may build.
Minor wave 3 is shorter than minor wave 1. So that the core Elliott wave rule stating a third wave may not be the shortest is met, minor wave 5 is limited to no longer than equality in length with minor wave 3.
HOURLY CHART
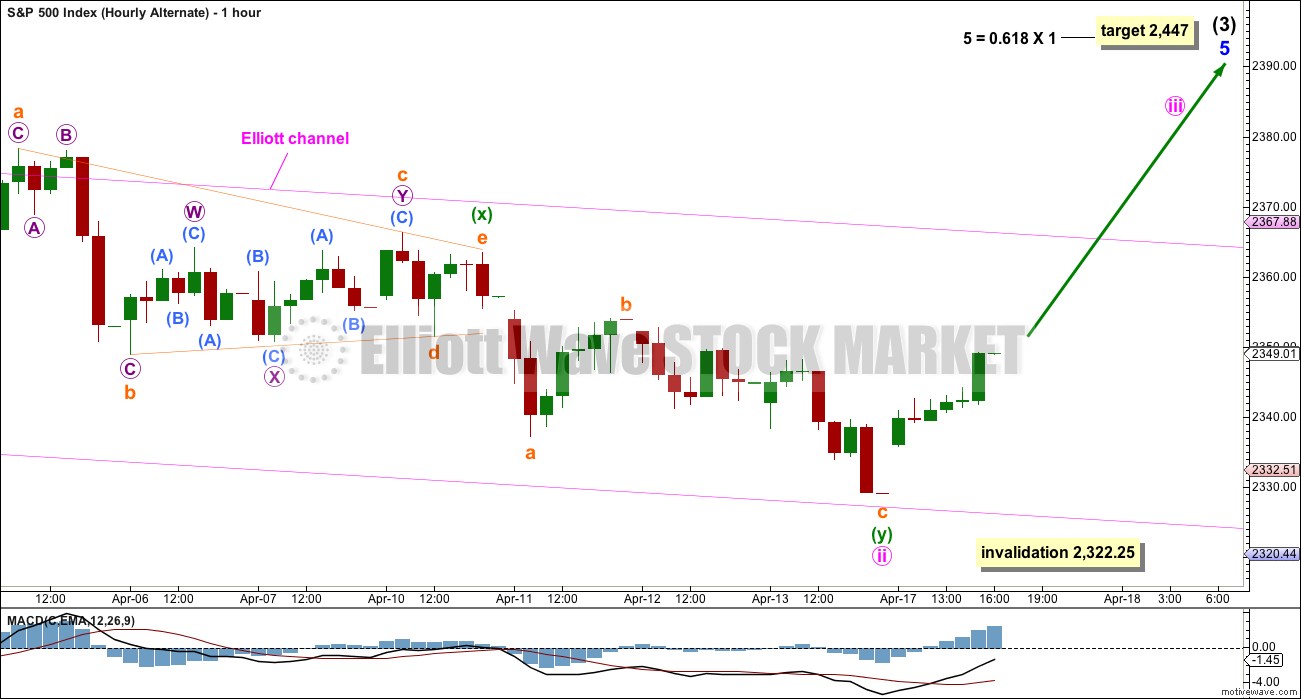
Click chart to enlarge.
Minute wave ii for this wave count should be over at Thursday’s low, or very soon on Tuesday. There is almost no room left for it to move into.
Within minute wave ii, the second zigzag of minuette wave (y) does not have a good fit. The third wave of micro wave 3 does not look like an impulse. This wave count is forced at this stage. This reduces the probability of it further.
TECHNICAL ANALYSIS
WEEKLY CHART
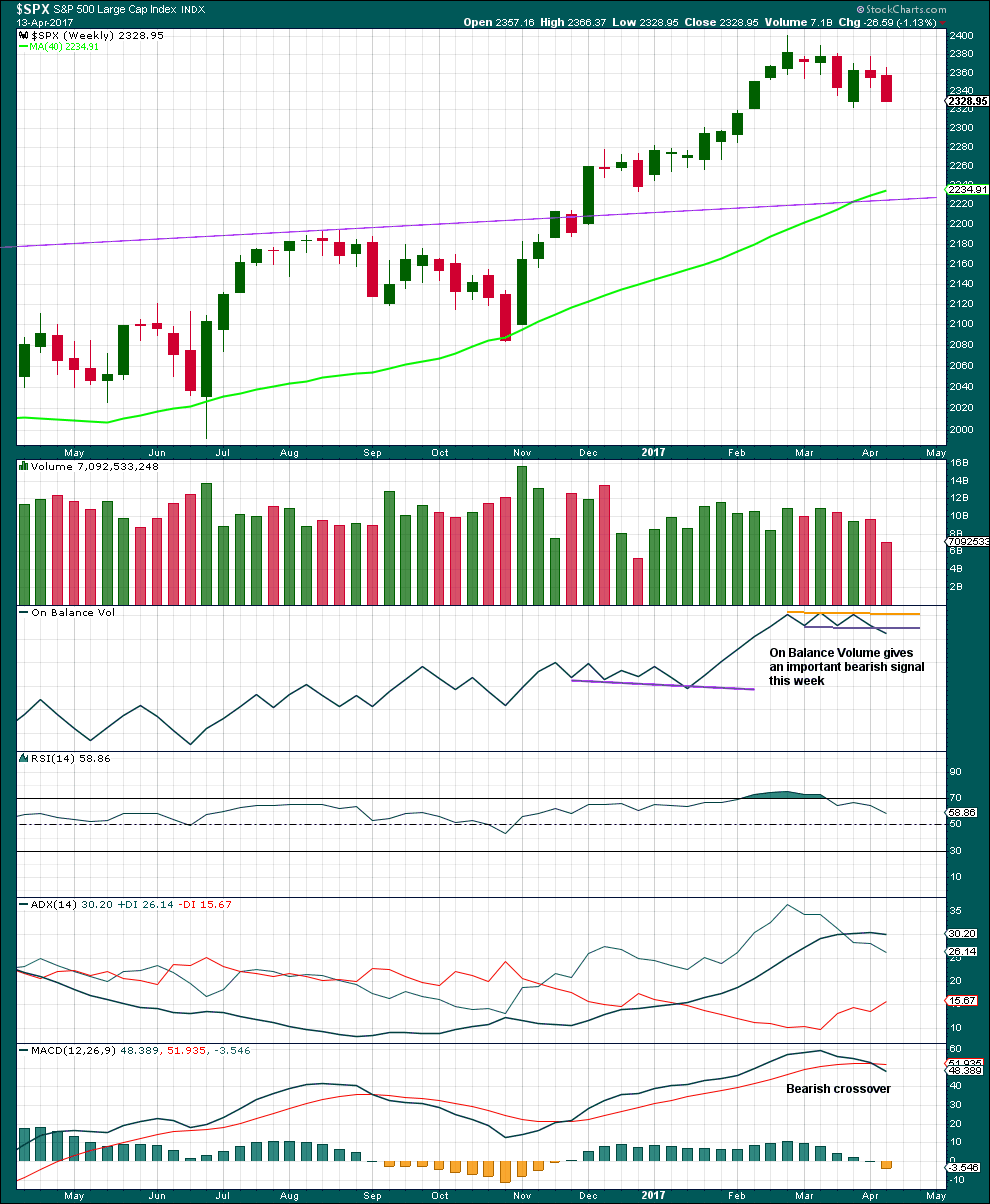
Click chart to enlarge. Chart courtesy of StockCharts.com.
Although a strong downwards week has lighter volume, because last week was a short week this should not be read as bullish.
The signal from On Balance Volume should be given weight; it supports the main Elliott wave count. In conjunction with MACD, this is overall a fairly bearish weekly chart.
DAILY CHART
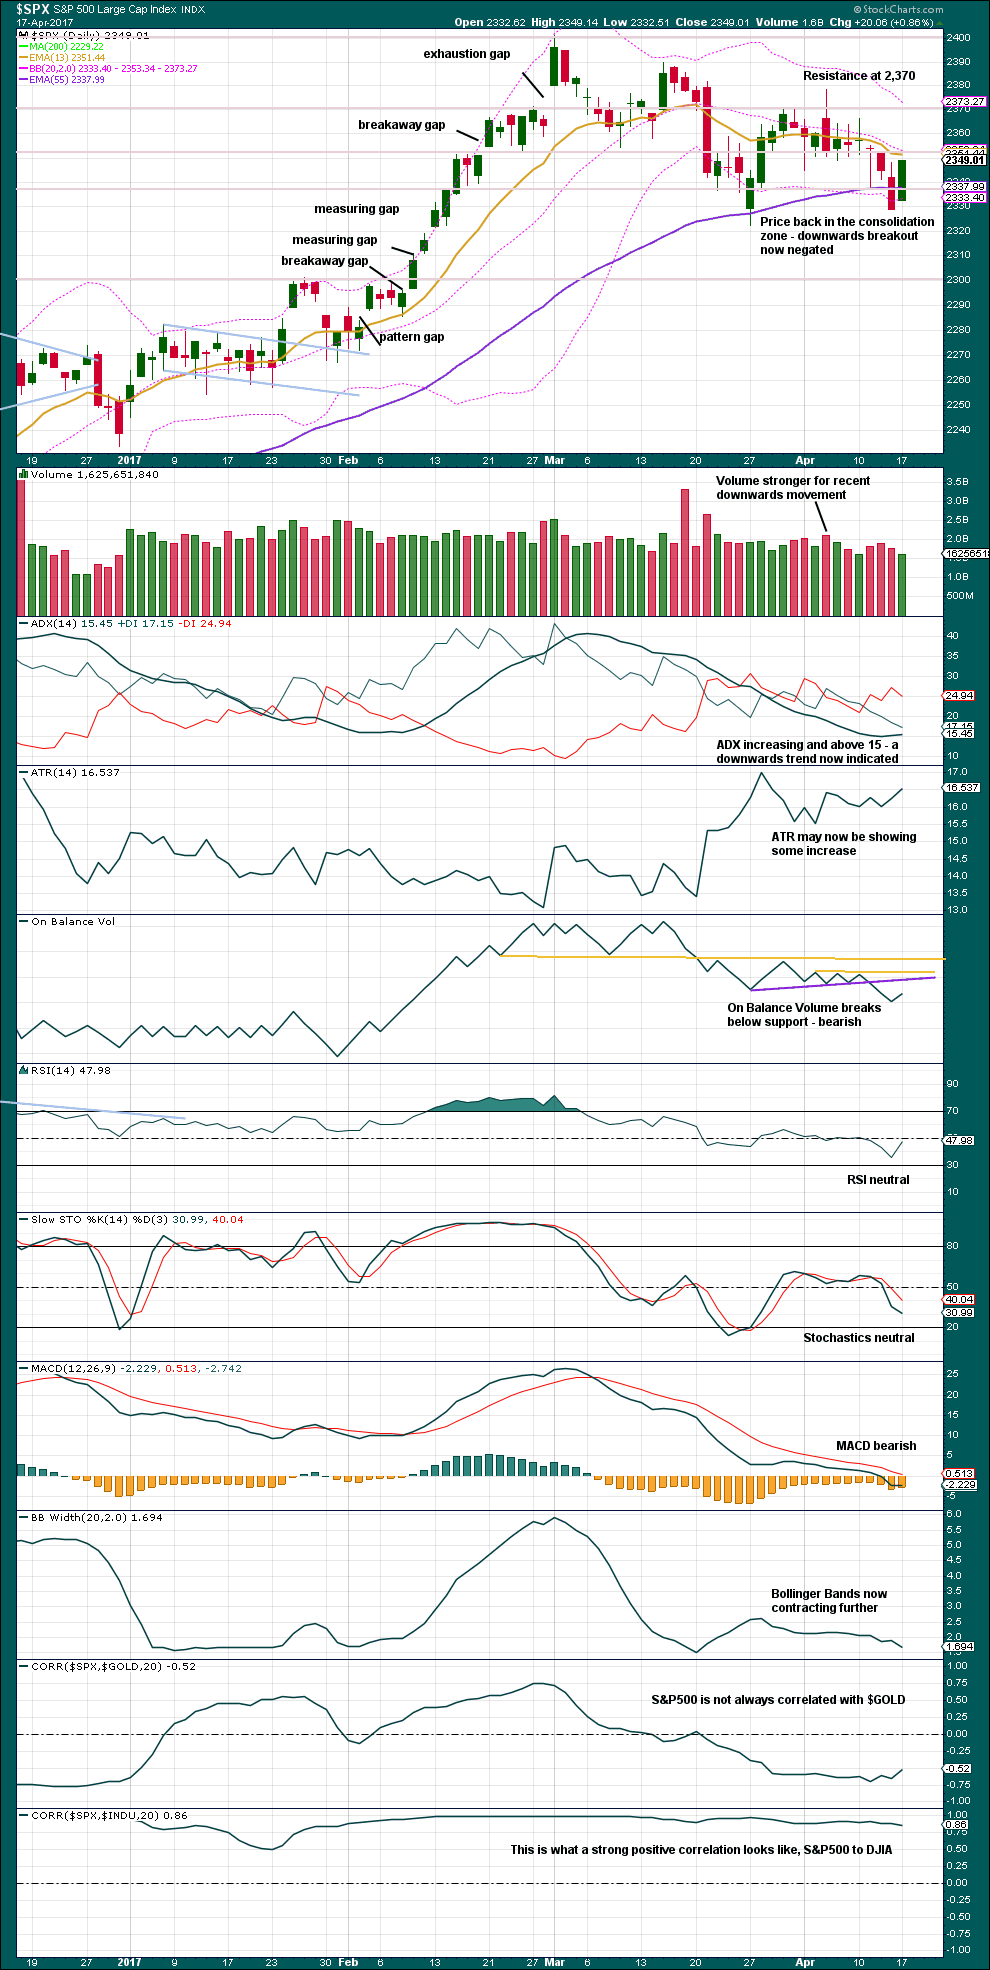
Click chart to enlarge. Chart courtesy of StockCharts.com.
Upwards movement for Monday does not have support from volume. This is bearish. Price may find resistance here about the Fibonacci 13 day moving average and the mid line of Bollinger Bands.
The only concern regarding this downwards trend is the continued contraction of Bollinger Bands. This trend lacks the normal volatility to the downside.
Overall, this chart is bearish with some neutrality.
VOLATILITY – INVERTED VIX CHART
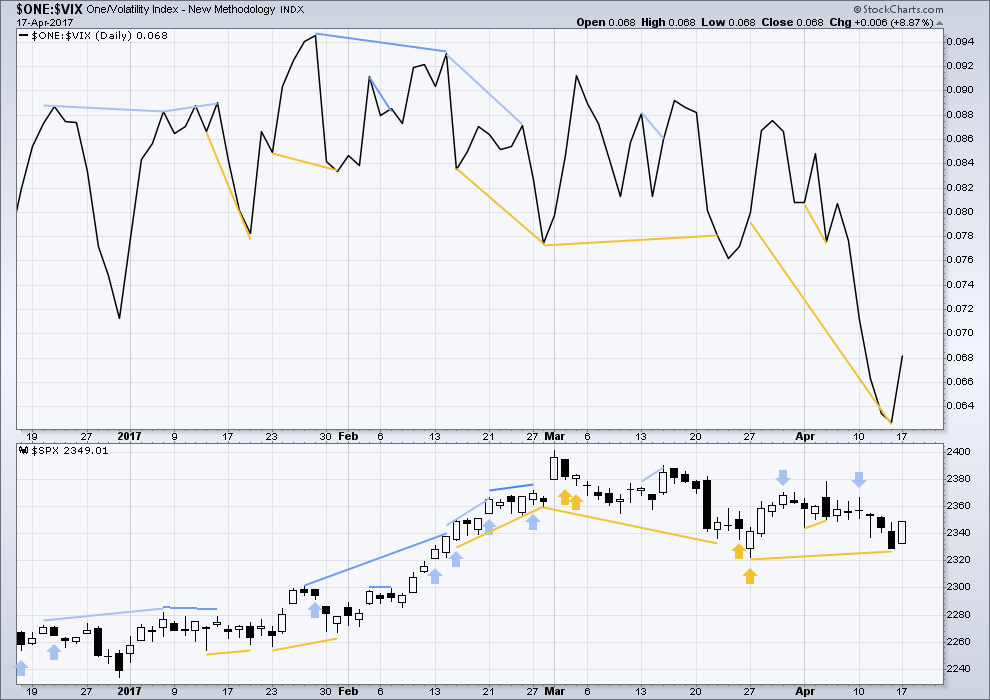
Click chart to enlarge. Chart courtesy of StockCharts.com.
Normally, volatility should decline as price moves higher and increase as price moves lower. This means that normally inverted VIX should move in the same direction as price.
The mid term bullish divergence between inverted VIX and price has finally been followed by some upwards movement. It may be resolved here, or it may yet need another upwards day to resolve it.
It is noted that there are now six multi day instances of bullish divergence between price and inverted VIX, and all have been followed so far by at least one upwards day if not more. This signal seems to again be working more often than not. It will again be given some weight in analysis.
BREADTH – AD LINE
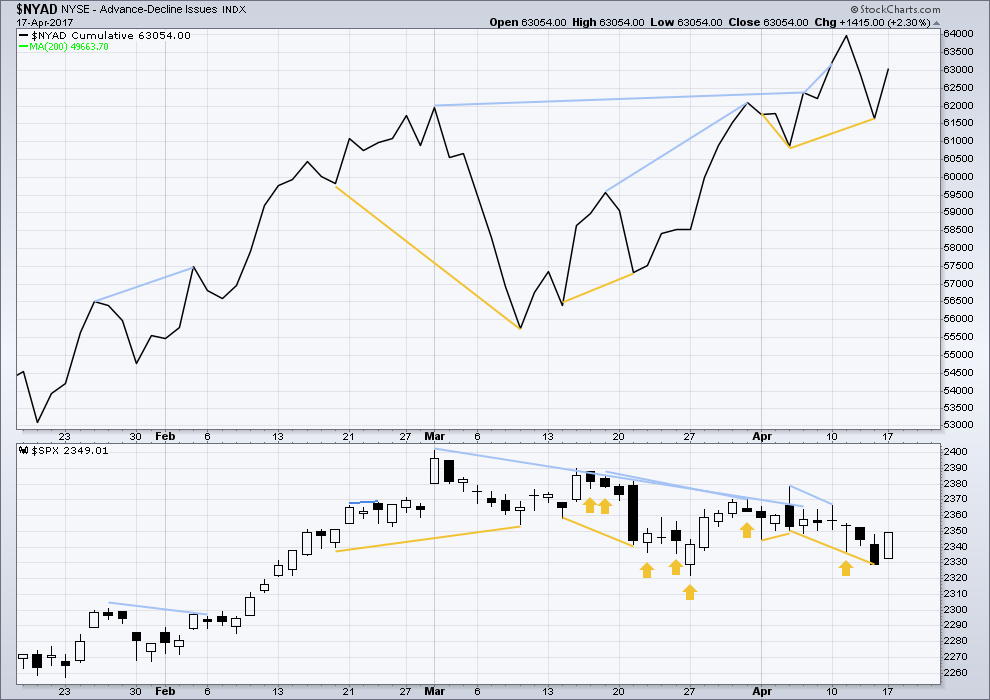
Click chart to enlarge. Chart courtesy of StockCharts.com.
The rise in price has support from a rise in market breadth. Lowry’s measures of market breadth do not at this stage warn of an impending end to this bull market. They show an internally healthy bull market that should continue for at least 4-6 months.
Short term bullish divergence between price and the AD line has now been followed by one day of upwards movement. It may be resolved here, or it may yet need another upwards day before it is resolved.
It is noted that the last four instances of bullish divergence (not single day but multi day) have all been followed by upwards movement.
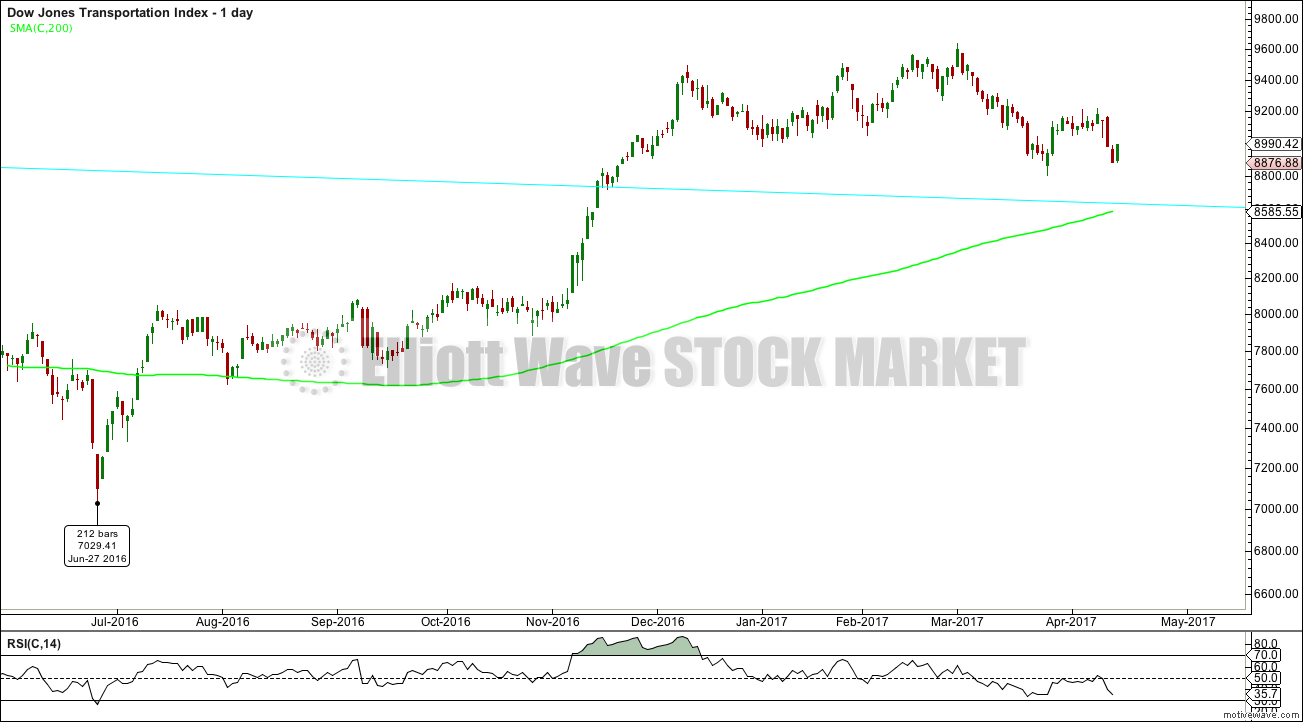
DOW THEORY
The DJIA, DJT, S&P500 and Nasdaq continue to make new all time highs. This confirms a bull market continues.
The following lows need to be exceeded for Dow Theory to confirm the end of the bull market and a change to a bear market:
DJIA: 17,883.56.
DJT: 7,029.41.
S&P500: 2,083.79.
Nasdaq: 5,034.41.
Charts showing each prior major swing low used for Dow Theory are below:
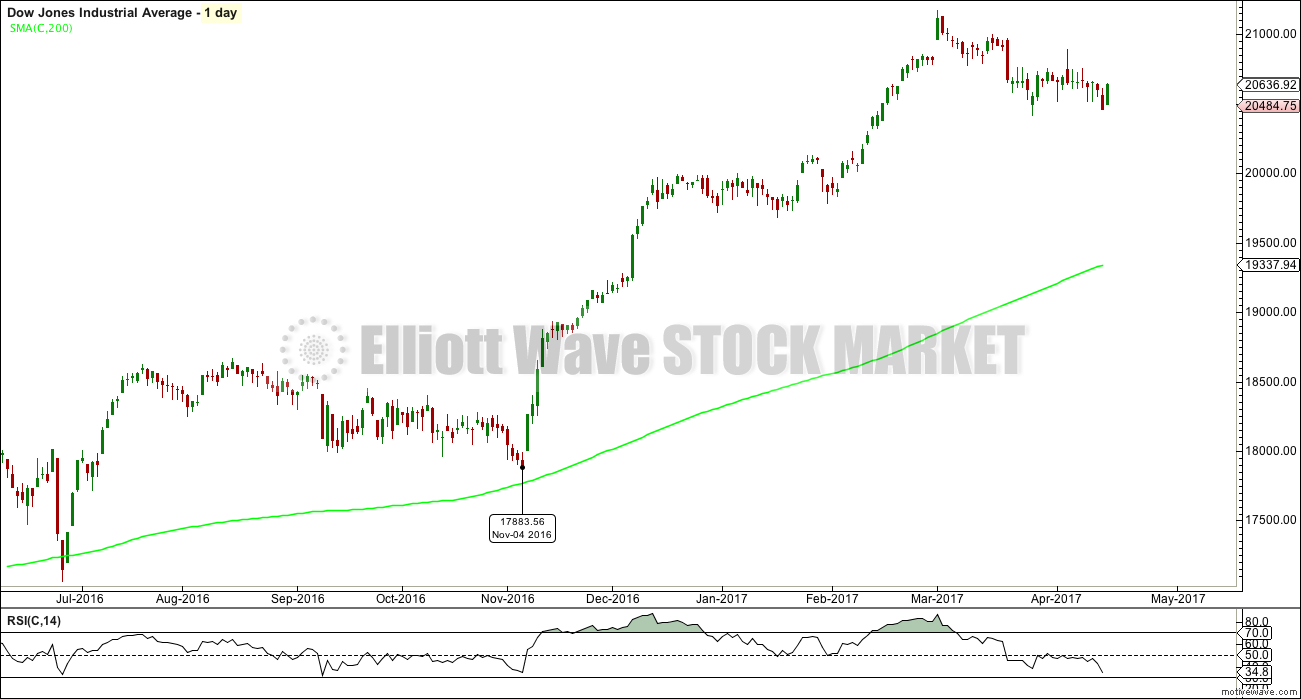
Click chart to enlarge.
Click chart to enlarge.
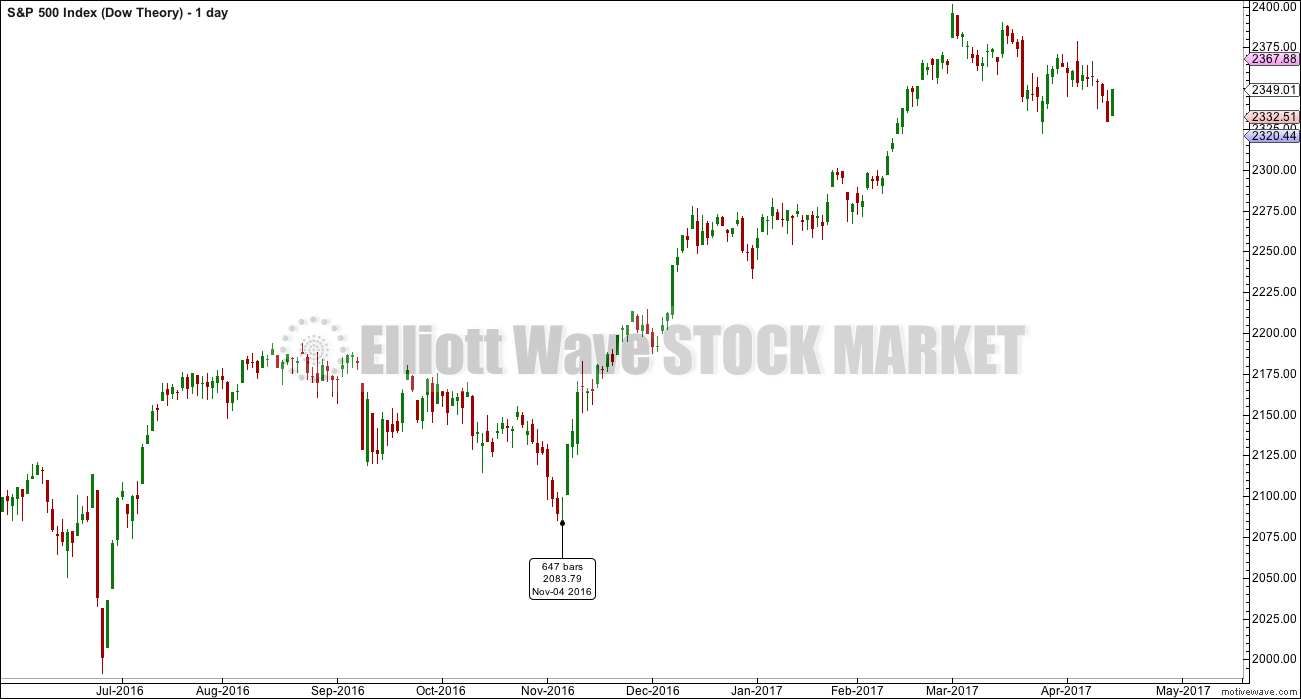
Click chart to enlarge.
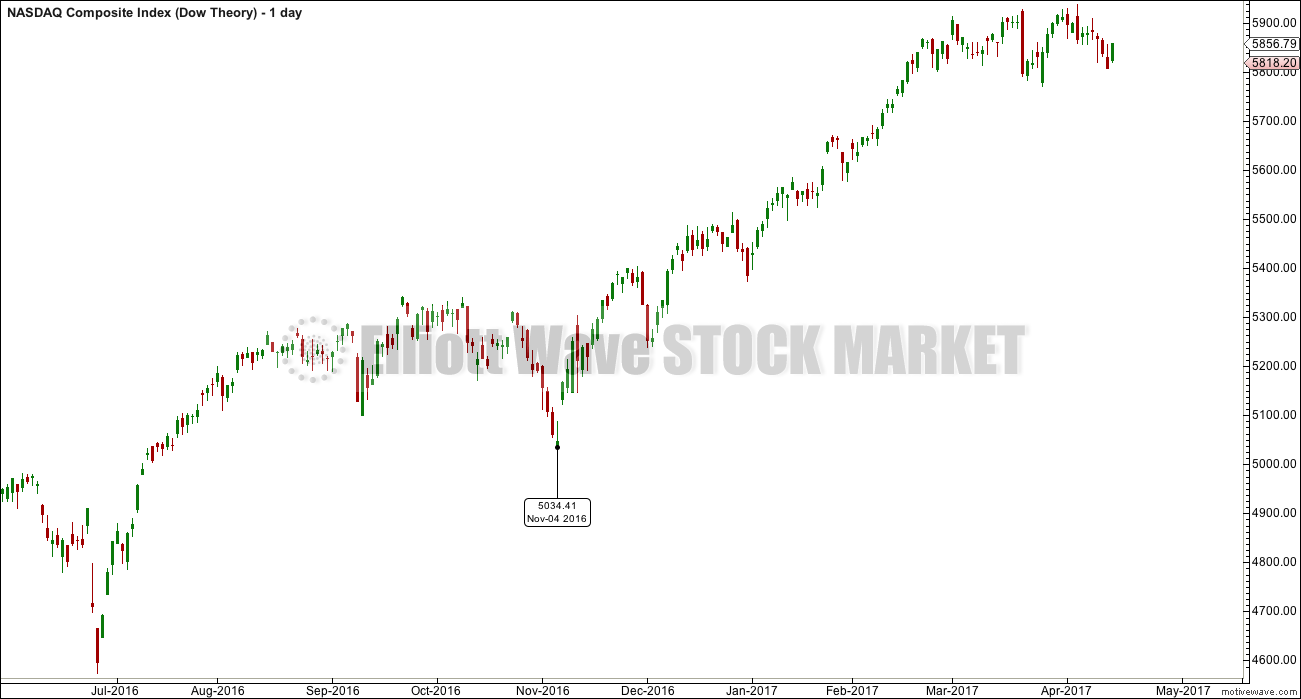
Click chart to enlarge.
This analysis is published @ 11:41 p.m. EST.
Hi Lara
Have you had a chance to look at the chart I emailed you? I wasn’t able to load it up on to this site.
Thanks
Peter
Not yet, but when I do I’ll email you back.
Great thanks
A small inside day doesn’t change the analysis at all. So no update here in comments, nothing really to say when price does that. Most annoying I know.
Overall the trend is down. Lower lows, lower highs, resistance at the trend line.
Hi Lara,
Thanks for the analysis. Would it be possible to have a short “What to expect tomorrow” summary/blurb at the end of the analysis, something more condensed?
E.g.
Expectation if Main Count for Tomorrow: Up/Down, price levels to watch, etc.
Expectation if Alternate Count for Tomorrow: Up/Down, price levels to watch, etc.
Not sure if possible or feasible, but thought I’d ask.
I thought I’d done that at the top of the analysis, the bold “Summary”?
Counting through this chop is frustrating. All I see on the 3 day are impulsive 5 wave declines, with propped up 3 wave rallies. A big triangle?
Yeah, could be. That would still give some alternation still with the flat of primary 2.
Yep. They are fighting the decline tooth and claw. I am looking for an exit from the triangle to the downside eventually.
Wassup with that huge divergence with VIX today?
It seems as if the crowd is totally unfazed by this decline.
Instititional players started exiting this market 18 months ago.
Hedge funds started moving out 9 months later.
The run-up since last November has been almost exclusively retail investors who hopped on the Trump Train. The charts of the money flows tell an all too familiar story that always has the same ending…
Visiting Wash U in St. Louis today where my daughter is considering attending.
What an absolutely gorgeous campus!
Nice 🙂
Looking like Northwestern has the inside track based on her reaction so far…this place is really beautiful though and I would not mind frequent visits. 🙂
The SPX 13 ema has made a bearish crossover of the 34 ema. Supportive of Main Count.
Finally. I got it. #1. Whoopee!
Congratulations.