
Last analysis expected that the S&P was now in a primary degree pullback to continue lower. To end the short trading week, Thursday saw price move lower as expected.
Summary: A new target is calculated at two degrees for this pullback to end: 2,299 – 2,297. It is possible it could end in 4 more sessions. If not, then it may end in 24 more sessions.
New updates to this analysis are in bold.
Last monthly and weekly charts are here. Last historic analysis video is here.
MAIN ELLIOTT WAVE COUNT
WEEKLY CHART
Click chart to enlarge.
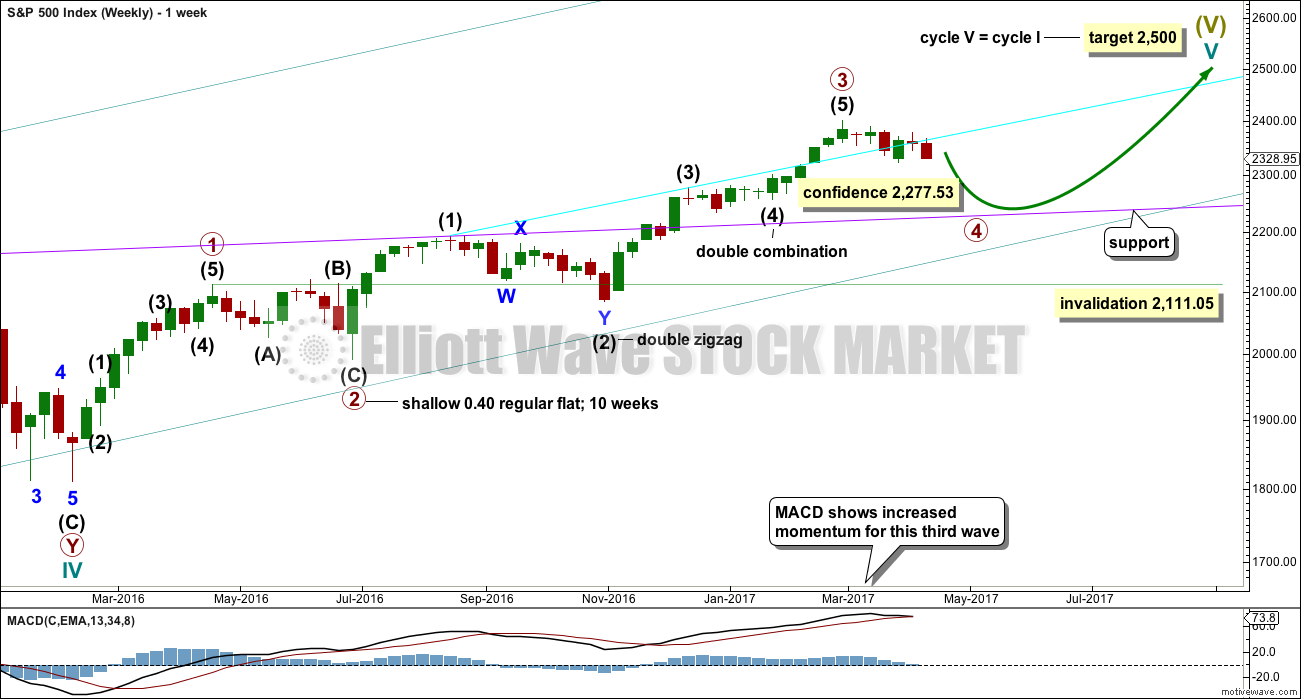
The degree of labelling within primary wave 3 is here moved up. It is possible that primary wave 3 may be over.
Primary wave 4 may continue lower.
To exhibit alternation with primary wave 2, primary wave 4 may be most likely a single or multiple zigzag. It may also be a triangle.
Primary wave 2 was a flat correction lasting 47 days (not a Fibonacci number). Primary wave 4 may be unfolding as a double zigzag. It may total a Fibonacci 34 or 55 sessions. If it totals a Fibonacci 34 sessions, it may end next Friday.
Primary wave 4 may not move into primary wave 1 price territory below 2,111.05.
DAILY CHART
Click chart to enlarge.
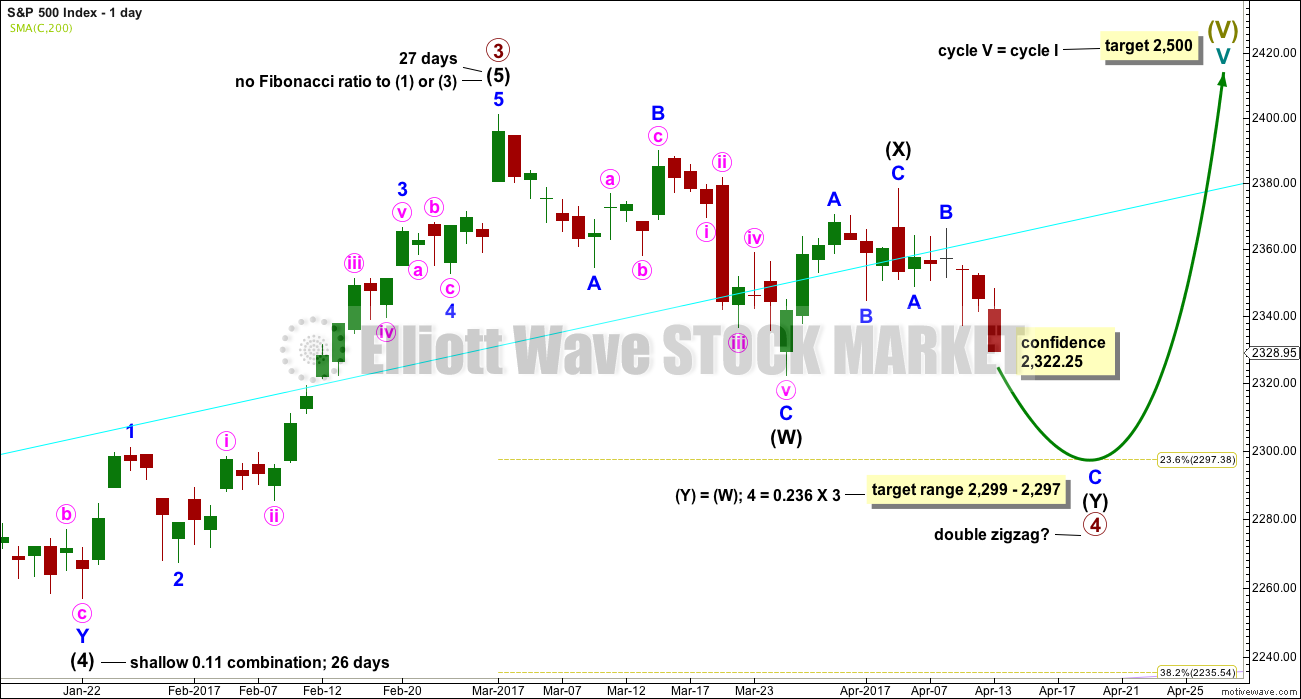
Within double zigzags, the X wave is almost always brief and shallow. There is no rule stating a maximum for X waves, but they should not make a new price extreme beyond the start of the first zigzag in the double.
X waves within combinations may make new price extremes (they may be equivalent to B waves within expanded flats), but in this instance primary wave 4 would be unlikely to be a combination as it would exhibit poor alternation with the flat correction of primary wave 2.
For this wave count intermediate wave (X) may now be complete.
If a new high above 2,400.98 is seen, then this wave count would be discarded.
The correction for primary wave 4 should be a multi week pullback, and it may not move into primary wave 1 price territory below 2,111.05.
A new target is calculated for primary wave 4 to end based upon primary and intermediate degrees. This target would see primary wave 4 end just short of the fourth wave of one lesser degree price territory, that of intermediate wave (4) which has its range from 2,277.53 to 2,233.62. If the target at 2,299 – 2,297 is wrong, then it may not be low enough.
HOURLY CHART
Click chart to enlarge.
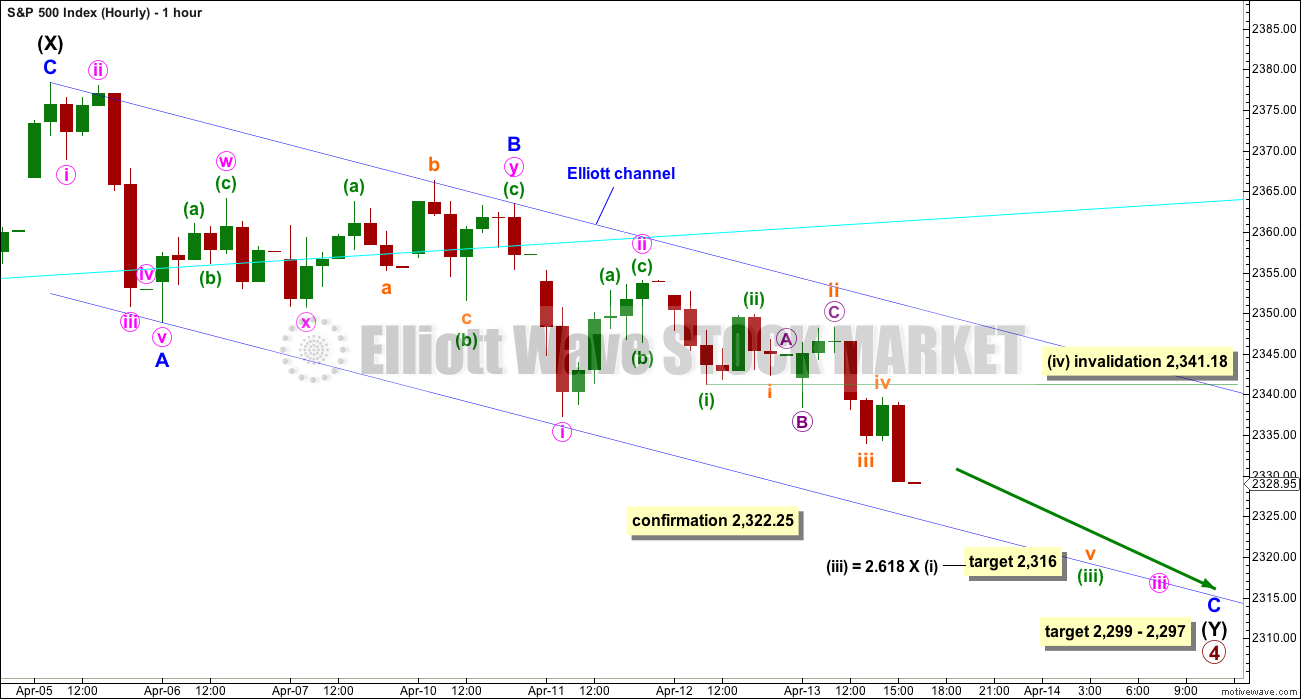
The second zigzag in the double is labelled intermediate wave (Y) and minor waves A and B may be complete within it.
Minor wave C may be underway, unfolding as an impulse; the structure looks incomplete. Within it the strongest portion may have passed on Thursday.
Minor wave C must complete as a five wave structure. It may find support about the lower edge of the Elliott channel.
When minuette wave (iii) is complete, then the following correction for minuette wave (iv) may not move into minuette wave (i) price territory above 2,341.18.
ALTERNATE ELLIOTT WAVE COUNT
WEEKLY CHART
Click chart to enlarge.
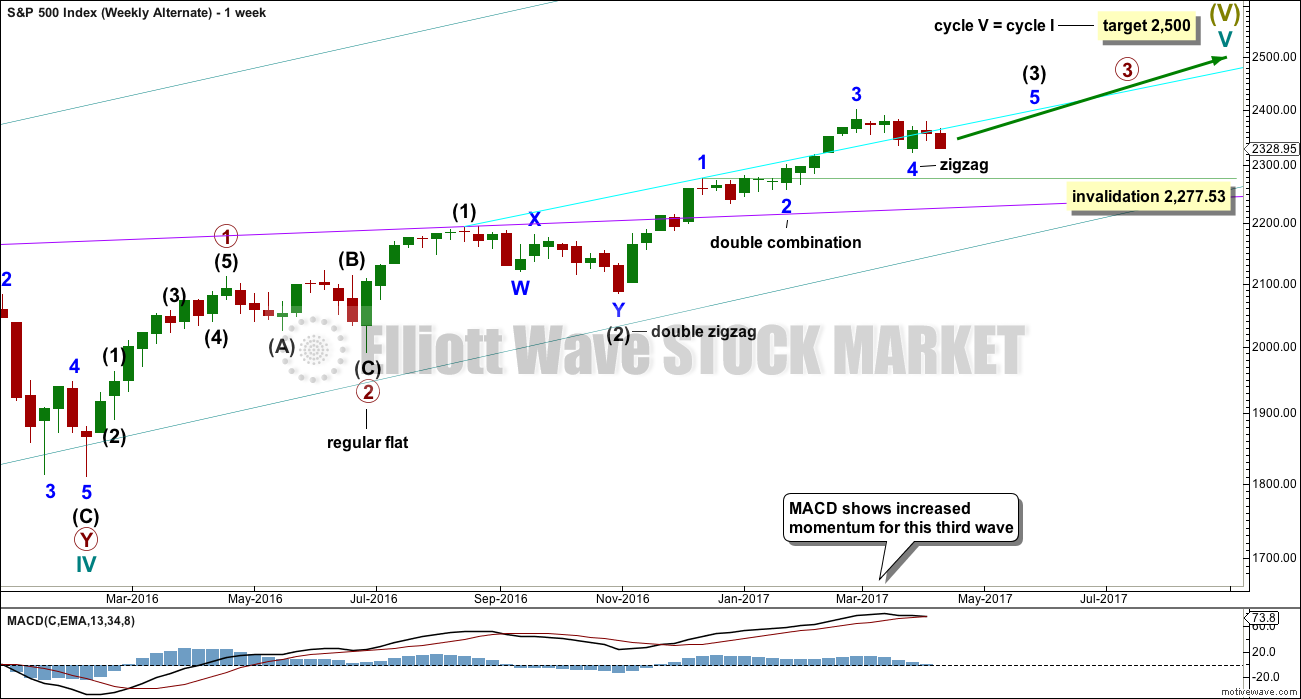
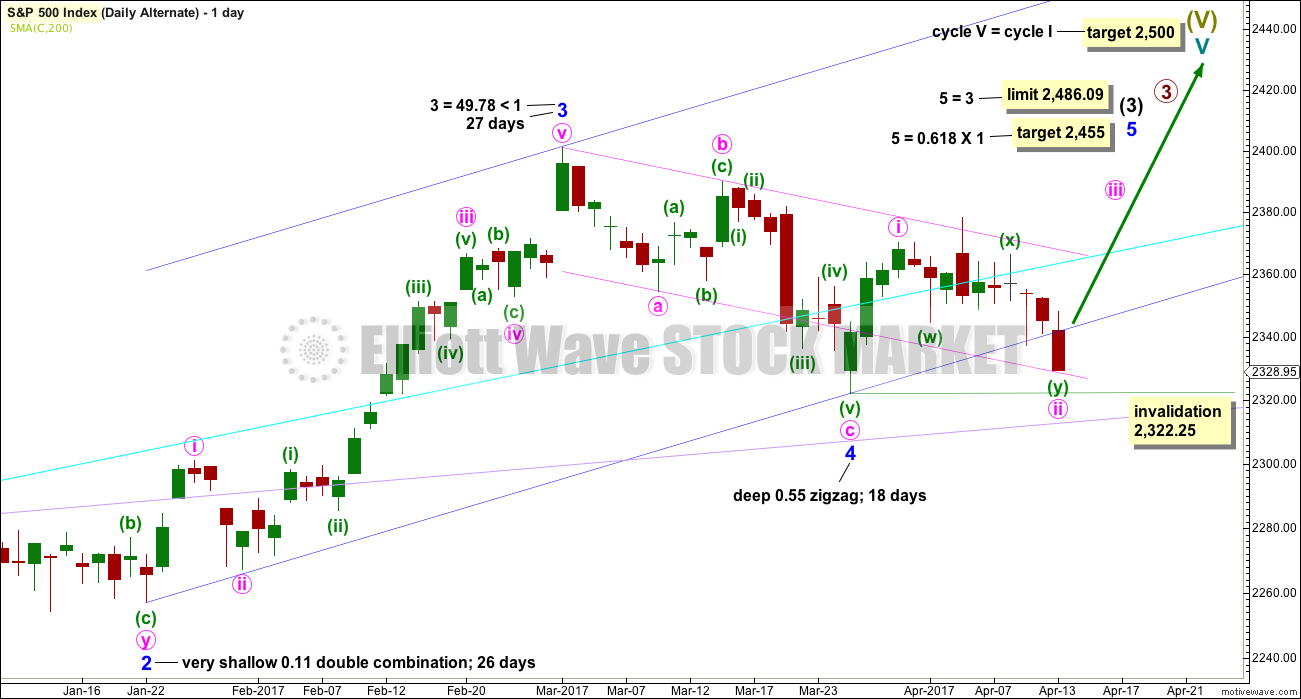
Cycle wave V is an incomplete structure. Within cycle wave V, primary wave 3 may be incomplete.
Within primary wave 3, intermediate wave (3) may be an incomplete impulse.
Within intermediate wave (3), if minor wave 4 continues, then it may not move into minor wave 1 price territory below 2,277.53.
DAILY CHART
Click chart to enlarge.
This wave count expects the just completed correction is minor wave 4. Within minor wave 5, minute wave ii may not move beyond the start of minute wave i below 2,322.25.
Minor wave 4 is a little below the fourth wave of one lesser degree. Because it has now clearly breached an Elliott channel drawn using the first technique, the channel is now redrawn using Elliott’s second technique. There is good alternation between the very shallow combination of minor wave 2 and the deeper zigzag of minor wave 4.
A target for minor wave 5 is calculated.
The Elliott channel about minor wave 4 is drawn on the daily chart. The upper edge may be providing some resistance. Once price can break above this channel, then upwards momentum may build.
Minor wave 3 is shorter than minor wave 1. So that the core Elliott wave rule stating a third wave may not be the shortest is met, minor wave 5 is limited to no longer than equality in length with minor wave 3.
HOURLY CHART
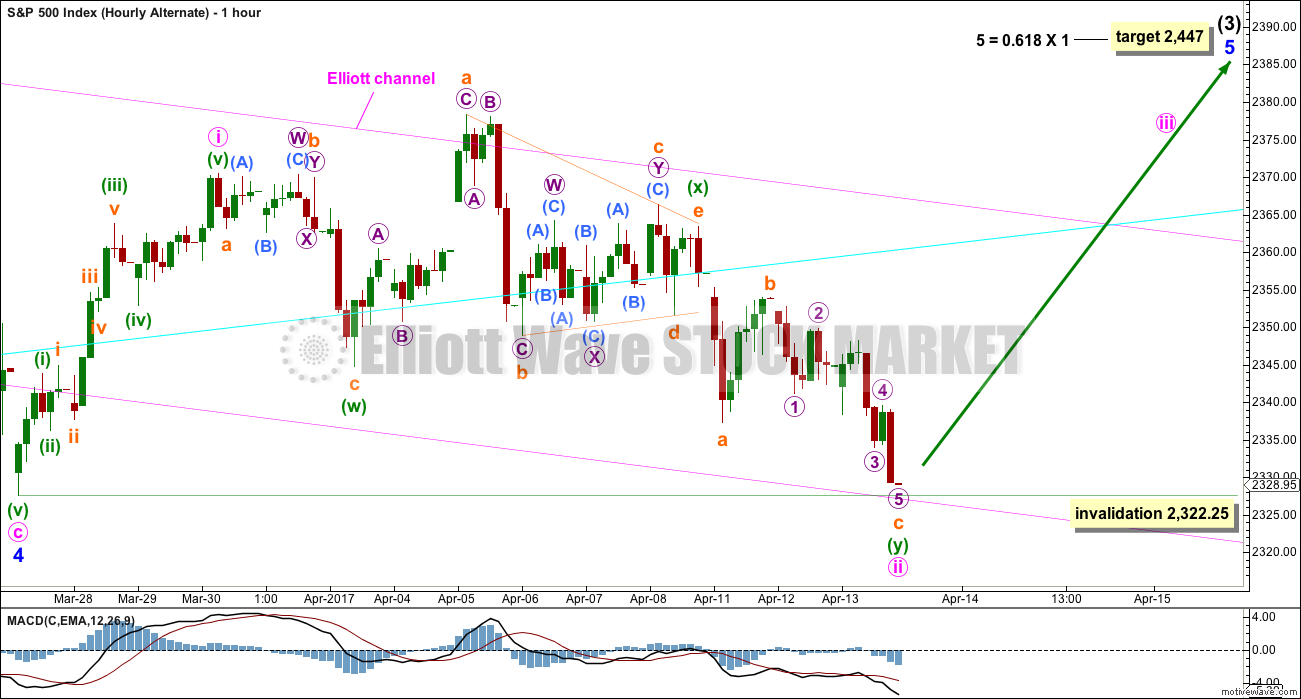
Click chart to enlarge.
Minute wave ii for this wave count should be over at Thursday’s low, or very soon on Tuesday. There is almost no room left for it to move into.
Within minute wave ii, the second zigzag of minuette wave (y) does not have a good fit. The third wave of micro wave 3 does not look like an impulse. This wave count is forced at this stage. This reduces the probability of it further.
TECHNICAL ANALYSIS
WEEKLY CHART
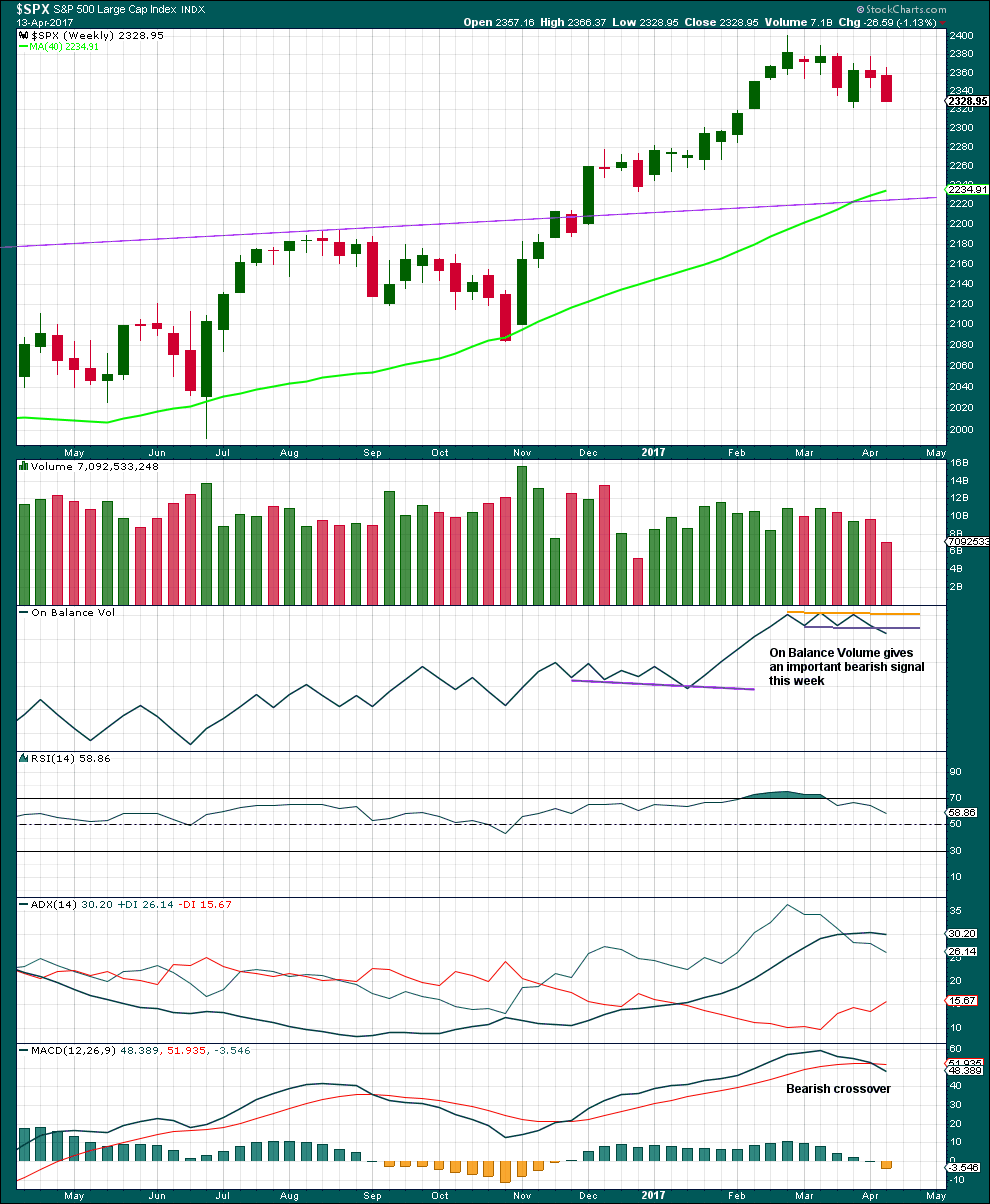
Click chart to enlarge. Chart courtesy of StockCharts.com.
Although a strong downwards week has lighter volume, because this is a short week this should not be read as bullish.
The signal from On Balance Volume should be given weight; it supports the main Elliott wave count. In conjunction with MACD, this is overall a fairly bearish weekly chart.
DAILY CHART
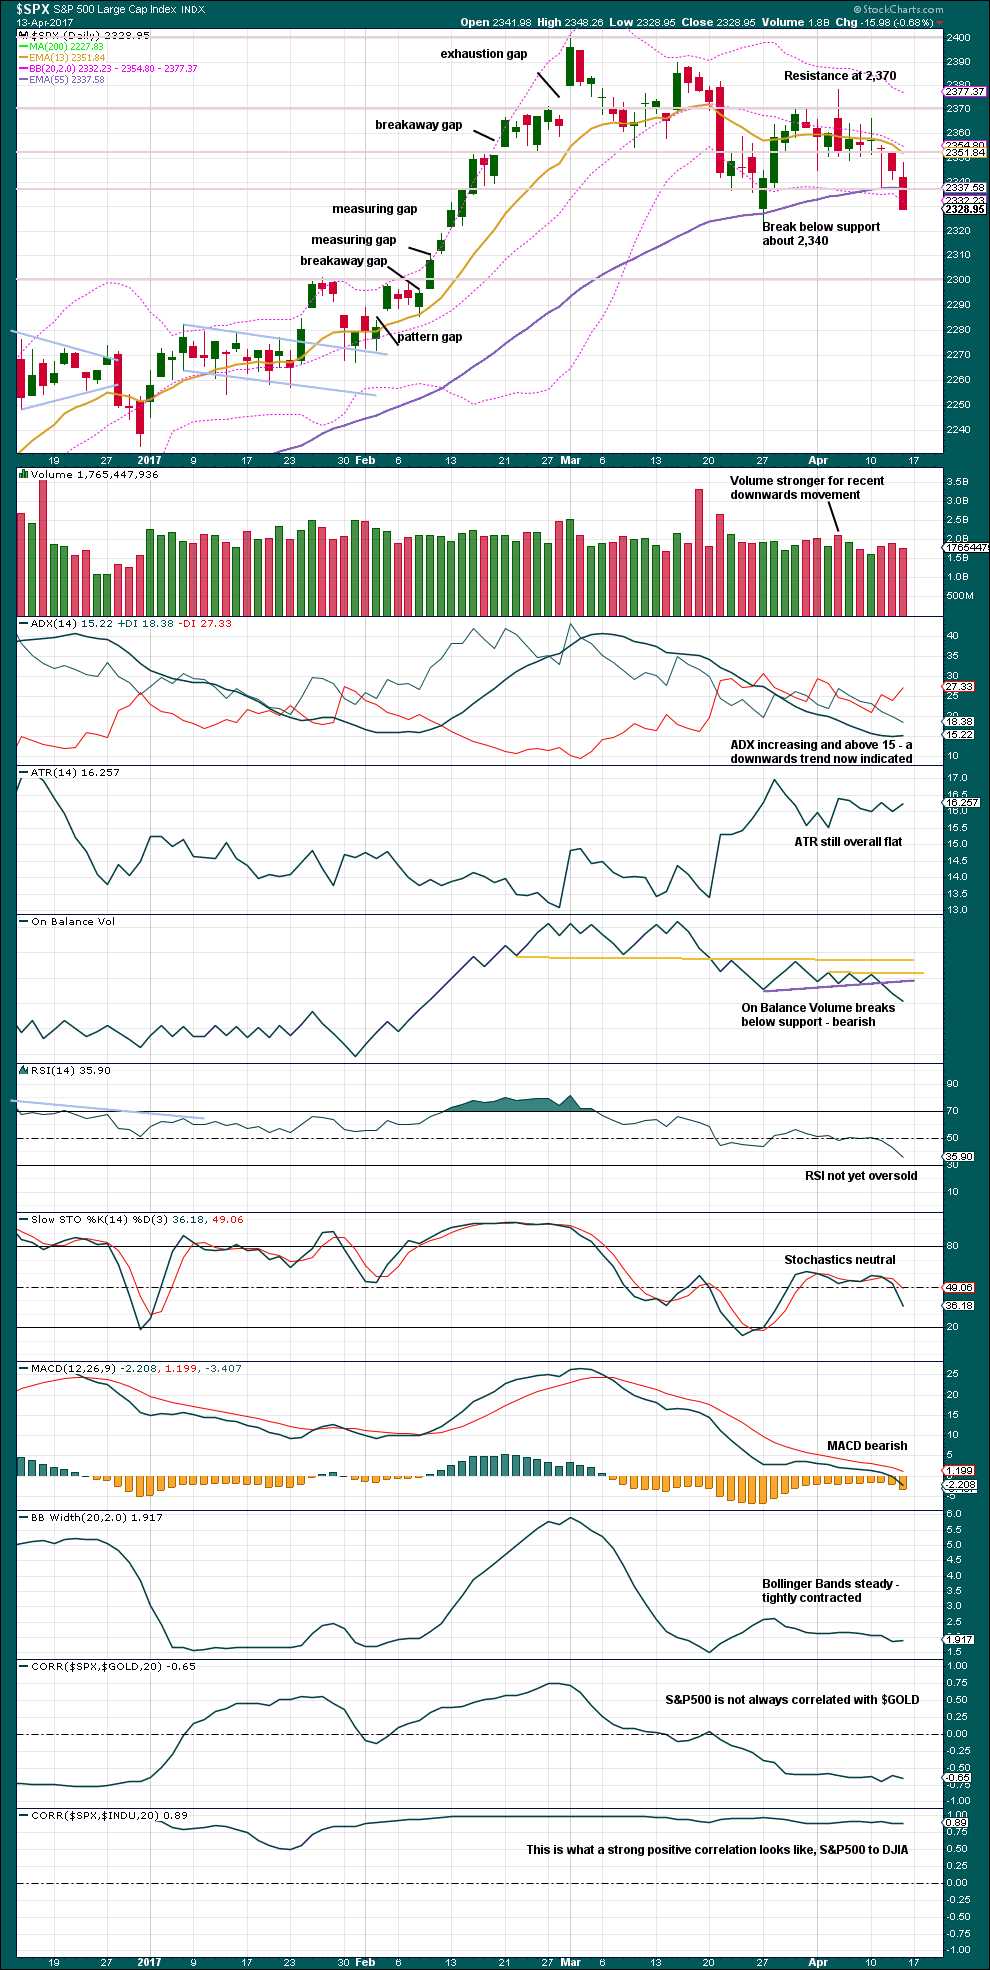
Click chart to enlarge. Chart courtesy of StockCharts.com.
Thursday moved price strongly lower with a small decline in volume. Because this is the day before Good Friday this will not be read as bullish.
The close below prior support is bearish.
ADX is bearish. On Balance Volume is very bearish. MACD is bearish.
RSI indicates there is room for price to fall, as does Stochastics.
Overall, this chart supports the main Elliott wave count.
VOLATILITY – INVERTED VIX CHART
Click chart to enlarge. Chart courtesy of StockCharts.com.
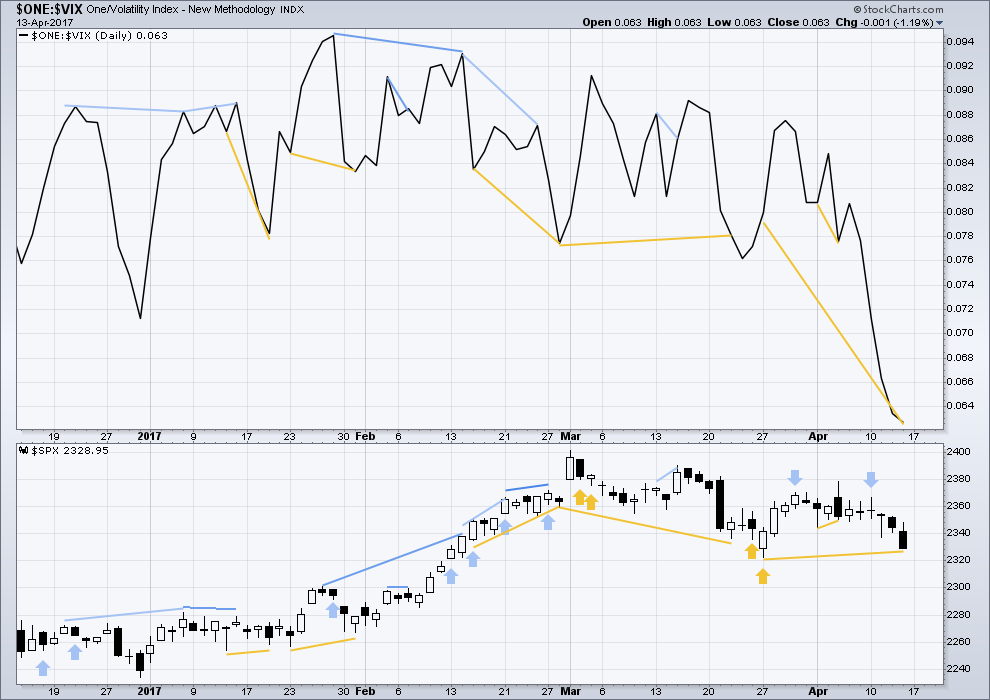
Normally, volatility should decline as price moves higher and increase as price moves lower. This means that normally inverted VIX should move in the same direction as price.
Bearish divergence and bullish divergence spanning a few short days used to be a fairly reliable indicator of the next one or two days direction for price; normally, bearish divergence would be followed by one or two days of downwards movement and vice versa for bullish divergence.
However, what once worked does not necessarily have to continue to work. Markets and market conditions change. We have to be flexible and change with them.
Recent unusual, and sometimes very strong, single day divergence between price and inverted VIX is noted with arrows on the price chart. Members can see that this is not always proving useful in predicting the next direction for price.
Divergence will continue to be noted, particularly when it is strong, but at this time it will be given little weight in this analysis. If it proves to again begin to work fairly consistently, then it will again be given weight.
The mid term bullish divergence between inverted VIX and price is still being followed by downwards movement. It is not correctly predicting the next movement for price. It may disappear shortly.
BREADTH – AD LINE
Click chart to enlarge. Chart courtesy of StockCharts.com.
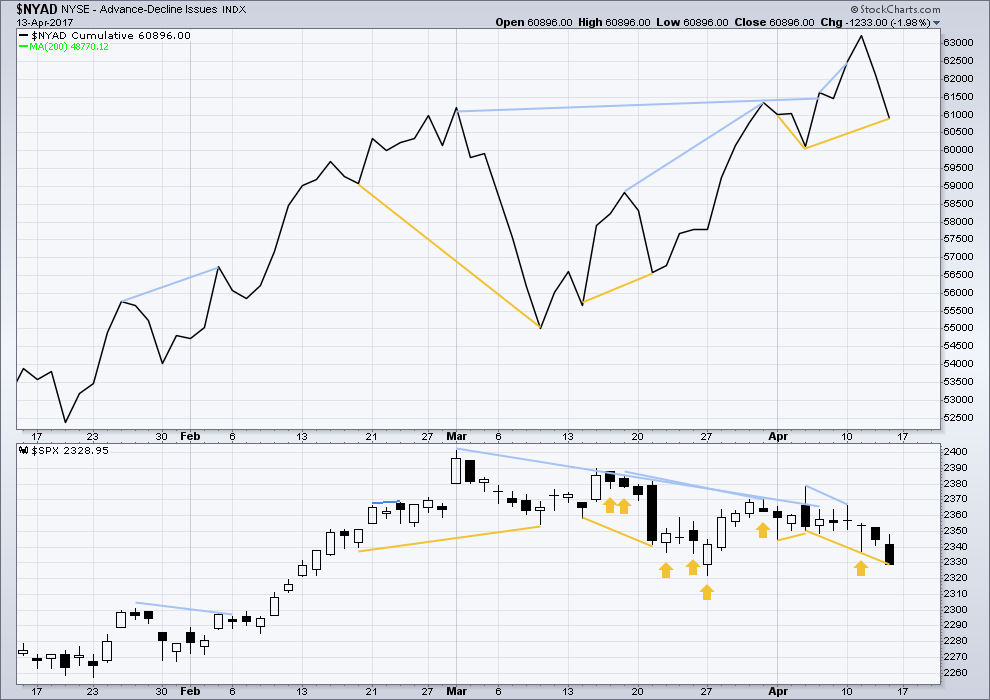
The rise in price has support from a rise in market breadth. Lowry’s measures of market breadth do not at this stage warn of an impending end to this bull market. They show an internally healthy bull market that should continue for at least 4-6 months.
There is new short term bullish divergence between price and the AD line from the low of the 5th of April to the 13th of April: price has made a new low, but the AD line has failed to make a corresponding new low. This is regular bullish divergence and supports the alternate Elliott wave count.
DOW THEORY
The DJIA, DJT, S&P500 and Nasdaq continue to make new all time highs. This confirms a bull market continues.
This analysis is published @ 04:27 a.m. EST on 15th April, 2017.
Maybe this? Now for both of the hourly charts this latest downwards movement looks wrong.
Here subminuette iii doesn’t look right.
I need to work on this some more this morning. But before the close this is my first idea.
I’d expect resistance here at the upper edge of the Elliott channel anyway.
It looks as if price coming back to underside of 50 dma at around 2053.00
2353?
As expected, a pretty good pop today via intraday market ramp but no clue from futures trading. Probably pointless paying any attention to what they do overnight. Let’s see if the indices retake 50 dma tomorrow or find stiff resistance there. Hasta!
I don’t even know what to say about today. Every time I think markets would drop, banks would save the day.
VIX bouncing along support at 15.00. A break below means the upward move goes a little higher. I still expect a fade into the close….
UVXY hinting we are in a counter-trend bounce today. Look for filling of gap from Thursday’s close at 21.22 for confirmation of more downside. An SPX break of March 27 low could lead to our long-awaited vol spike. We had a significant one leading up to P2’s conclusion on June 27 last year, so it is reasonable to expect one for P4.
Cashed in UVXY 21 puts bought on Thursday.
Bought UVXY 21.50 calls expiring this week-end @ 0.80 per contract.
Ominous development!!
I always wondered how the banksters would go about screwing the retail investor during the next market implosion and know I know. Exchange fees are going from a few dollars a month to 9,000.00…. for EVERYBODY!!!
I was expecting arbitrary cessation of trading but they have gone one better.
UNBELIEVABLE!!!!!!
We must be closer to a market crisis than most understand.
https://www.sec.gov/rules/sro/nms/2017/34-80300.pdf
geez….that’s gnarly
Thank you Lara!
Why am I finding the alternate now to be so attractive?
That dump into the close on Thursday was just way too cute.
Let’s see if futures take a moon shot on Sunday evening.
I am wondering about a larger ABC for the fourth wave (main count) with a C of a possible intermediate B up still to come to draw in a few hapless bulls, then intermediate C of P4 down to conclude the correction…just thinking out loud.
The measured rise for VIX out of the falling wedge is about 20 so I don’t think it is quite done yet..
That SPY 232/SPX 2320 level is looking delicious for a large bounce.
Hee hee. First again.
Rats! 🙂
Just jesting around. Don’t take it too hard.
BTW, this being Easter season, westerners are more inclined towards the leporine kind, not the rodent variety.
Wascally Wabbit!
Ate all the chocolates!