
Price is still range bound, testing support at today’s low. The breakout will come, and the longer price coils within this range the more violent the breakout may be.
Summary: The main wave count expects an upwards breakout. The alternate expects a downwards breakout. There is a little more support for the alternate, but not enough for reasonable confidence. Divergence today between price and the AD line suggests tomorrow may move price higher.
Because the picture is reasonably neutral, it would be my advice at this time to wait for a price breakout or a signal from On Balance Volume before having confidence in the next trend.
If price can close above 2,370 on an upwards day with an increase in volume, then the target is at 2,455. If price can close below about 2,340 on a day with stronger volume, then the target is a range of 2,282 – 2,234.
New updates to this analysis are in bold.
Last monthly and weekly charts are here. Last historic analysis video is here.
MAIN ELLIOTT WAVE COUNT
WEEKLY CHART
Click chart to enlarge.
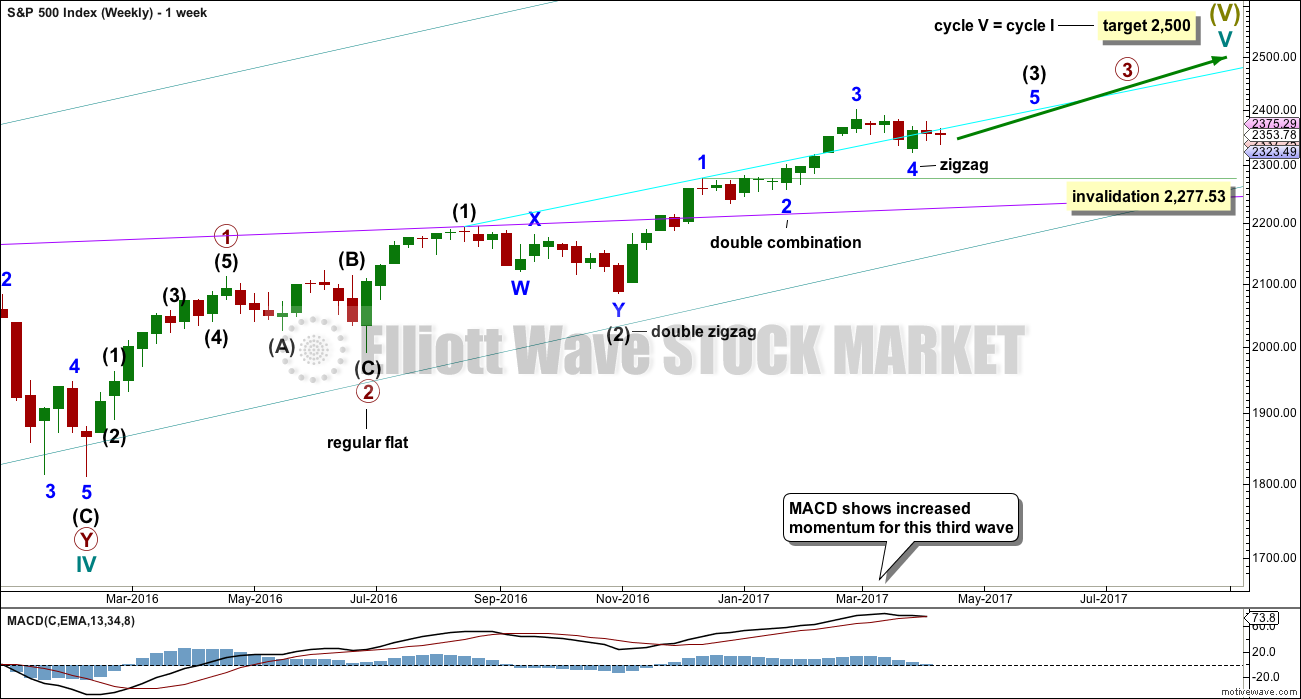
Cycle wave V is an incomplete structure. Within cycle wave V, primary wave 3 may be incomplete.
Within primary wave 3, intermediate wave (3) may be an incomplete impulse.
Within intermediate wave (3), if minor wave 4 continues, then it may not move into minor wave 1 price territory below 2,277.53.
DAILY CHART
Click chart to enlarge.
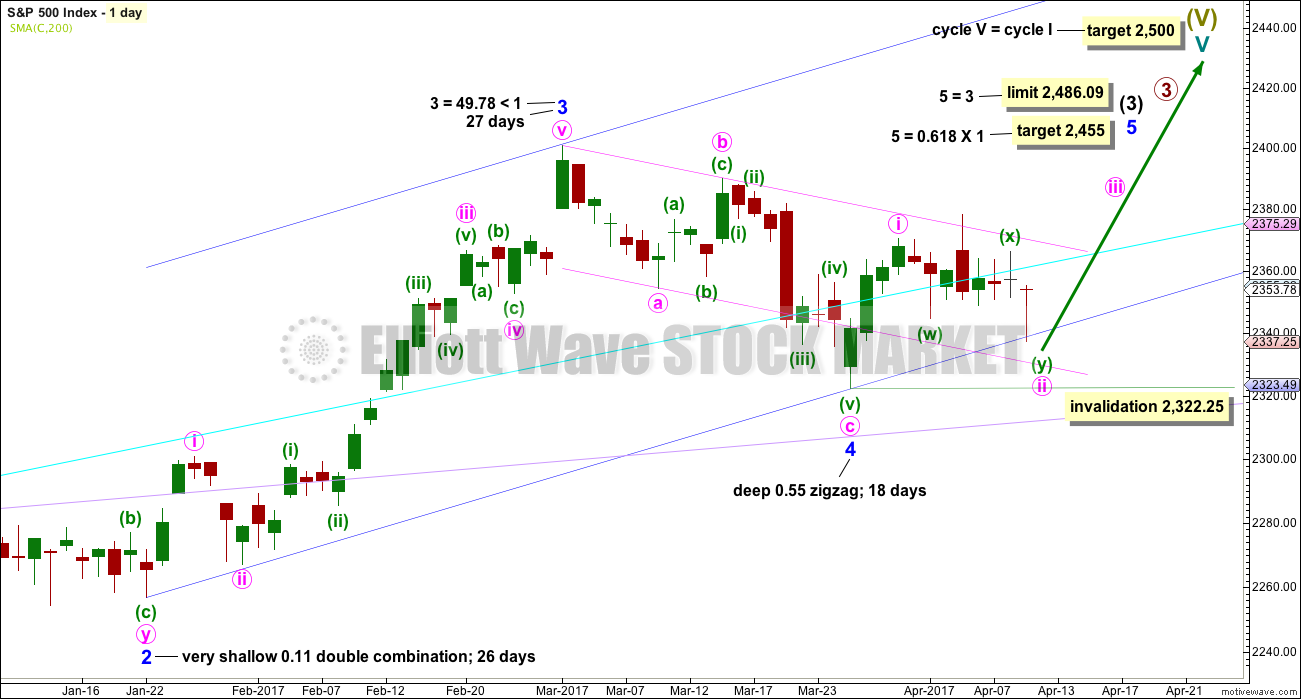
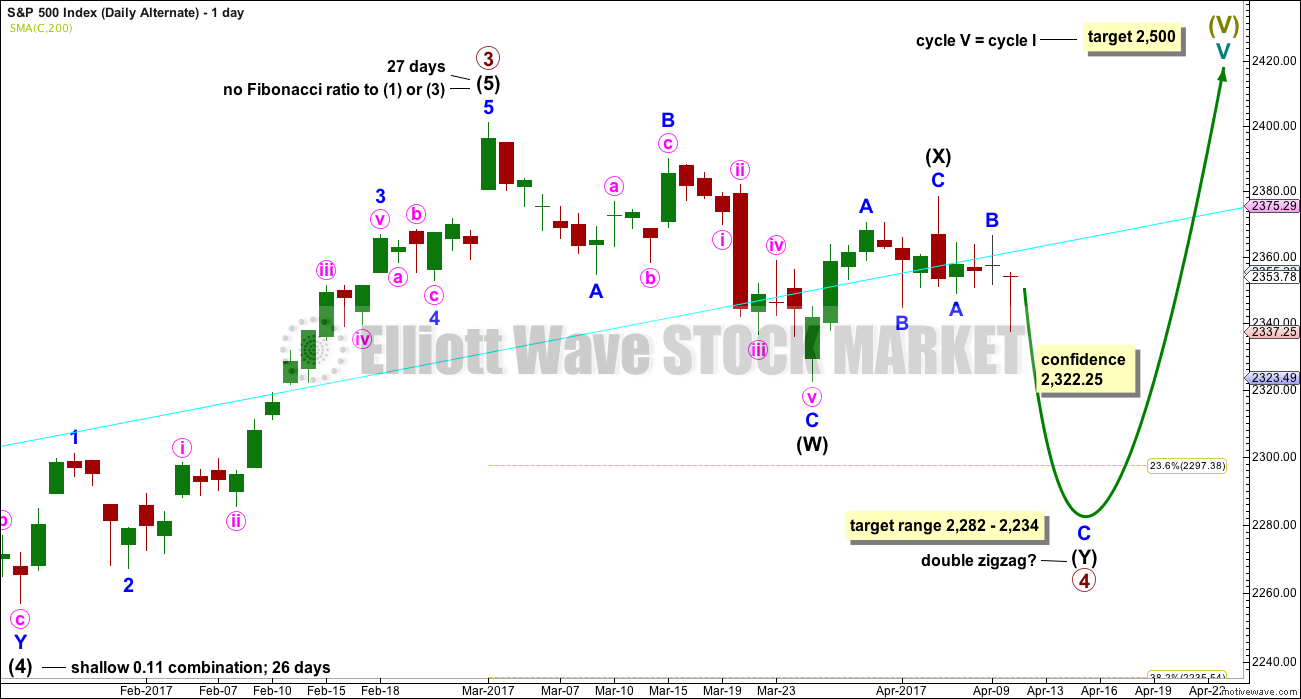
This wave count expects the just completed correction is minor wave 4. Within minor wave 5, minute wave ii may not move beyond the start of minute wave i below 2,322.25.
Minor wave 4 is a little below the fourth wave of one lesser degree. Because it has now clearly breached an Elliott channel drawn using the first technique, the channel is now redrawn using Elliott’s second technique. There is good alternation between the very shallow combination of minor wave 2 and the deeper zigzag of minor wave 4.
A target for minor wave 5 is calculated.
The Elliott channel about minor wave 4 is drawn on the daily chart. The upper edge may be providing some resistance. Once price can break above this channel, then upwards momentum may build.
Minor wave 3 is shorter than minor wave 1. So that the core Elliott wave rule stating a third wave may not be the shortest is met, minor wave 5 is limited to no longer than equality in length with minor wave 3.
HOURLY CHART
Click chart to enlarge.
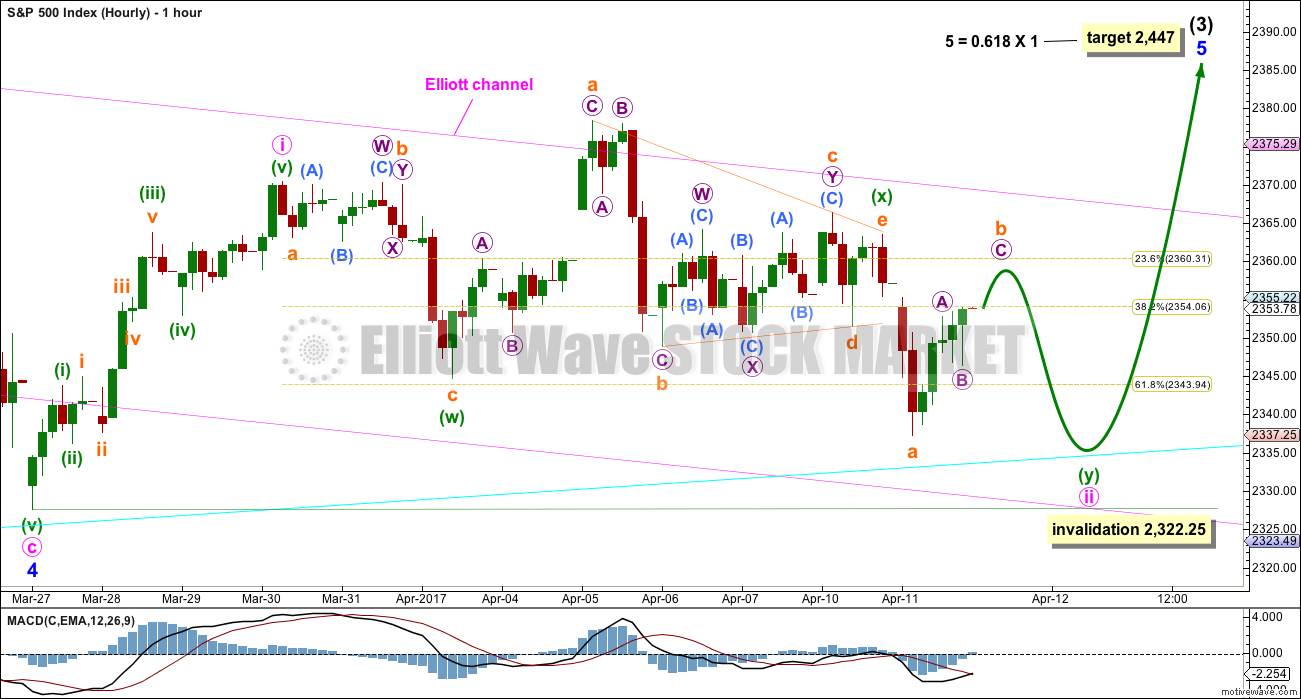
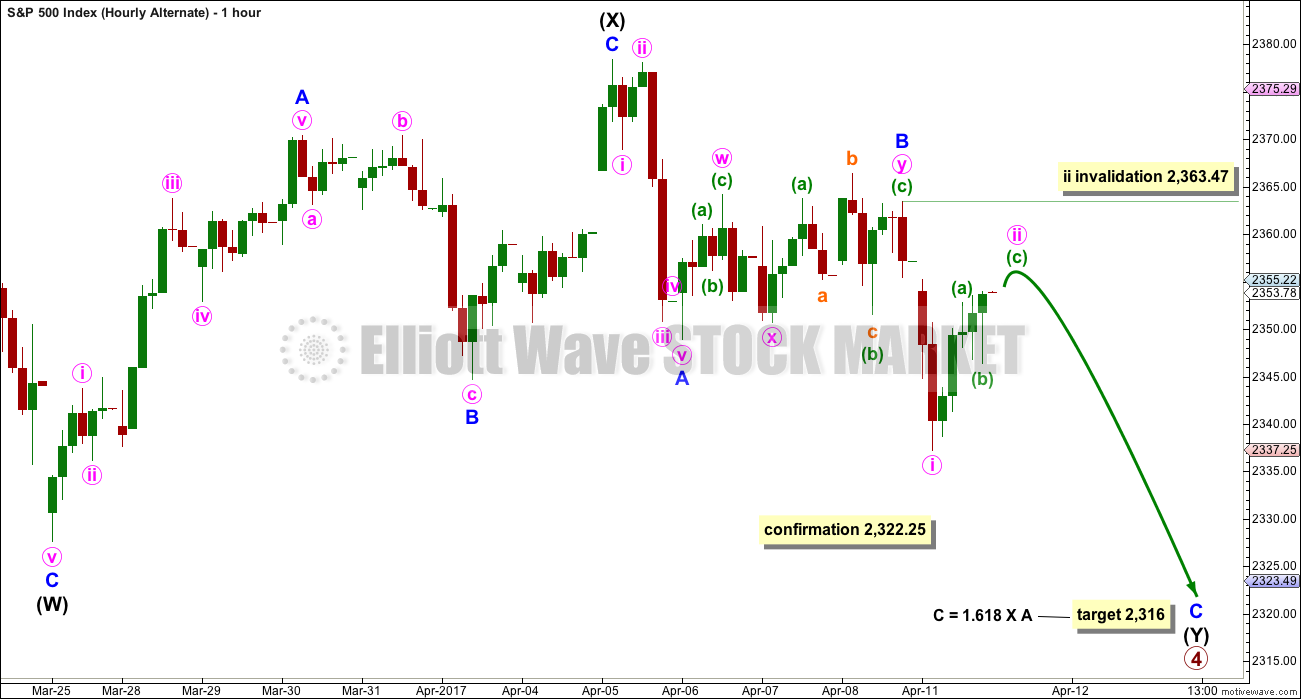
Minute wave ii may be an incomplete double zigzag, with minuette wave (x) now a completed running contracting triangle. While part of the triangle makes a new price extreme beyond the start of minuette wave (w), at its end the triangle effects a 0.73 retracement of minuette wave (w). This is not a typical look for an X wave within a double zigzag as they are more often brief and shallow.
Minute wave ii may continue sideways as a double combination. Minuette wave (y) may be a flat correction.
Yesterday’s target has been met and slightly exceeded. A new target cannot yet be calculated until subminuette wave b within the zigzag of minuette wave (y) is complete. Then the ratio between submineutte waves a and c may be used to calculate a target.
It is possible that subminuette wave b may make a new high above the start of subminuette wave a at 2,363.47 if minuette wave (y) unfolds as a flat correction and minute wave ii unfolds as a combination.
Minute wave ii may find strong support at the lower edge of the pink Elliott channel copied over from the daily chart, if it moves below the target.
Minute wave ii may not move beyond the start of minute wave i below 2,322.25.
Essentially, this wave count expects a continuation of the consolidation for another one to few days, then an upwards breakout.
ALTERNATE ELLIOTT WAVE COUNT
WEEKLY CHART
Click chart to enlarge.
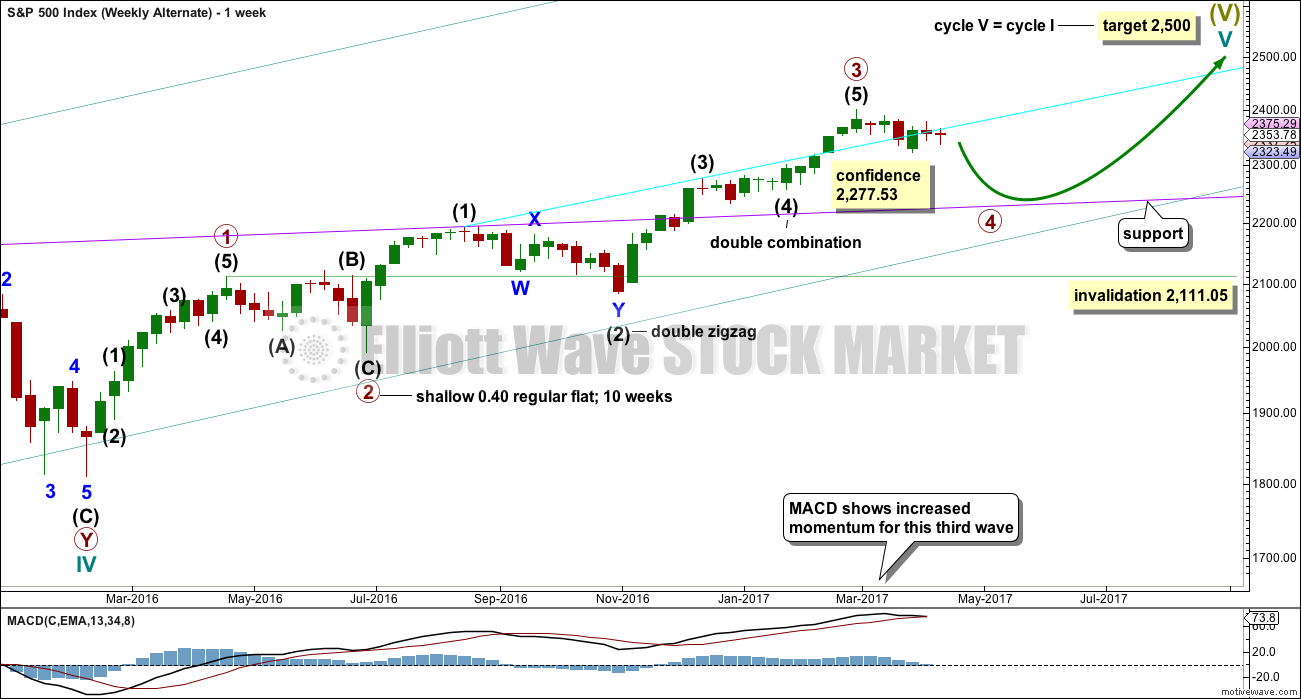
The degree of labelling within primary wave 3 is here moved up. It is possible that primary wave 3 may be over.
Primary wave 4 may continue lower.
To exhibit alternation with primary wave 2, primary wave 4 may be most likely a single or multiple zigzag. It may also be a triangle.
Primary wave 2 was a flat correction lasting 47 days (not a Fibonacci number). Primary wave 4 may be unfolding as a double zigzag. It may total a Fibonacci 34 or 55 sessions.
Primary wave 4 may not move into primary wave 1 price territory below 2,111.05.
DAILY CHART
Click chart to enlarge.
Within double zigzags, the X wave is almost always brief and shallow. There is no rule stating a maximum for X waves, but they should not make a new price extreme beyond the start of the first zigzag in the double.
X waves within combinations may make new price extremes (they may be equivalent to B waves within expanded flats), but in this instance primary wave 4 would be unlikely to be a combination as it would exhibit poor alternation with the flat correction of primary wave 2.
For this alternate wave count intermediate wave (X) may now be complete. Both wave counts expect downwards movement: this alternate wave count to new lows for a second zigzag, which would be labelled intermediate wave (Y), and the main wave count for a brief pullback labelled minute wave ii. How low the next wave goes should indicate which wave count is correct. A new low now below 2,322.25 would see the main wave count discarded in favour of this alternate.
If a new high above 2,400.98 is seen, then this alternate would be discarded.
The correction for primary wave 4 should be a multi week pullback, and it may not move into primary wave 1 price territory below 2,111.05.
HOURLY CHART
Click chart to enlarge.
Because this alternate wave count expects an imminent downwards breakout an hourly chart is provided, so that members have a road map in case that happens.
The second zigzag in the double may be underway. Within the zigzag, a target is calculated for minor wave C to end which is just below the expected range for intermediate wave (4).
Minor wave C must subdivide as a five wave structure. If it begins at 2,363.47 (assuming my analysis of minor wave B is correct), then minute wave ii may not move above this point.
TECHNICAL ANALYSIS
WEEKLY CHART
Click chart to enlarge. Chart courtesy of StockCharts.com.
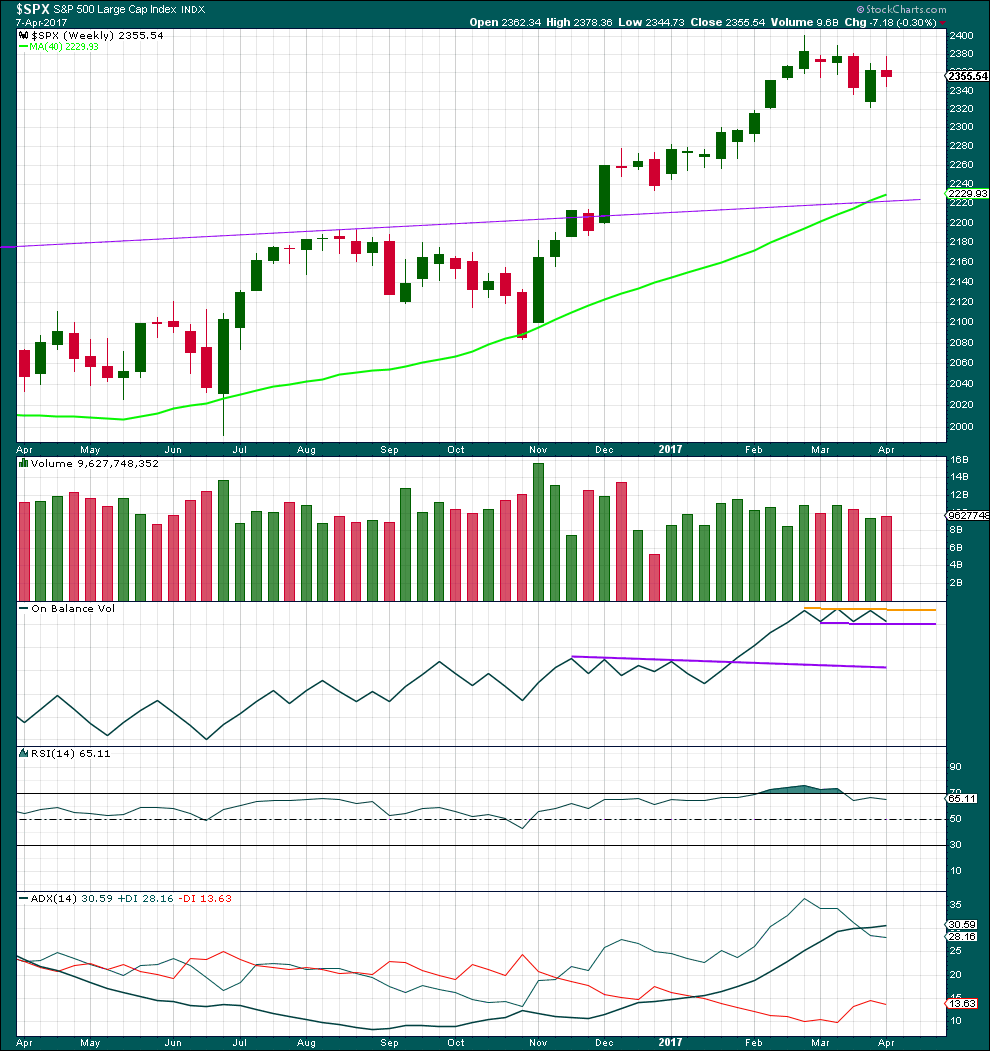
Last week completes an upwards week with a higher high and a higher low, but the week closed red and the balance of volume was down. With some increase in volume last week, the support for downwards movement during the week is bearish.
On Balance Volume remains tightly constrained, not yet offering a signal.
ADX remains extreme. This is most often followed by three or four downwards weeks, but not always. This favours the alternate daily wave count.
DAILY CHART
Click chart to enlarge. Chart courtesy of StockCharts.com.
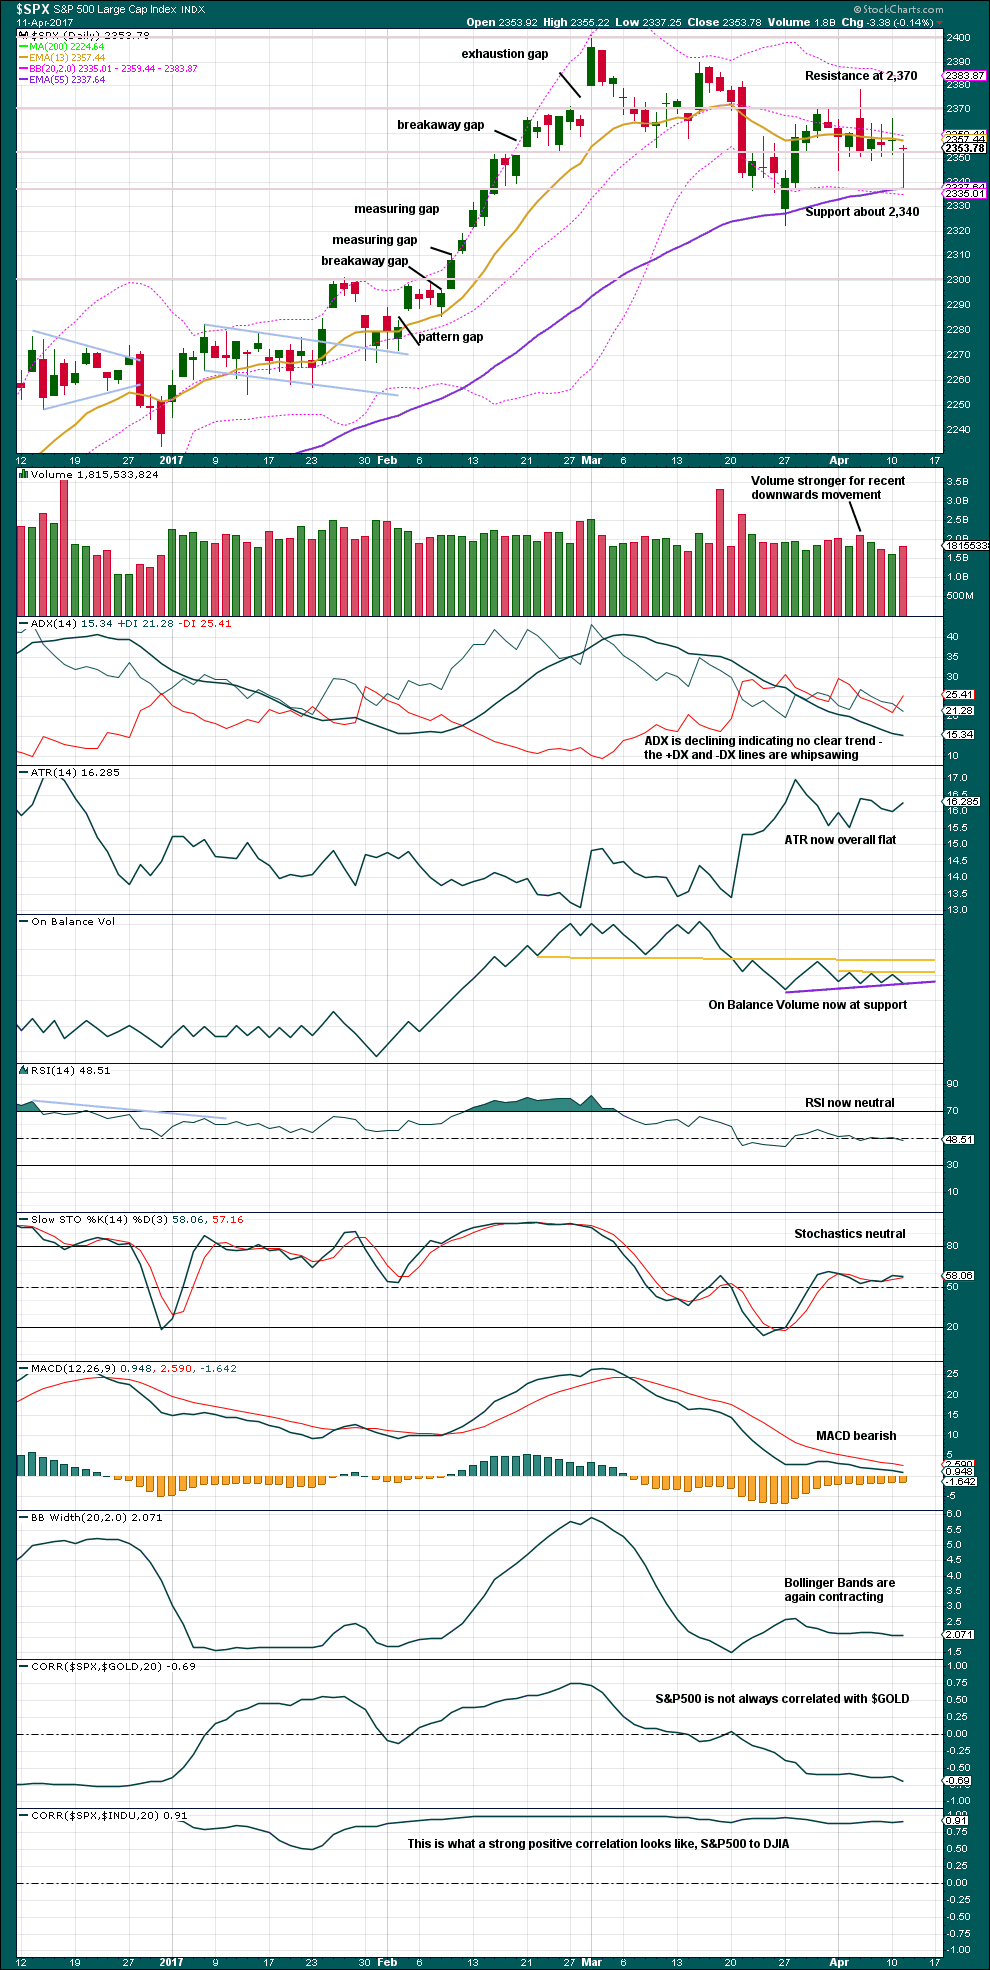
Price remains range bound with resistance about 2,370 and support about 2,340. During this range bound period it remains downwards days which have strongest volume, suggesting a downwards breakout is more likely than upwards.
Bollinger Bands, ADX and ATR agree that price is consolidating.
On Balance Volume at the daily chart level has not yet given a new signal. It is at the new support line while price consolidates. On Balance Volume is also range bound.
RSI and Stochastics are both neutral.
MACD and volume are bearish.
Overall, this analysis is neutral to bearish. It offers a little more support to the alternate Elliott wave count than the main Elliott wave count. The bottom line is price or On Balance Volume need to break out and present a signal before confidence may be had in the next direction for a trend.
VOLATILITY – INVERTED VIX CHART
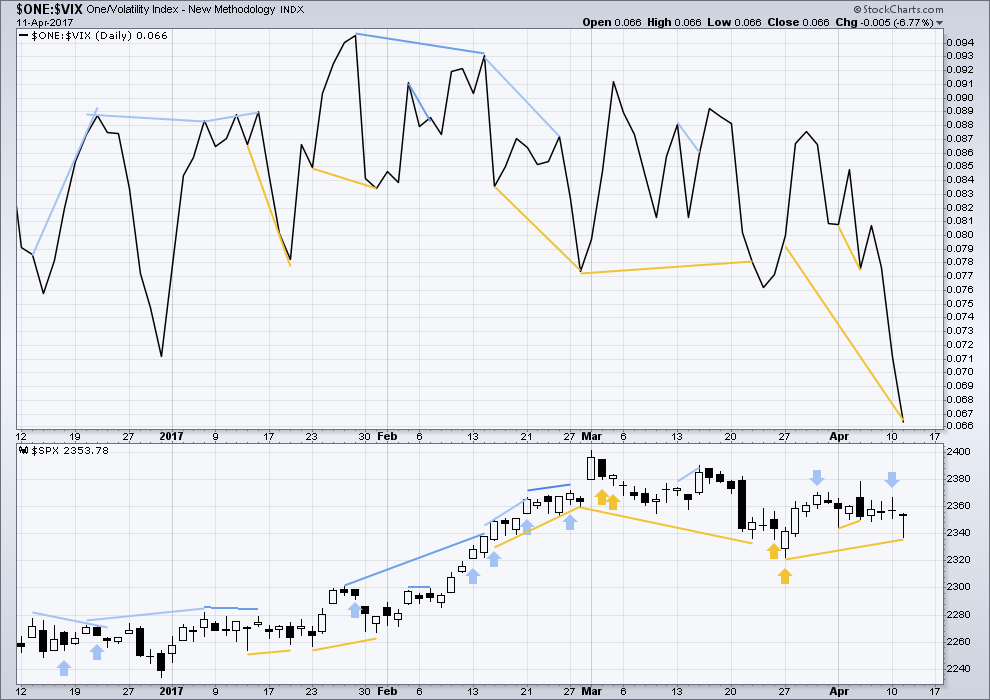
Click chart to enlarge. Chart courtesy of StockCharts.com.
Normally, volatility should decline as price moves higher and increase as price moves lower. This means that normally inverted VIX should move in the same direction as price.
Bearish divergence and bullish divergence spanning a few short days used to be a fairly reliable indicator of the next one or two days direction for price; normally, bearish divergence would be followed by one or two days of downwards movement and vice versa for bullish divergence.
However, what once worked does not necessarily have to continue to work. Markets and market conditions change. We have to be flexible and change with them.
Recent unusual, and sometimes very strong, single day divergence between price and inverted VIX is noted with arrows on the price chart. Members can see that this is not always proving useful in predicting the next direction for price.
Divergence will continue to be noted, particularly when it is strong, but at this time it will be given little weight in this analysis. If it proves to again begin to work fairly consistently, then it will again be given weight.
The strong single day bearish divergence noted yesterday from VIX has now been followed by a downwards day. This divergence may now be resolved, or it may require one more day of downwards movement to resolve it.
There is new mid term bullish divergence between price and inverted VIX: inverted VIX has made a strong new low below the low of 27th of March, but price has failed to make a corresponding new low. This indicates weakness in price.
BREADTH – AD LINE
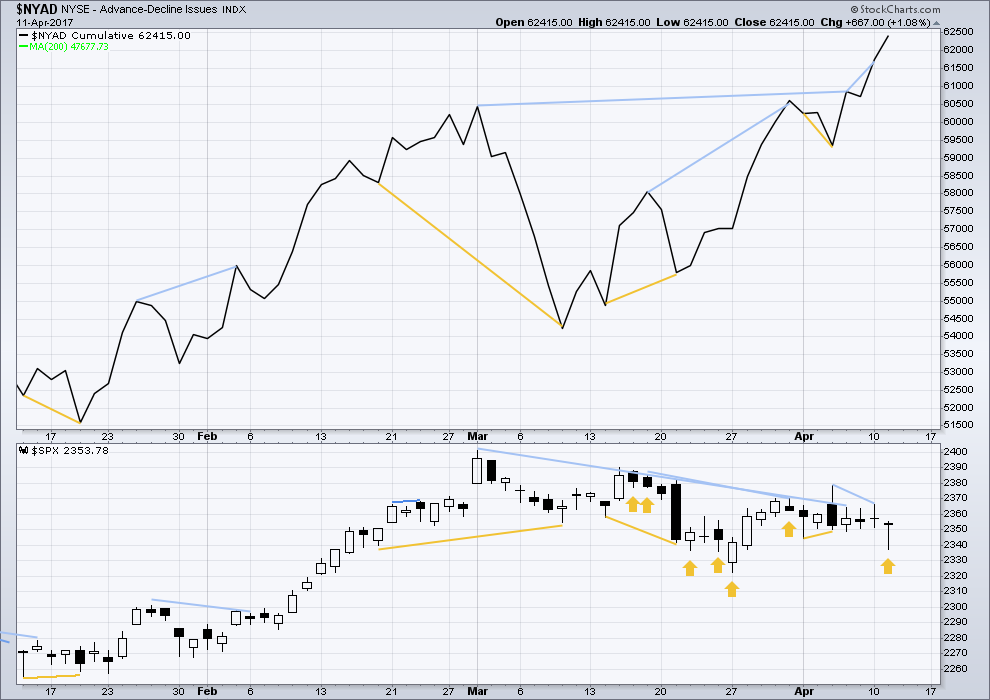
Click chart to enlarge. Chart courtesy of StockCharts.com.
The rise in price has support from a rise in market breadth. Lowry’s measures of market breadth do not at this stage warn of an impending end to this bull market. They show an internally healthy bull market that should continue for at least 4-6 months.
Bearish divergence noted yesterday between price and the AD line has now been followed by one day of downwards movement. It may be resolved here, or it may yet be followed by another day of downwards movement.
There is new single day and strong bullish divergence today with price. The AD line has moved strongly higher while price moved lower. This indicates weakness within price today. It suggests tomorrow may move price higher.
DOW THEORY
The DJIA, DJT, S&P500 and Nasdaq continue to make new all time highs. This confirms a bull market continues.
This analysis is published @ 12:13 a.m. EST on 12th April, 2017.
Im worried now,, surfing in cyclones not good,, we have seen this before,, remember Dorothy in wizard of oz? Laras probably going to end up in Kansas.
LOL
Sorry Doc, can’t be helped. Off to search for waves now… Cyclone Cook has bought massive swells!
But I’ll be finding something a bit smaller and easier for my longboard to handle….
Kansas, here I come! Woo hoo!
Another yawn inducing day, another triangle?
This market is like watching paint dry lately.
Subminuette b could yet morph into a combination. For now, I’ll label it as a triangle.
Then submineutte c downwards. This is the 9th day for minuette ii. The next Fibonacci number is 13, it may end at the end of next week.
NYSE is closed for Easter, no data for S&P via BarCharts to analyse when that happens, so next analysis will be the last until after Easter.
Cyclone Cook is just offshore… due to hit us 9am to 3pm today. Bringing a massive swell! Woo hoo!
There is a lot of talk about imminent war.
It is really looking like the US is talking to the other major players about taking action against North Korea and it could happen this weekend.
For the last few months I have been commenting on the historic VIX compression and wondering what form a violent return to the mean would take. The class of subs Trump has sent to the peninsular are packing 150 tomahawks apiece and he has sent four of them. That is a lot of persuasion.
What could propel volatility from historic lows to historic highs?
War would do it. Yep, war certainly would shake the market out of its complacency.
Oh my…..
There’s rather a lot I would like to say here, but for our US members I’ll be diplomatic.
Starting a war with a mad dictatorship with nukes? Not a good idea. That could lead to nuclear WWIII. This isn’t going to make the world safer, quite the opposite.
I really do wish they’d read some history books. And learn to mind their own business. All of them.
Too many idiots with too much power. Too dangerous for those of us who want peace 🙁
Amen!
You can probably tell I am biting my tongue…. 🙂
Having a senior moment here. Will a Spy weekly expiring the 13th trade tomorrow or expire at midnight tonight? Thanks!
My guess would be it would end at midnight tonight….
But I don’t trade futures so I’m probably not the best person to ask.
Verne?
It should trade until the close tomorrow. I am holding a few myself. 🙂
Oops! Thanks Verne!
🙂
Thanks guys. I’m always in and out of those before exp so during the last hour I started second guessing myself.
will trade till close tomorrow (4:15 EST pm). Futures close 15 mins after market closes.
Price action in volatility suggesting that smart money cautiously hedging as there is clearly some accumulation going on- steadier than I have ever seen it. There is however, absolutely no panic as positions are also as clearly not being unwound. I repeat, there is no panic…but there will be…(says Yoda)…there will be…panic they will!!! 😀
The coiling is pretty exciting. Whichever direction it breaks it should have some momentum behind it.
Rattle…rattle…rattle.. 🙂
Here is a rhetorical question to alleviate the boredom while we wait.
How does a “managed” decline end when there are no more buyers and everyone is already in?
Rhetorical indeed….Oil’s move is looking spicy.
Waiting for Oil to break out of a small channel…. then to enter short. So far it’s candlestick is looking nicely bearish with a long upper wick.
I am eyeing that chart as well. USO 11.50 puts expiring next week looking ripe for the picking.
Futures hinting we make get a break to the downside in markets tomorrow. Considering what VIX has been doing, I am stunned at the absence of selling pressure in the market. This looks to me like the frog in the slowly heating pot syndrome. I have a feeling we could be setting up for a “BM” (Black Monday).
I’ll bite and answer your rhetorical question Verne.
If no one’s buying then the market is like this.
Love the expression in those eyes!! 🙂 🙂 🙂
I am surprised that Doc did not chime in with that other famous meaning of BM, quipping in a real sense they are both the same…Black Mondays are after all known to induce their counterpart initials namesake! he! he!
meep meep
Sometimes there will be an upside head-fake out of these triangles before price quickly reverses and heads back down to continue the prior trend…
I bought $240 calls and $230 puts out of pure boredom.
The banksters and bots are tirelessly trying to buy the dips in this market. Despite the claims of some talking heads I see NO selling pressure whatsoever therefore the market is falling without their permission and in fact in spite of their opposition. I think we have the makings of a dramatic unwind as the delusion of the perpetual BTFD calvary coming to relieve the leverage longs of having to exit their positions dawns on those so afflicted. As aggravating as it is, there is something to be said for a train wreck that takes place in slow motion…. 🙂
VIX appears about to do something I have never seen before, namely, print a green candle with a body entirely outside the upper BB, then continue higher without a reversal. It could be signaling a significant spike ahead if it does not reverse below the upper band by the close…something’s afoot!
I am beginning to think this market is gong to break down and break down hard. It would not surprise me to see the SPX slice right through 2300 on its way to test 2200. Perhaps the smart money is on VIX right now.
Looks like some kind of B wave triangle entered in a downtrend so I think you are right about the direction of the exit. They are trying to smack down volatility even earlier than the usual 10.00 a.m. rendevouz…lol!
I should have no problems, but just in case, if my internet connection goes down AND the mobile network isn’t working, it may be due to Cyclone Cook about to hit New Zealand.
I’m in a good spot on a hill, so pretty sure I’ll be fine.
Just in case I don’t show up to post a chart before the NY close, you’ll know why.
And yeah, heh heh, first (am I allowed?)
Stay safe!
We have held an all-member conference off channel to determine if you are allowed a ‘first place post position’ (FPPP). It was a close vote. But due to the fact that you are facing a cyclone, you are awarded the FPPP for April 11, 2017. But bear in mind, this does not give you right to FPPP in the future.
Have a good and safe day dear friend.
LOL good one Rodney