
A brief shallow pullback was expected for Friday. Price moved overall sideways meeting the expectation.
Summary: The main Elliott wave count expects a little more downwards movement on Monday to either 2,358 or 2,354. If using this small pullback to enter the longer term upwards trend, it is essential stops are used; ideally, they should be placed just below 2,322.25. Do not invest more than 1-3% of equity on this trade at this time.
There is some concern from classic technical analysis at the end of this week for the main Elliott wave count. ADX at the weekly chart level indicates now the trend is extreme. This is most commonly (not always) followed by a few weeks of downwards movement. On Balance Volume at the daily chart level gives a bearish signal.
The alternate wave count is possible.
New updates to this analysis are in bold.
Last monthly and weekly charts are here. Last historic analysis video is here.
MAIN ELLIOTT WAVE COUNT
WEEKLY CHART
Click chart to enlarge.
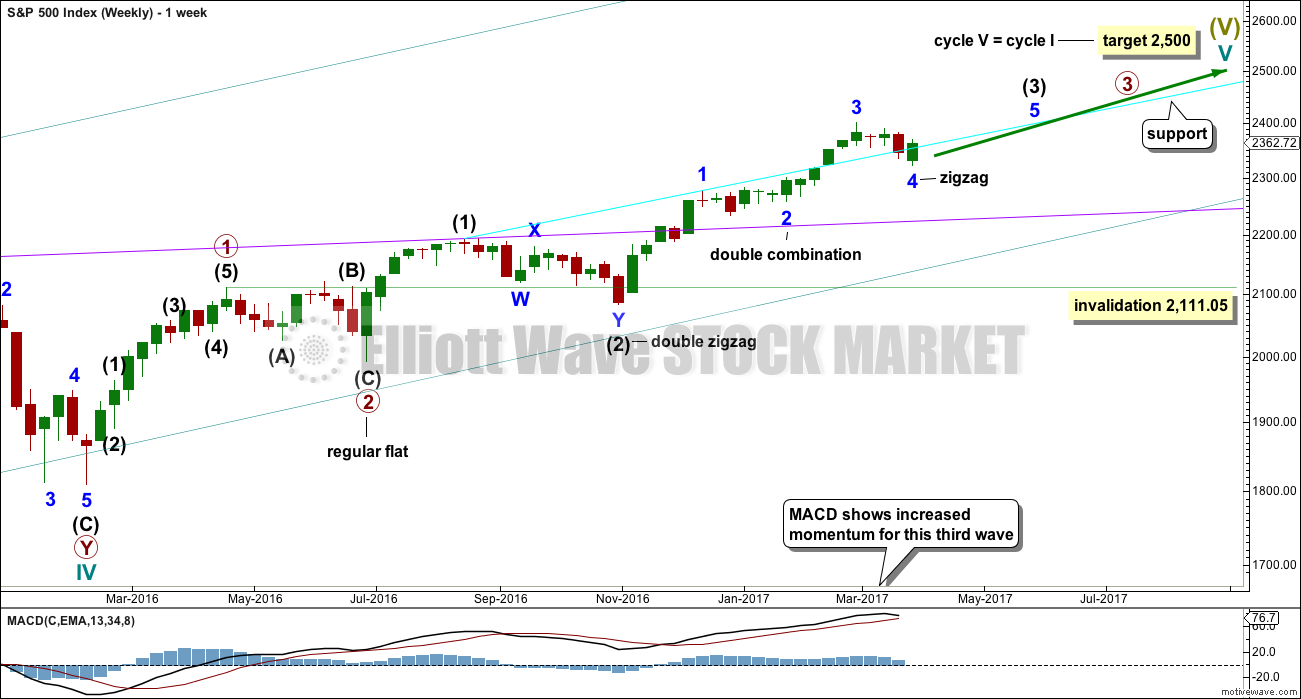
Cycle wave V is an incomplete structure. Within cycle wave V, primary wave 3 may be incomplete or it may be complete (alternate wave count below).
Primary wave 4 may not move into primary wave 1 price territory below 2,111.05.
DAILY CHART
Click chart to enlarge.
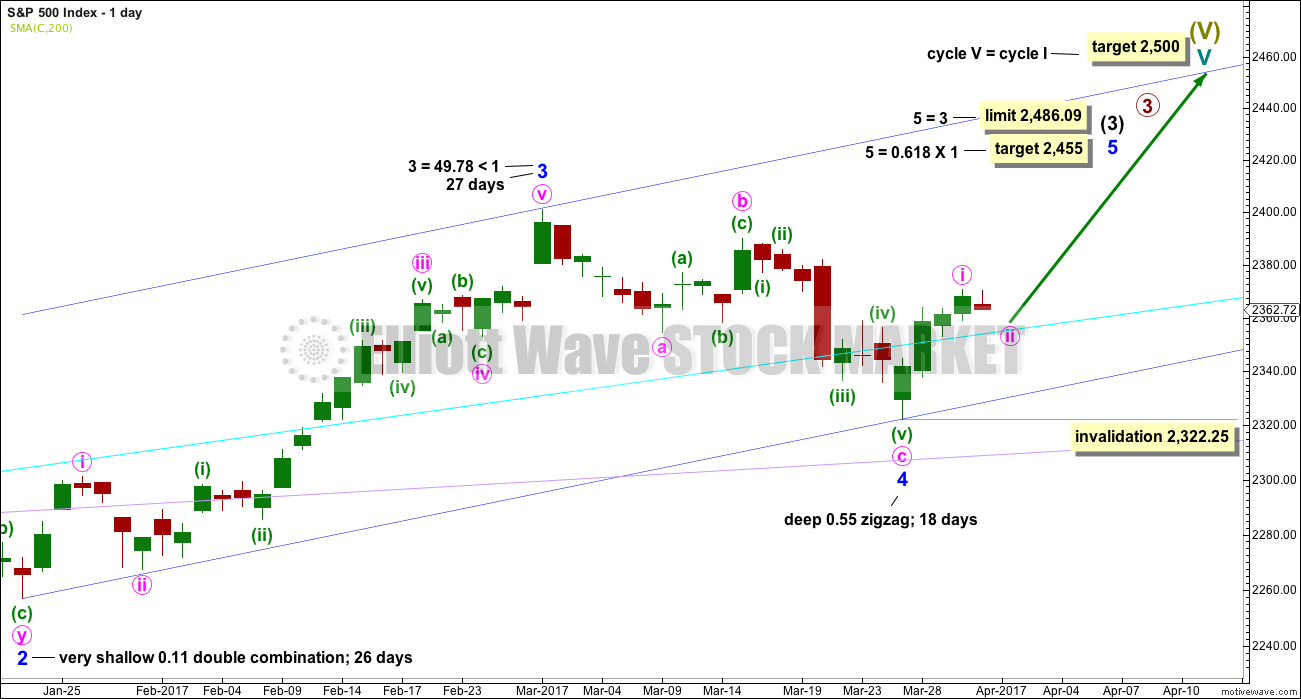
All subdivisions are seen in exactly the same way for both daily wave counts, only here the degree of labelling within intermediate wave (3) is moved down one degree.
This wave count expects the just completed correction is minor wave 4. Within minor wave 5, minute wave ii may not move beyond the start of minute wave i below 2,322.25.
Minor wave 4 is a little below the fourth wave of one lesser degree. Because it has now clearly breached an Elliott channel drawn using the first technique, the channel is now redrawn using Elliott’s second technique. There is good alternation between the very shallow combination of minor wave 2 and the deeper zigzag of minor wave 4.
If minor wave 4 is over, then a target for minor wave 5 is calculated.
The cyan line may now offer some support.
Minor wave 3 is shorter than minor wave 1. So that the core Elliott wave rule stating a third wave may not be the shortest is met, minor wave 5 is limited to no longer than equality in length with minor wave 3.
HOURLY CHART
Click chart to enlarge.
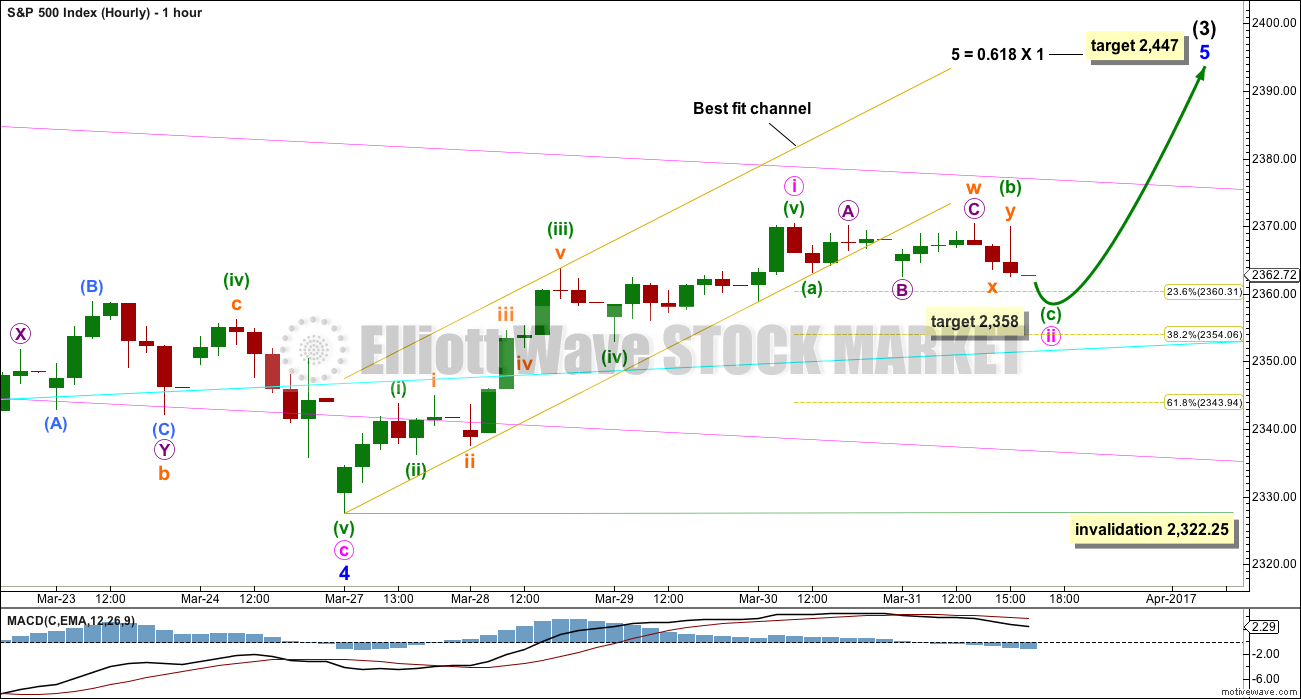
Minute wave i looks complete.
Price has broken below the lower edge of the best fit channel drawn about it and movement since looks like minute wave ii.
Minute wave ii may be unfolding as a zigzag. It looks likely to move a little lower at least to start on Monday’s session; the long upper wick of the candlestick labelled minuette wave (b) is bearish.
Within minute wave ii, the correction for minuette wave (b) looks like a combination: flat – X – zigzag.
If the target is wrong, it may not be low enough. The next target would be the 0.382 Fibonacci ratio at 2,354. This may also coincide with the cyan trend line which may offer support.
When minute wave ii is complete, then some increase in upwards momentum would be expected for minute wave iii.
Minute wave i lasted a Fibonacci three days. If minute wave ii ends on Monday, it may total a Fibonacci two days.
ALTERNATE DAILY CHART
Click chart to enlarge.
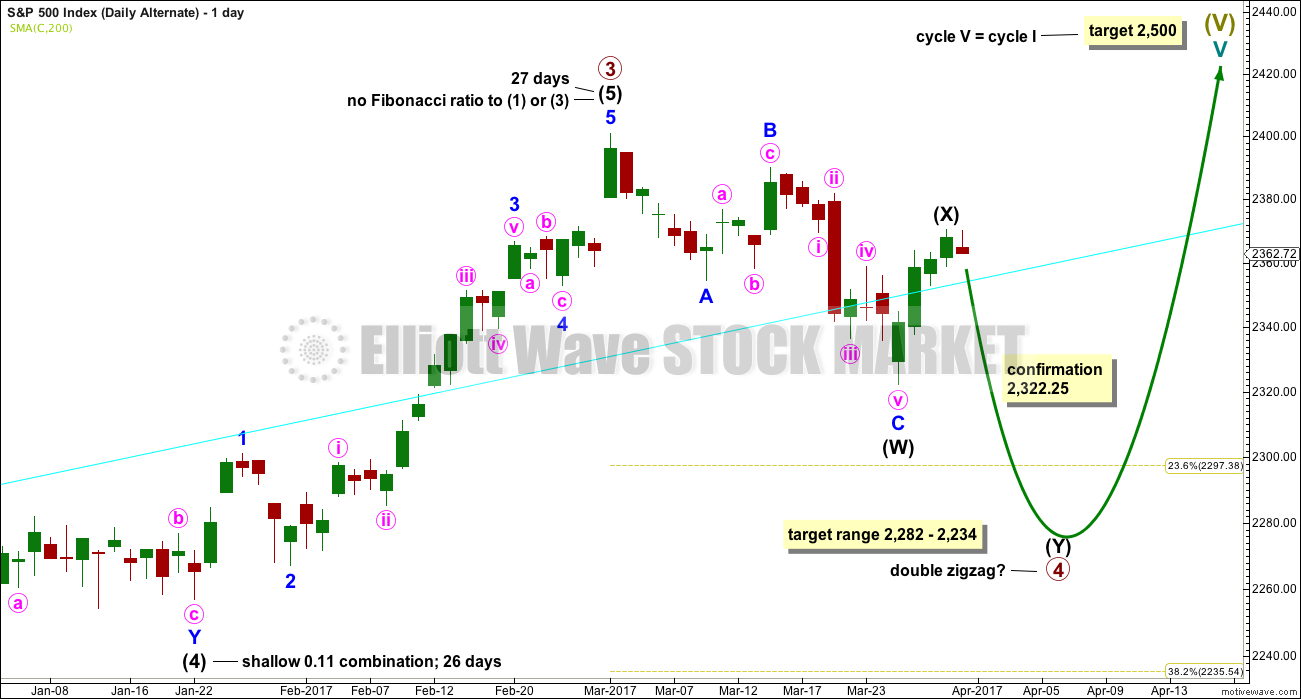
The subdivisions of upwards movement from the end of intermediate wave (2) are seen in the same way for both wave counts. The degree of labelling here is moved up one degree, so it is possible that primary wave 3 could be over.
Primary wave 2 was a flat correction lasting 47 days (not a Fibonacci number). Primary wave 4 may be unfolding as a double zigzag. It may total a Fibonacci 34 or 55 sessions.
Within double zigzags, the X wave is almost always brief and shallow. There is no rule stating a maximum for X waves, but they should not make a new price extreme beyond the start of the first zigzag in the double.
X waves within combinations may make new price extremes (they may be equivalent to B waves within expanded flats), but in this instance primary wave 4 would be unlikely to be a combination as it would exhibit poor alternation with the flat correction of primary wave 2.
For this alternate wave count intermediate wave (X) may now be complete. Both wave counts expect downwards movement: this alternate wave count to new lows for a second zigzag, which would be labelled intermediate wave (Y), and the main wave count for a brief shallow pullback labelled minute wave ii. How low the next wave goes should indicate which wave count is correct. A new low now below 2,322.25 would see the main wave count discarded and this alternate confirmed.
If a new high above 2,400.98 is seen, then this alternate would be discarded.
The correction for primary wave 4 should be a multi week pullback, and it may not move into primary wave 1 price territory below 2,111.05.
TECHNICAL ANALYSIS
WEEKLY CHART
Click chart to enlarge. Chart courtesy of StockCharts.com.
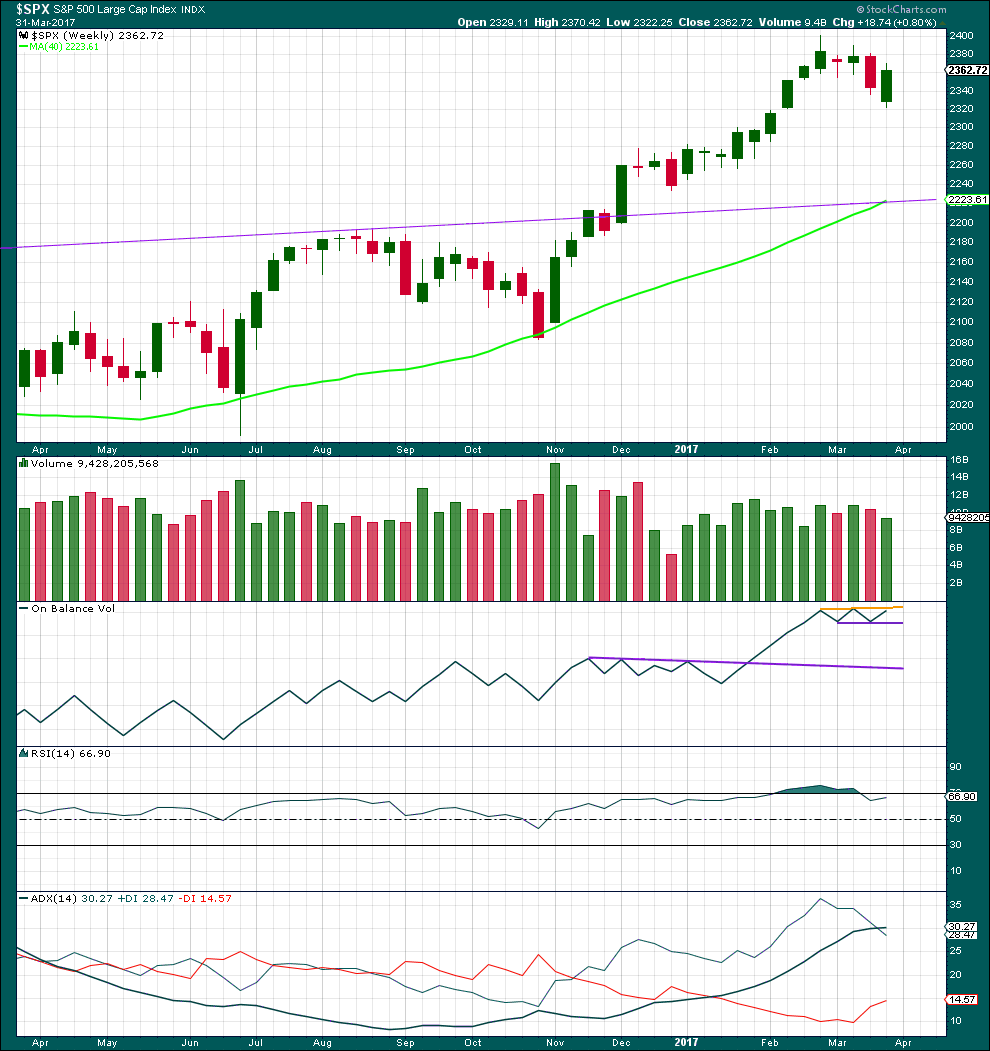
This week completes a downwards week with a lower low and a lower high, but the week closes green and the balance of volume for the week is upwards. Although price has moved lower, the bulls rallied through to the end of the week to push price up above the open. This is bullish.
On Balance Volume now has a small range and it is constrained within. A breakout above or below would be a reasonable signal.
RSI is not overbought. There is room for price to rise.
ADX is now above both directional lines, so the trend is extreme. Looking back over the last 15 years at instances at the weekly chart level where ADX rose above both directional lines, this was most often followed by at least three or four downwards weeks. In one instance in December 2006 it was not, and this was towards the end of a third wave. In that instance, price continued overall higher for several weeks before a reasonable pullback.
ADX at the weekly chart level favours the alternate wave count, but it does not rule out the main wave count.
DAILY CHART
Click chart to enlarge. Chart courtesy of StockCharts.com.
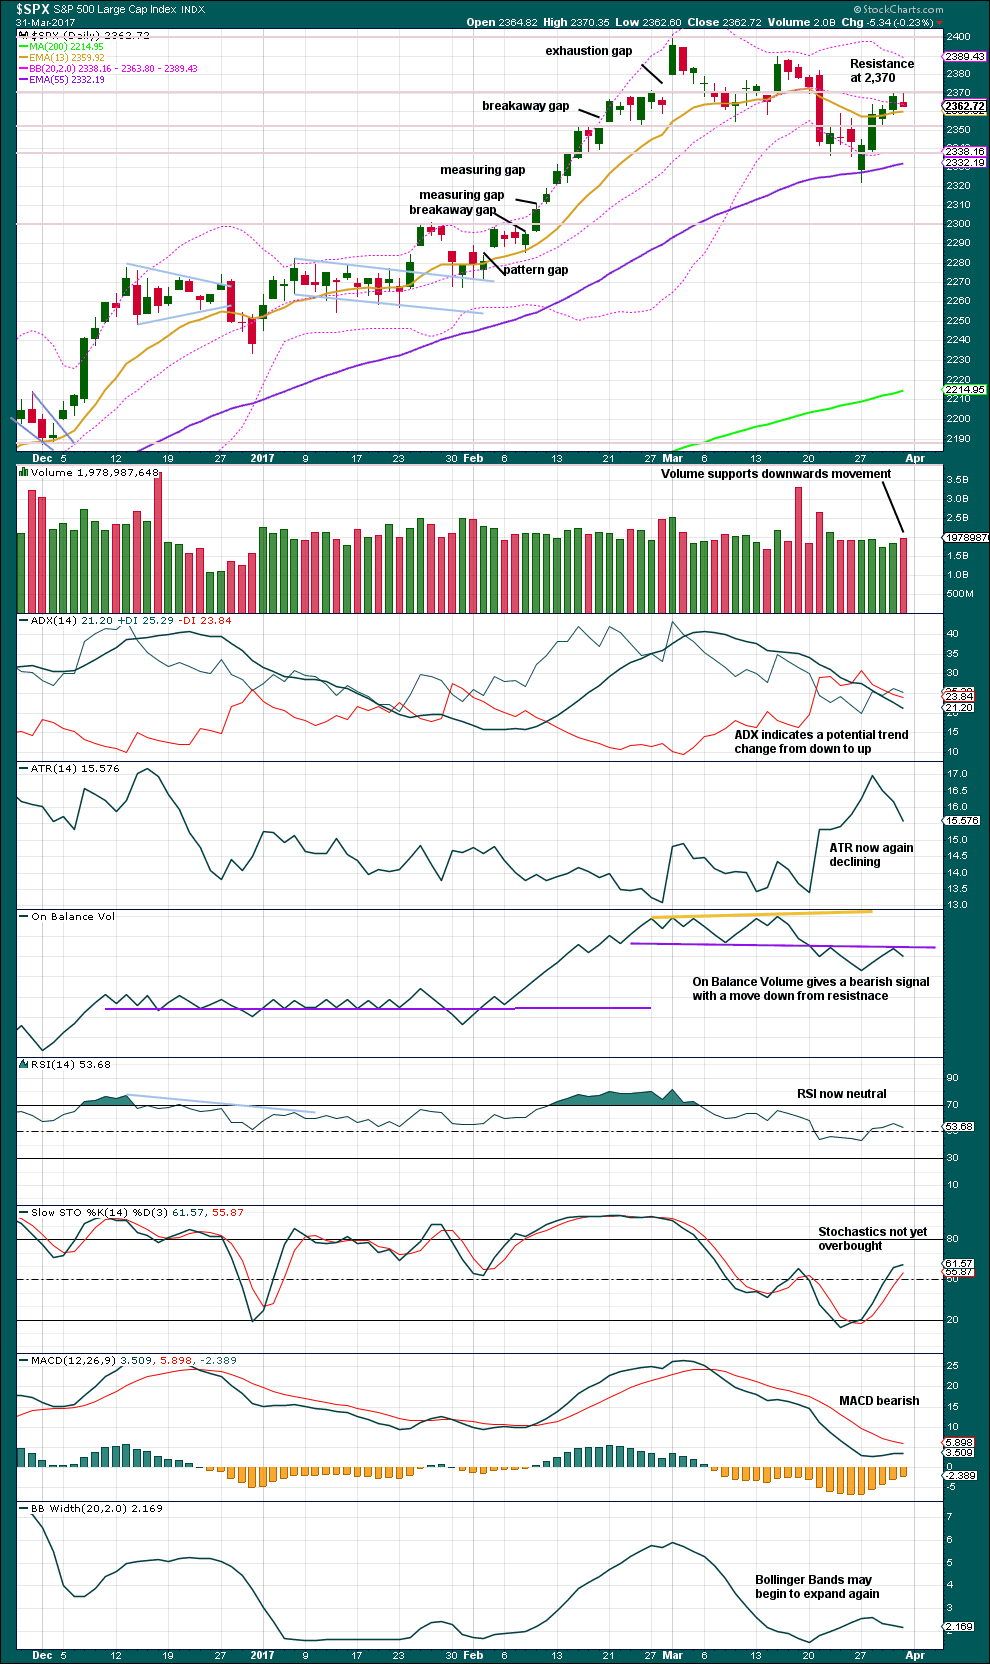
For confidence that the next wave up is underway, On Balance Volume needs to break above resistance at the purple line.
The small red candlestick with a long upper wick is not a Gravestone doji because the real body is too large, but it is fairly bearish. Support from volume is also bearish.
The signal from On Balance Volume is bearish. MACD remains bearish.
ADX, ATR and contracting Bollinger Bands are all neutral. They all indicate a small consolidation and not yet a new trend.
Overall, this analysis is neutral to bearish but does offer a little more support to the alternate Elliott wave count than the main Elliott wave count at this stage.
VOLATILITY – INVERTED VIX CHART
Click chart to enlarge. Chart courtesy of StockCharts.com.
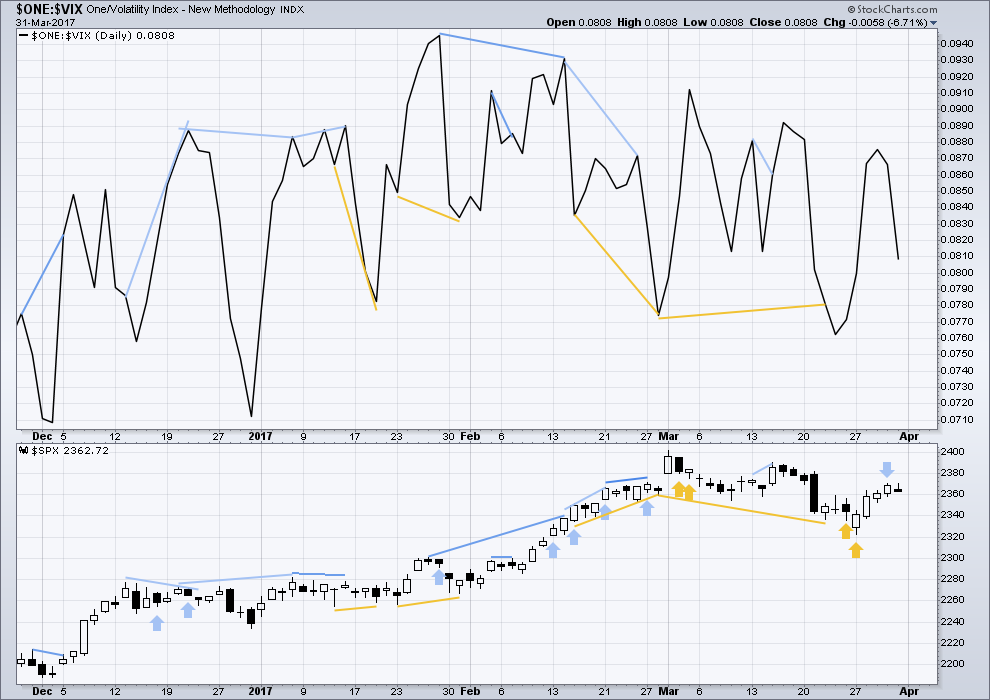
Normally, volatility should decline as price moves higher and increase as price moves lower. This means that normally inverted VIX should move in the same direction as price.
Bearish divergence and bullish divergence spanning a few short days used to be a fairly reliable indicator of the next one or two days direction for price; normally, bearish divergence would be followed by one or two days of downwards movement and vice versa for bullish divergence.
However, what once worked does not necessarily have to continue to work. Markets and market conditions change. We have to be flexible and change with them.
Recent unusual, and sometimes very strong, single day divergence between price and inverted VIX is noted with arrows on the price chart. Members can see that this is not proving useful in predicting the next direction for price.
Divergence will be continued to be noted, particularly when it is strong, but at this time it will be given little weight in this analysis. If it proves to again begin to work fairly consistently, then it will again be given weight.
Bearish divergence noted in last analysis has been followed by a red daily candlestick. This divergence is considered to have been useful in predicting the direction for the following day. It may now be followed by one more downwards day before it is resolved.
There is no new divergence noted today between price and inverted VIX.
BREADTH – AD LINE
Click chart to enlarge. Chart courtesy of StockCharts.com.
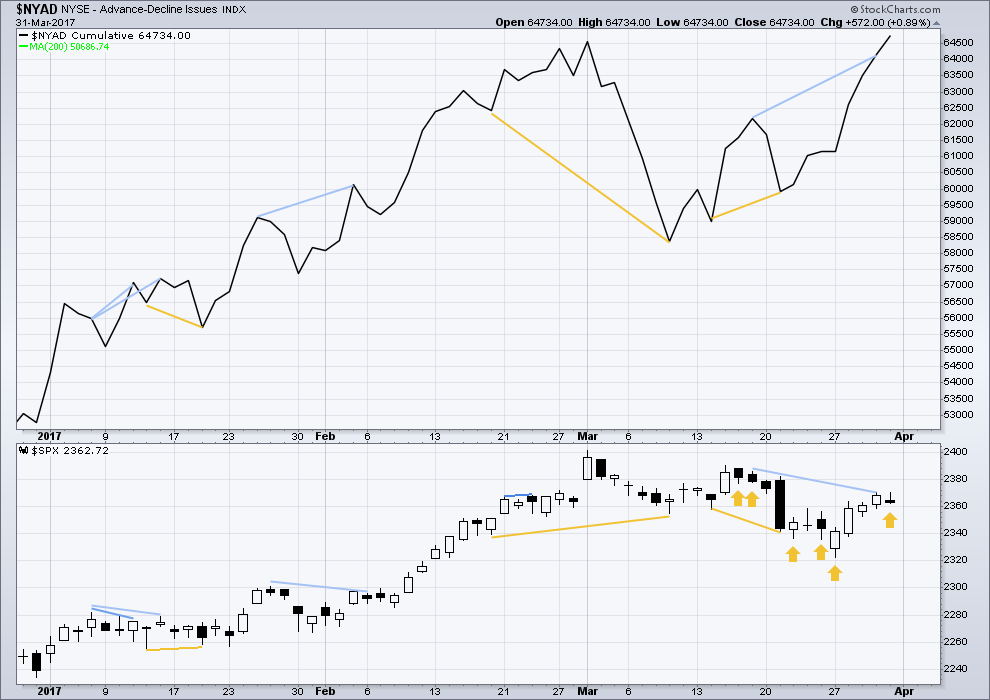
The rise in price has support from a rise in market breadth. Lowry’s OCO AD line also shows new highs along with price. Normally, before the end of a bull market the OCO AD line and the regular AD line should show divergence with price for about 4-6 months. With no divergence, this market has support from breadth.
There is short term bullish divergence between the AD line and price from yesterday’s low to the low of 14th of March (and also back to the 9th of March). Price has not come with a corresponding decline in market breadth while it has made a new low. There is weakness within this downwards movement from price. This supports the main hourly Elliott wave count which sees a low in place.
There is still short term bearish divergence today between Thursday’s high and the high of the 17th of March. This indicates weakness in price and it may be followed by one or two downwards days. This divergence has now been followed by one small red daily candlestick, so it may be resolved.
There is new single day divergence for Friday’s session: price moved overall lower during the session, but market breadth increased. This is interpreted as bullish, but only weak as Friday did not make a lower low.
DOW THEORY
The DJIA, DJT, S&P500 and Nasdaq continue to make new all time highs. This confirms a bull market continues.
This analysis is published @ 11:01 p.m. EST on 1st April, 2017.
It looks like minute ii was deeper than I had expected, ending very close indeed to the 0.618 Fibonacci ratio.
For now I’m going to leave the invalidation point on the hourly chart at the start of minute wave i to allow for minute ii to continue sideways as a double combination or a flat correction. It could do that, so let’s acknowledge that risk.
I have a target for minute iii. The base channel should provide support now for corrections along the way up. Minute iii should have the power to break above the upper edge of the base channel, and when it’s managed to do that then the upper edge should provide support after resistance gives way.
Pretty quiet around here. Everybody holding their breath? Hopefully we found wave 2 so we can breathe again!
Good morning. Yes, it looks like wave 2 is done. Now for a third wave up….
Trading bots continue to short VIX at 200 dma. A punch above that resistance is short to mid-term bearish, essentially any close above 13.50
We could be seeing the alternate. I was originally thinking a C wave down for P4 but I am sure Lara has good reasons for choosing a double zig zag.
Pretty nuts, all these declines have been impulsive for months, and bounces either 3s or rising wedges. Printing presses gotta be running out of ink at some point. The 5 down from open to noon is gorgeous, after that, not so much.
The banksters are in a death spiral. It is taking a long time for them to give up the ghost but give it up they will. The frenzied attemps to arrest every decline tells me they simply cannot afford to let this market fall far from current levels. The only thing I can surmise is the current levels are being sustained by frightful levels of leverage and they have absolutely no room to manuever. This is really a very bad omen. By not allowing the market to correct they are ensuring that it will eventually crash. So far VIX not buying the ramp off this morning’s lows. I am firmly holding short term puts on SPY and remain long volatility.
Methinks that if we break the low 2320ish then what should be a run of the mil 10-20 point correction, primary 4, turns into a collapse. Transports look ugly, as do small cap and high yield. If oil takes a big turn down, the banksters may finally get blown out.
It is more than strange. I have been looking for a C wave down for the last several days and was frankly thinking it would be sharp and deep followed by the start of the final fifth wave up but it just is not happening. The longer this goes on the less likely it is that we are looking at a normal correction and that we will, as you opine, see a total price collapse. Gann says the first leg down in a new bear market after a run-away leg higher is usually about 20%, and a normal correction ahead of new all time highs about 10%. It appears the banksters can afford neither! 🙂
They are burning an awful lot of moolah keeping prices aloft intraday. I suspect where they are finally going to get smoked is overnight futures. The absence of sellers has been striking, so it will be interesting to see of the tug-of-war moves to the futures market. If the banksters get whacked there, we are gong to have one helluva gap down sooner or later….
As usual, you’re right on the money!
Last week the Fear Greed Indicator posted a low of 29. I would have preferred a bit lower score. But such lows can be a launching pad for a nice rally. Below is the chart for the past several years.
I am very curious as to how they are calculating that measure. Volatility remains at historic lows, and for a historic duration – SVXY made a new 52 week high last week. Not much fear in this market it would seem… 🙂
This link show the data used.
http://money.cnn.com/data/fear-and-greed/
They use seven different measures. One is VIX. Beyond that, I have no idea.
Nice work Lara. Your video segment is very clear about your caution for long positions. I think I will need to raise my stop to protect profits. Thank you for making this very clear indeed.
You’re welcome Rodney.
I have noticed at times of trend changes, in the early stage of a new trend, it does often look uncertain. This may be one of those times.
Or I’m just wrong.
Well, it looks like long positions should be looking still okay today. This is another opportunity to add to long positions, another second wave correction.
If my wave count is correct. And the main wave count so far is looking better than the alternate.
This week I’ll gladly take the title of “Kiwi King” by being first!
Crowned the King with a crown of Kiwi feathers 🙂 Actually, that would make a better hat. Which would keep your ears warm up in those freezing temperatures you endure