
Price moved overall upwards with a higher high and a higher low for the session. Upwards movement was expected.
Summary: Tomorrow may begin with a little downwards movement to end below 2,340.51 but not below 2,336.45. Thereafter, price should turn up and show some increase in momentum.
There is still bullish divergence with price and the AD line, which may need at least one more upwards day to be resolved. But today On Balance Volume gives a bearish signal. There is enough bearishness in the classic TA chart to warrant caution here with any long positions. Please protect your accounts by managing risk diligently.
It is possible that a deeper correction may continue here for another few weeks while price remains below 2,377.18, as per the alternate wave count. This alternate today illustrates the risk to entering long positions here, which may be premature.
New updates to this analysis are in bold.
Last monthly and weekly charts are here. Last historic analysis video is here.
MAIN ELLIOTT WAVE COUNT
WEEKLY CHART
Click chart to enlarge.
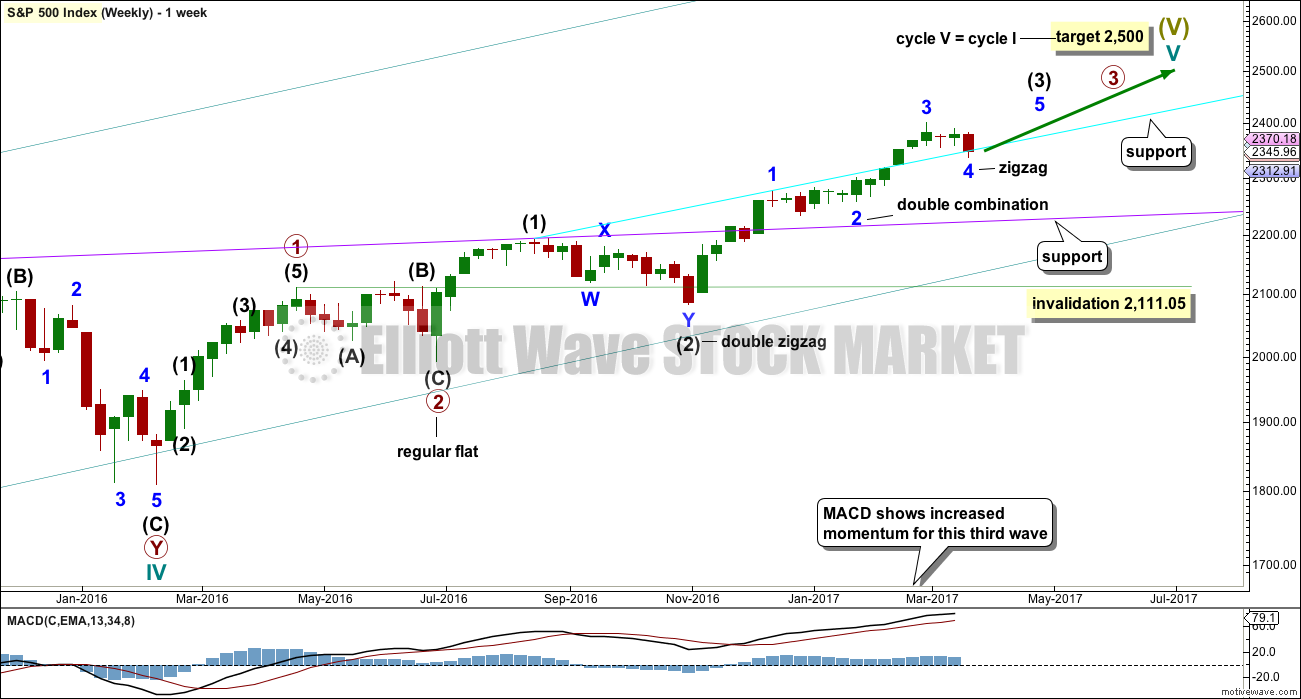
Cycle wave V is an incomplete structure. Within cycle wave V, primary wave 3 may be incomplete or it may be complete (alternate wave count below).
Primary wave 4 may not move into primary wave 1 price territory below 2,111.05.
As price moves lower look for support at each of the longer term trend lines drawn here across previous all time highs. The cyan trend line may provide support. (The trend line has been copied over to hourly charts.) The cyan line is drawn from the prior all time highs of 16th August, 2016, at 2,193.81, to 13th December, 2016, at 2,277.53. Weekly and daily charts are on a semi-log scale.
If price keeps falling here, then look for next support about the lilac line. The lilac line is drawn from the prior all time highs of 20th July, 2015, at 2,132.82, to 15th August, 2016, at 2,193.81.
DAILY CHART

Click chart to enlarge.
All subdivisions are seen in exactly the same way for both daily wave counts, only here the degree of labelling within intermediate wave (3) is moved down one degree.
This wave count expects the current correction is minor wave 4, which may not move into minor wave 1 price territory below 2,277.53. A new low below this point would confirm the correction could not be minor wave 4 and that would provide confidence it should be primary wave 4.
Minor wave 4 is a little below the fourth wave of one lesser degree and may have ended with a small overshoot of the blue Elliott channel and finding support about the cyan trend line. There is good alternation between the very shallow combination of minor wave 2 and the deeper zigzag of minor wave 4.
If minor wave 4 is over, then a target for minor wave 5 is calculated.
Minor wave 3 is shorter than minor wave 1. So that the core Elliott wave rule stating a third wave may not be the shortest is met, minor wave 5 is limited to no longer than equality in length with minor wave 3.
HOURLY CHART
Click chart to enlarge.
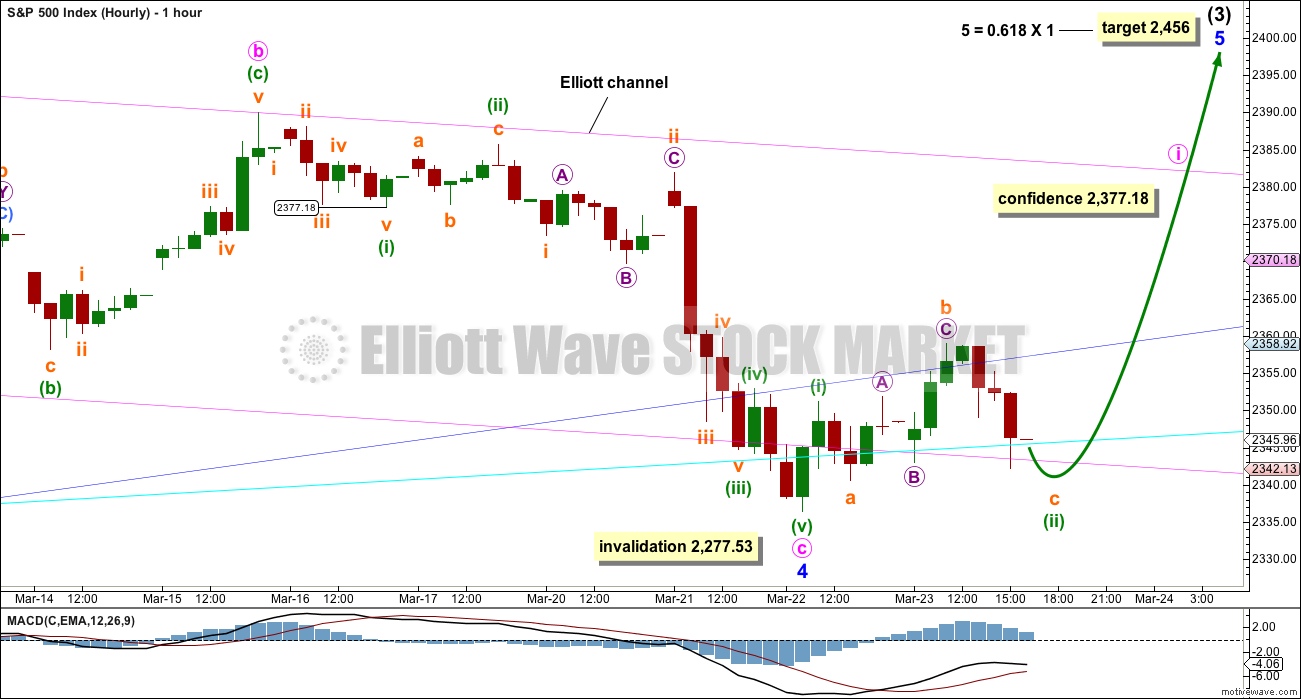
Minor wave 4 may now be seen as a complete structure. The impulse of minute wave c may be complete.
Within minute wave c, if the correction for minuette wave (iv) is time consuming and moves sideways, then it may not move into minuette wave (i) price territory above 2,377.18. A new high above this point would indicate the structure of minute wave c should be over, and so minor wave 4 in its entirety would be very likely then to be over.
Minor wave 4 may have ended with a small breach of the blue Elliott channel, a small overshoot of the pink Elliott channel, and a minuscule overshoot of the cyan trend line. The cyan trend line is not properly breached.
From the low of minor wave 4 to the high during today’s session, this upwards wave will not subdivide as a five nor does it fit as a complete corrective structure. However, it does fit neatly as a short first wave, labelled minuette wave (i), followed by a zigzag up as part of an expanded flat correction. If this labelling is correct, then when markets open tomorrow minuette wave (ii) should move slightly lower. Subminuette wave c would be very likely to make at least a slight new low below the end of subminuette wave a at 2,340.51 to avoid a truncation, but minuette wave (ii) may not move beyond the start of minuette wave (i) below 2,336.45.
Thereafter, upwards movement should resume if this wave count is correct. With the next wave up expected to be a small third wave, for minuette wave (iii), some increase in upwards momentum should be expected.
ALTERNATE DAILY CHART
Click chart to enlarge.
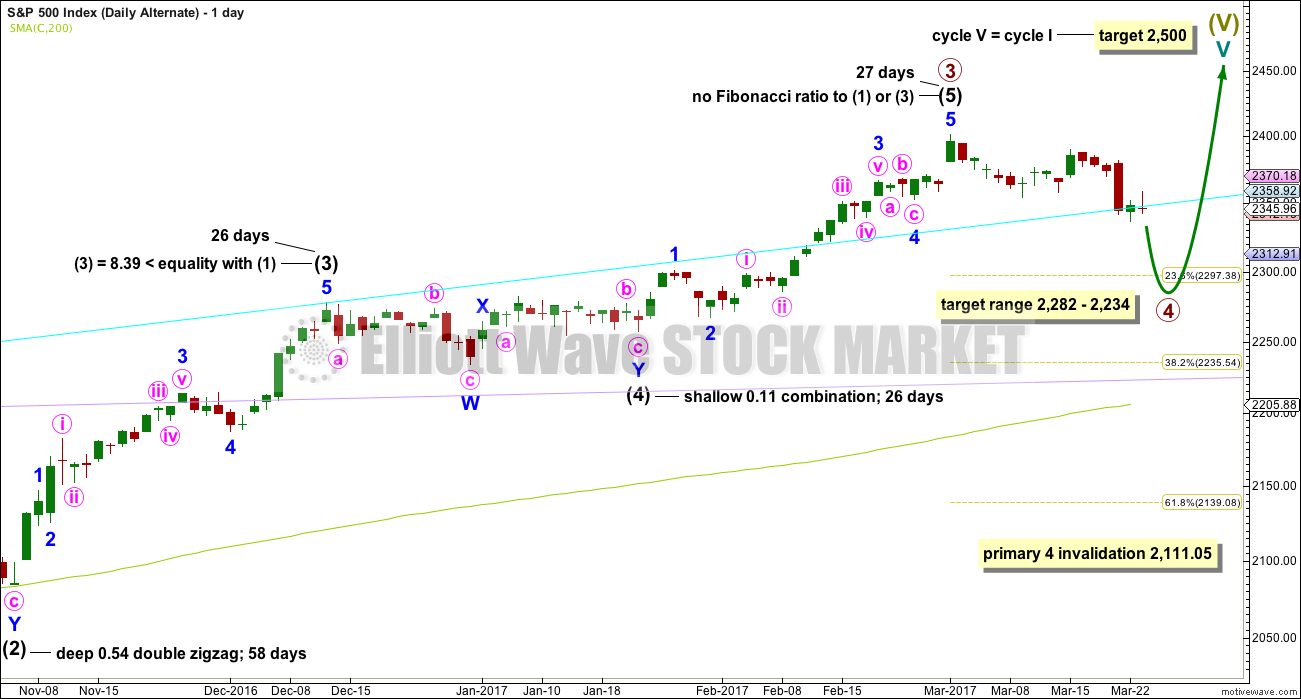
The subdivisions of upwards movement from the end of intermediate wave (2) are seen in the same way for both wave counts. The degree of labelling here is moved up one degree, so it is possible that primary wave 3 could be over.
Primary wave 2 was a flat correction lasting 47 days (not a Fibonacci number). Primary wave 4 may be expected to most likely be a zigzag, but it may also be a triangle if its structure exhibits alternation. If it is a zigzag, it may be more brief than primary wave 2, so a Fibonacci 21 sessions may be the initial expectation. If it is a triangle, then it may be a Fibonacci 34 or 55 sessions.
Intermediate wave (3) is shorter than intermediate wave (1). One of the core Elliott wave rules states a third wave may never be the shortest wave, so this limits intermediate wave (5) to no longer than equality in length with intermediate wave (3). If intermediate wave (5) is now over, then this rule is met.
Minor wave 3 has no Fibonacci ratio to minor wave 1. If minor wave 5 is now over, then it is 4.14 points longer than equality in length with minor wave 3.
Intermediate wave (5) may have ended in 27 days, just one longer than intermediate waves (3) and (4). This gives the wave count good proportions.
The proportion here between intermediate waves (2) and (4) is acceptable. There is alternation. Both are labelled W-X-Y, but double zigzags are quite different structures to double combinations.
The following correction for primary wave 4 should be a multi week pullback, and it may not move into primary wave 1 price territory below 2,111.05.
ALTERNATE HOURLY CHART
Click chart to enlarge.
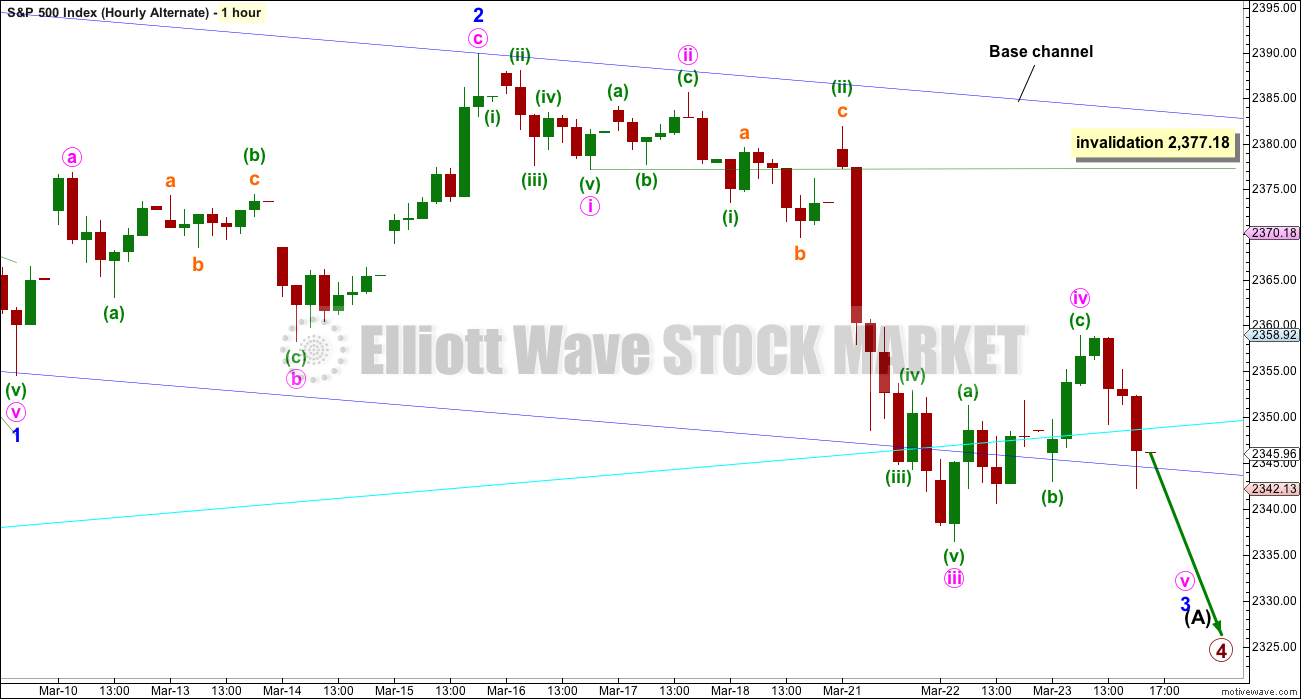
In the short to mid term, the wave counts now diverge, so it is time to publish an hourly chart for this alternate.
Primary wave 2 was a flat correction, so it is most likely that primary wave 4 would unfold as a zigzag. So far, within the zigzag, intermediate wave (A) may be an incomplete impulse.
So far minor waves 1 and 2 may be complete within intermediate wave (A). Minor wave 3 must be incomplete. Upwards movement during today’s session has overlapped back into minor wave 1 price territory, so this cannot be minor wave 4.
Minute wave iv is labelled as a zigzag, but within it minuette wave (b) is either truncated or possibly a triangle (looking at this structure on the 5 minute chart). This piece of movement does not have as good a fit as it does for the main wave count.
Within minor wave 3, the correction for minute wave iv may not move into minute wave i price territory above 2,377.18.
The blue base channel on this alternate is the same as the pink Elliott channel on the main hourly chart. For this alternate, minor wave 3 should have the power to break below the lower edge of the base channel, but it has not done that and seems to be finding strong support about this area. This reduces the probability of this wave count.
TECHNICAL ANALYSIS
WEEKLY CHART
Click chart to enlarge. Chart courtesy of StockCharts.com.
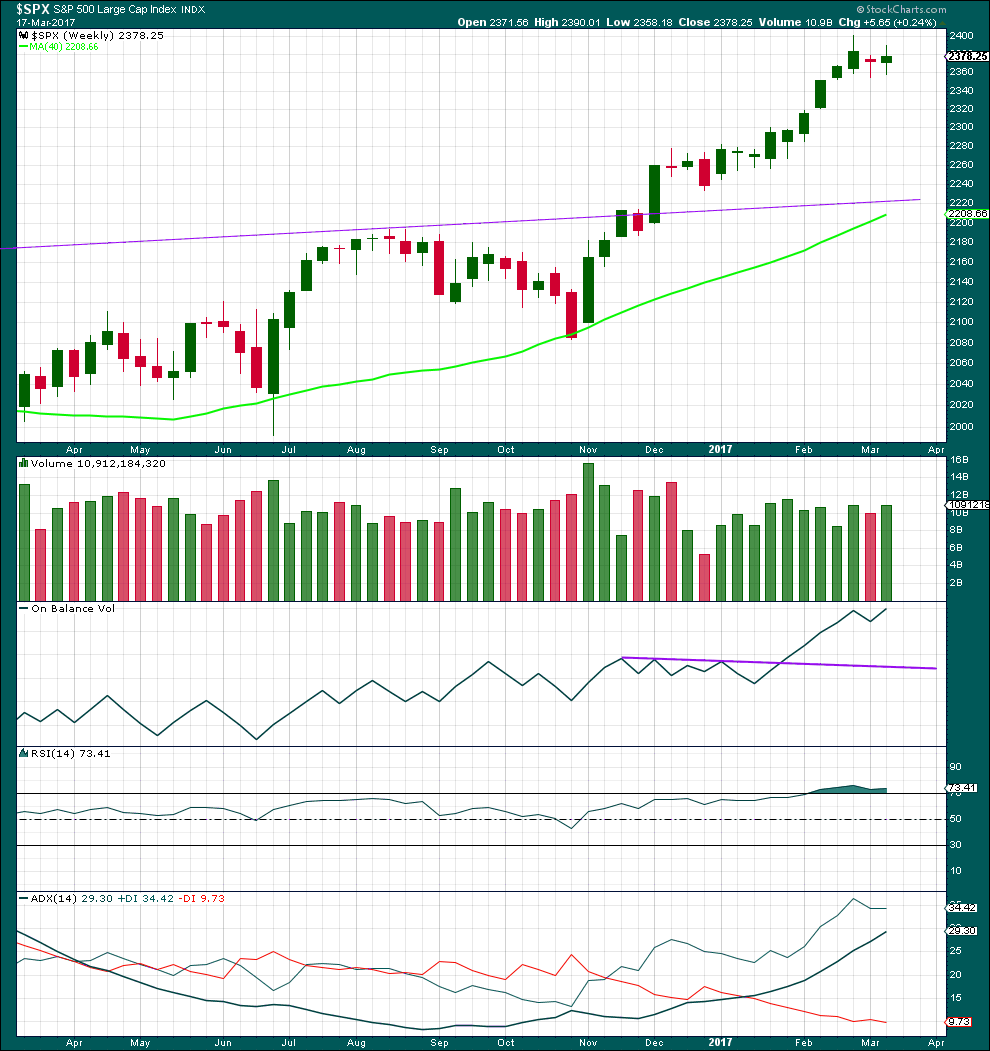
A red doji for the previous week to last week and a small real body for last week look corrective. A small correction looks to be unfolding within a larger upwards trend.
A small increase in volume last week offers some support for upwards movement, but to read this more accurately we should look inside the week at daily candlesticks.
RSI is still extreme, but it may remain so for reasonable periods of time during a trending market. ADX is not yet extreme, so there is room for this trend to continue.
DAILY CHART
Click chart to enlarge. Chart courtesy of StockCharts.com.
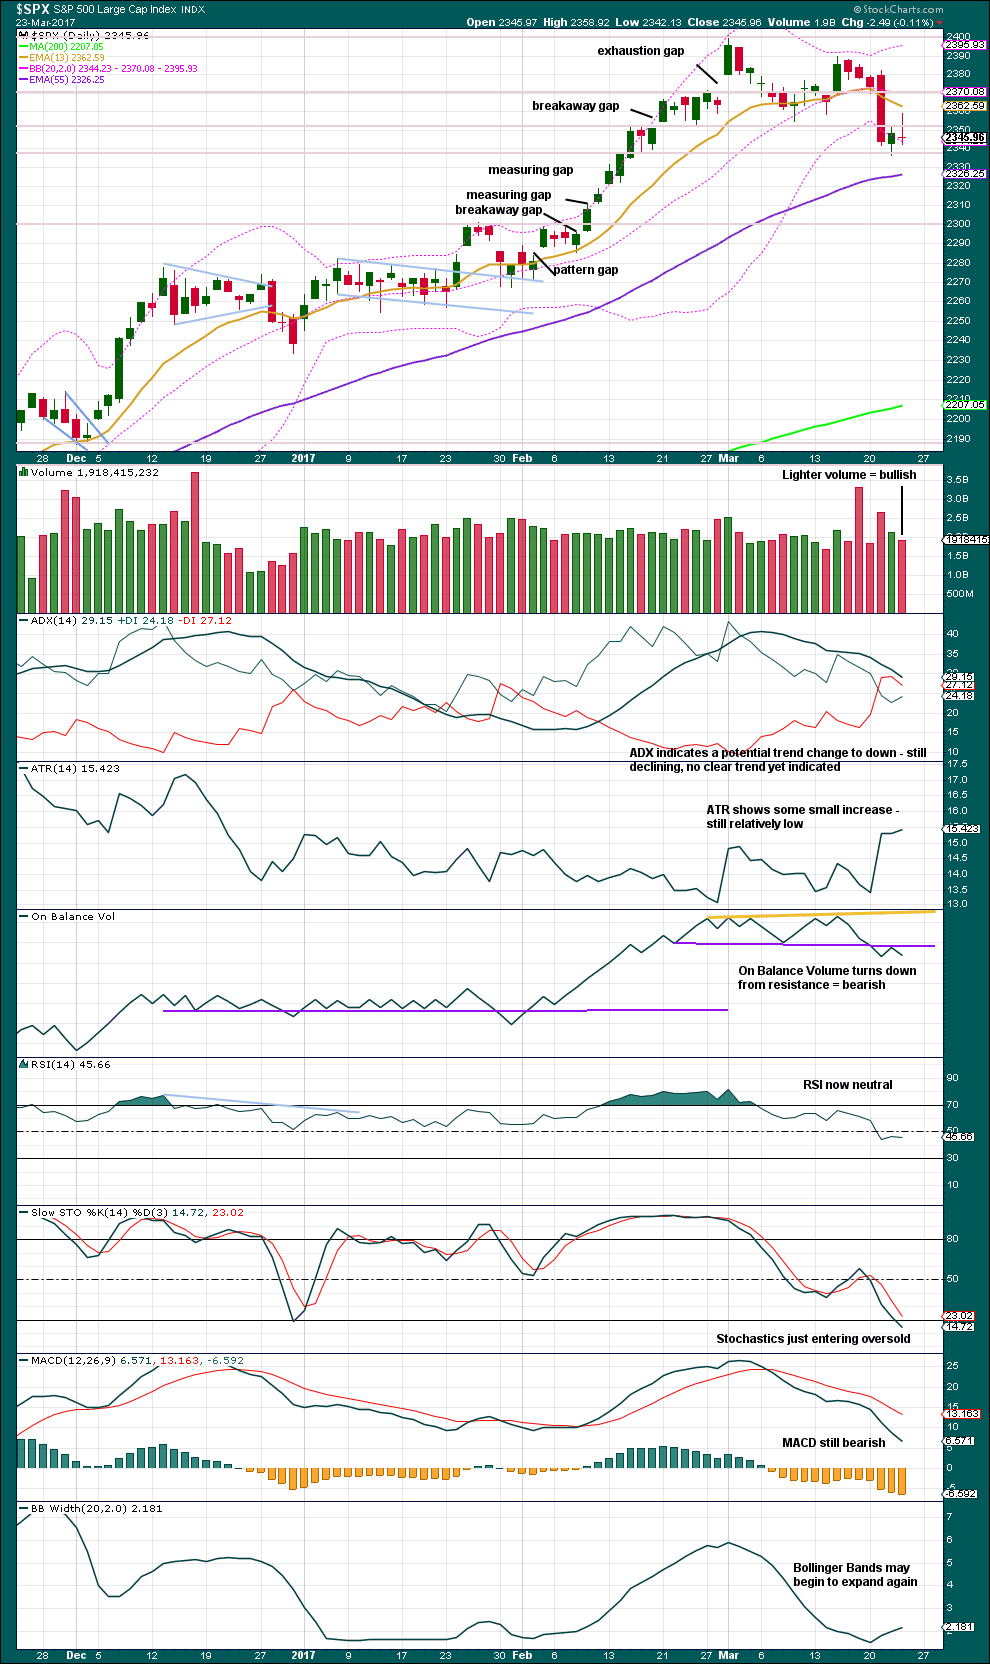
Price moved higher today with a higher high and a higher low, but the session closed red and the balance of volume was down. A decline in volume for the session indicates there was no support for downwards movement during the session from volume. This is read as bullish for the short term, at least.
The last two sessions do have a rather corrective look to them though. It looks like they may possibly be a small consolidation within a continuing downwards movement. Price is finding resistance at the short term Fibonacci 13 day moving average.
On Balance Volume gives a reasonable bearish signal today. If OBV can break above the purple line, that would now be a reasonable bullish signal.
With Stochastics not yet fully oversold and exhibiting no divergence with price at lows, there is room still for the market to fall a bit further here.
There is enough bearishness in this chart to warrant caution with the main Elliott wave count. If price can break above the 13 day EMA and if OBV can give a bullish signal, then more confidence that a low is in place can be had.
VOLATILITY – INVERTED VIX CHART
Click chart to enlarge. Chart courtesy of StockCharts.com.
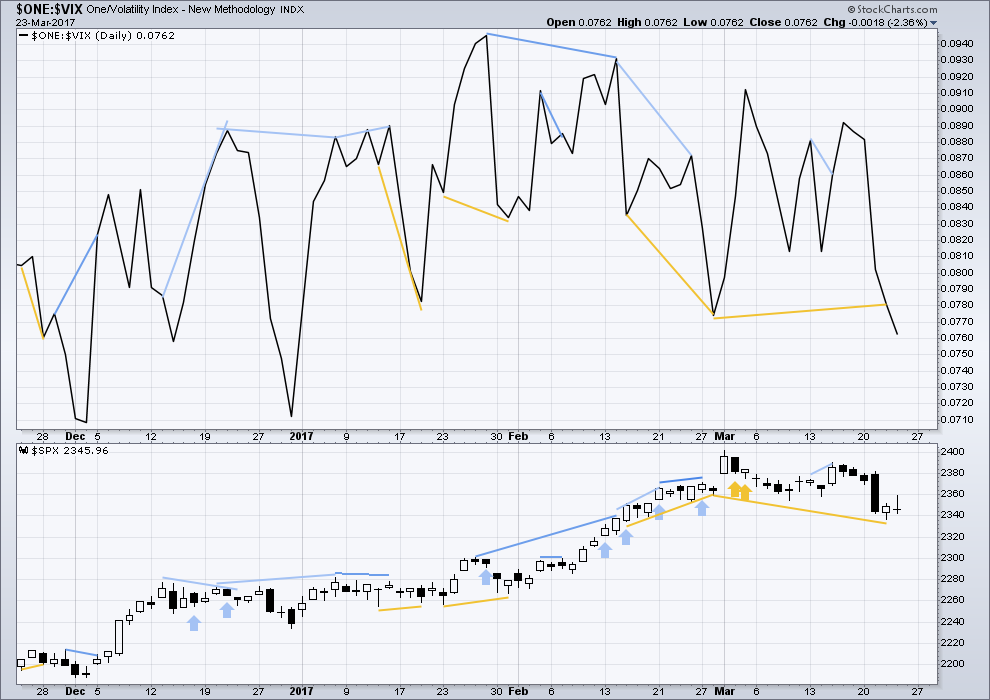
Normally, volatility should decline as price moves higher and increase as price moves lower. This means that normally inverted VIX should move in the same direction as price.
Bearish divergence and bullish divergence spanning a few short days used to be a fairly reliable indicator of the next one or two days direction for price; normally, bearish divergence would be followed by one or two days of downwards movement and vice versa for bullish divergence.
However, what once worked does not necessarily have to continue to work. Markets and market conditions change. We have to be flexible and change with them.
Recent unusual, and sometimes very strong, single day divergence between price and inverted VIX is noted with arrows on the price chart. Members can see that this is not proving useful in predicting the next direction for price.
Divergence will be continued to be noted, particularly when it is strong, but at this time it will be given little weight in this analysis. If it proves to again begin to work fairly consistently, then it will again be given weight.
Mid term bullish divergence between price and inverted VIX has now disappeared. Both price and inverted VIX have made new lows below the prior low of the 28th of February.
Price moved higher but the balance of volume was down. Inverted VIX has moved lower, but this will not be read as bullish nor bearish as the message from price and volume today is not clear.
BREADTH – AD LINE

Click chart to enlarge. Chart courtesy of StockCharts.com.
The rise in price has support from a rise in market breadth. Lowry’s OCO AD line also shows new highs along with price. Normally, before the end of a bull market the OCO AD line and the regular AD line should show divergence with price for about 4-6 months. With no divergence, this market has support from breadth.
There is short term bullish divergence between the AD line and price from yesterday’s low to the low of 14th of March (and also back to the 9th of March). Price has not come with a corresponding decline in market breadth while it has made a new low. There is weakness within this downwards movement from price. This supports the main hourly Elliott wave count which sees a low in place.
Bullish divergence, both short term and single day, has now been followed by an upwards day. It may need at least one more upwards day before it is resolved, or it may be resolved here.
DOW THEORY
The DJIA, DJT, S&P500 and Nasdaq continue to make new all time highs. This confirms a bull market continues.
This analysis is published @ 09:43 p.m. EST.
Lara, do you know when the market closes for trading tonight? Normally it is at 21:00 hrs GMT but I am not sure with the clock changes?
One hour earlier? 20:00 GMT?
TBH Nick I’m not the best person to ask that question. Google may be more reliable 🙂
I have a mental block on time zone differences. I don’t know why, and I can’t seem to get rid of it.
Minor wave 4 has made a very slight new low. This makes minute wave c now have a slightly better five wave look to it.
presumably the main count has been invalidated?
No. We didn’t have confidence that minor 4 was over, that’s why I didn’t pull the invalidation point up on the hourly chart.
Filled at 1.05 and that’s good enough for me. I’m done and outta here!
Have a great weekend all. I think we are going lower.
good weekend — take care
Bye Verne, get some good rest 🙂
Thanks Lara. If you talk to Olga tell her that I really miss her, and that the rest of March and early April would be a good time to ride the Unicorn together! I think there are a few ten-baggers ahead… 🙂
I think she’s lurking about here, so I expect she’s read this
*waves*
Somebody (or somebodies) with deep pockets bought at the open this morning and does not want that gap filled. I’ve got new for ’em…they need to go ahead and take the damn loss or guess what….it just gets BIGGER morons!!!!
Your bankster friends just added some more! They’re really getting egregiously more flagrant. Have a nice weekend!
We are seeing BB expansion in VIX to accomodate higher move in price. Increasing volatility in our immediate future it would appear…it could stay pinned against the upper BB for several sessions.
UVXY 18.00 calls bid/ ask 0.80/0.95…getting close. I should get filled the next half hour….
nice trade
I am starting to think we are not going to get any kind of capitulation downside and intra day reversal move today. The banksters have seen to that.
Looks like we do a slow drift down into the close with interim final move down next week….
UVXY 18.00 strike calls now bid at 0.75 so we are making good progress. Opening sell to close at 1.10 and I am done for the day. These banksters are terminally boring….
It is entirely possible that we are gong to be subjected to a slow, torturous and protracted drift lower in the markets as the trend is fiercely resisted by you-know who.
At some point I hope the dam breaks and we just get the decline over with…
DJI equivalent gap at 20656.58 closed….
Falling out of yet another rising wedge. Bankster stupidity/hubris on display folk; what can you say. They really ought to just give it up already…
Next move down should decisively fill the gap; a real pain in the keyster having to wait but that’s the way the game is played….
Banksters predictably attempting to fight the breakdown….so what else is new…. 🙂
O.K. folks. Vol has made the turn. Prepare to start your engines!
I expect the move down to be sharp, but short and sweet so you are going to have to be nimble if you trade it…
This is waaay too funny! Some congressman is threatening that the DOW is going to shed a thousand point if they don’t pass Obamacare lite…can you imagine?!!
Adding to UVXY 18.0 strike calls to lower cost basis to 0.50…
Current ask 0.38…
The conservative trade is to wait for the gap to be filled…feeling a little bit like a gun-slinger today – BAM!! 🙂
KRE is down 10% since participating in the “Trump Rally”.
I think it is leading the overall market. It really is remarkable that the markets are still trading at these levels, considering what has happened to this “canary”.
KRE is completing a counter-trend bounce at the moment. Picking up April 13 53 strike puts for 1.05. Looking for a 50% pop with a move to 1.50 on next leg down.
Teamsters Local 707 has gone bust. It is a real heart-breaker. Seventy- one year old guys are selling aluminum cans to try and make ends meet after the implosion of their hard-earned pension benefits. I did not realize that the pension guarantee fund (PBGC) covers only PRIVATE pension funds. I can’t believe I was not aware of that. I knew it had only a tiny fraction of the amount it would need to cover potential beneficiaries but I had always assumed that was because it was expected to back-stop public pensions. That is not the case- it “covers” private pension funds only. What this means is that the hundreds of billions in shortfalls owed to state, county and municipal workers is going to be a national disaster. Nobody is talking about this looming disaster. 🙁
Yes, a tiny portion will be covered. If you get a buyout, take it, a bird in hand ……I think the pbgc covers about 50 billion or so, but don’t quote me, at 55 the wheels need some grease.
The underside of the neckline of a possible H&S top is around 2359 and we tagged it yesterday. we may head back there for a second touch today….”molasses”
We will know the mucking around is done with gap closure below 2345.96.
The move down after the closure should be sharp and pose a nice bear trap for the unwary methinks….
The mania remains. A gap up open this morning confirms it. Mr. Market is going to have to buck real hard to shake off these tenacious bulls it appears…..
The tulips that were planted in the Fall have sprung up. To protect them from the rabbits and deer we used a food processer and shaved about 30 bars of Irish Spring soap which was liberally spread around the plants. It will either work or we’ll have some very clean animals.
An article on the Tulip Bulb Mania of 1637 indicated that my good friend Sir Isaac Newton’s foray into tulip bulbs cost him, in today’s currency, about 1 million dollars — ouch. The included drawing shows how that market ran for about two years. Note, the vertical scale is a log scale not linear. Also, note the drop.
In view of how this entire world (not just the US) has been running on fiat money this history seems pertinent, and pertinent on a scale much larger than the Tulip Bulb Mania. But, that was then, now is different — right??? (Just the size of the implosion.)
So, as the market enters the next several months, it might be wise to move toward the exit door, quickly — the stampede could get ugly.
Chuck
The so-called smart money has already left. Retail investors are the ones who piled in on tths runaway leg.
Buying UVXY 18 strike calls expiring today for 0.70
Yep, the wise ones will get out early, the lucky will get out near the top. Don’t forget though the greatest increases come near the end of a craze, not sure if we are there yet but years from now if you sell now you may be a happy camper.
I am expecting we will see an impulse down complete today. If past patterns obtain, it will probably complete prior to the end of the session and hopefully we will get a reversal signal like a hammer or upper BB penetration by VIX with a long upper wick.
I am decidedly bearish and think the next move up is likely to be counter-trend, but I think it will be manic, with everyone concluding happy days are here again. I would not be at all surprised to see futures up massively Sunday evening. I think it will present a great opportunity for a short term long trade and I will be adding a small cache of SPY 233 strike call options expiring next week. I will try to get filled via “stink bids” on any sharp move down today. I will also be buying back the SVXY 195 strike call leaps I sold a week ago, one of my biggest trades this year so far. Remember Lara’s golden rule of trading:
Always, always, ALWAYS use a stop;
No more than 1 1/2 to 3% of available purchasing power on any one trade.
Another one I would add is have a profit target in mind when you enter a trade and if it is reached….TAKE IT!
You know the saying, Bulls make money, Bears make money, but PIGS…well, you get the idea….
Let’ go bruise some banksters! 🙂
3 in a row
You’re on a roll Doc… now, let’s make some money!