
On Friday another downwards day unfolded exactly as expected for the S&P500.
Summary: A shallow pullback looks very likely now to have arrived. It may continue for another few days and possibly a few weeks longer. Target zones are either 2,368 – 2,353 or 2,282 – 2,234. A new low below 2,277.53 would indicate the lower target range should be used.
Downwards movement to find support at the blue channel on the daily and hourly charts is now expected as most likely.
New updates to this analysis are in bold.
Last monthly and weekly charts are here. Last historic analysis video is here.
MAIN ELLIOTT WAVE COUNT
WEEKLY CHART
Click chart to enlarge.
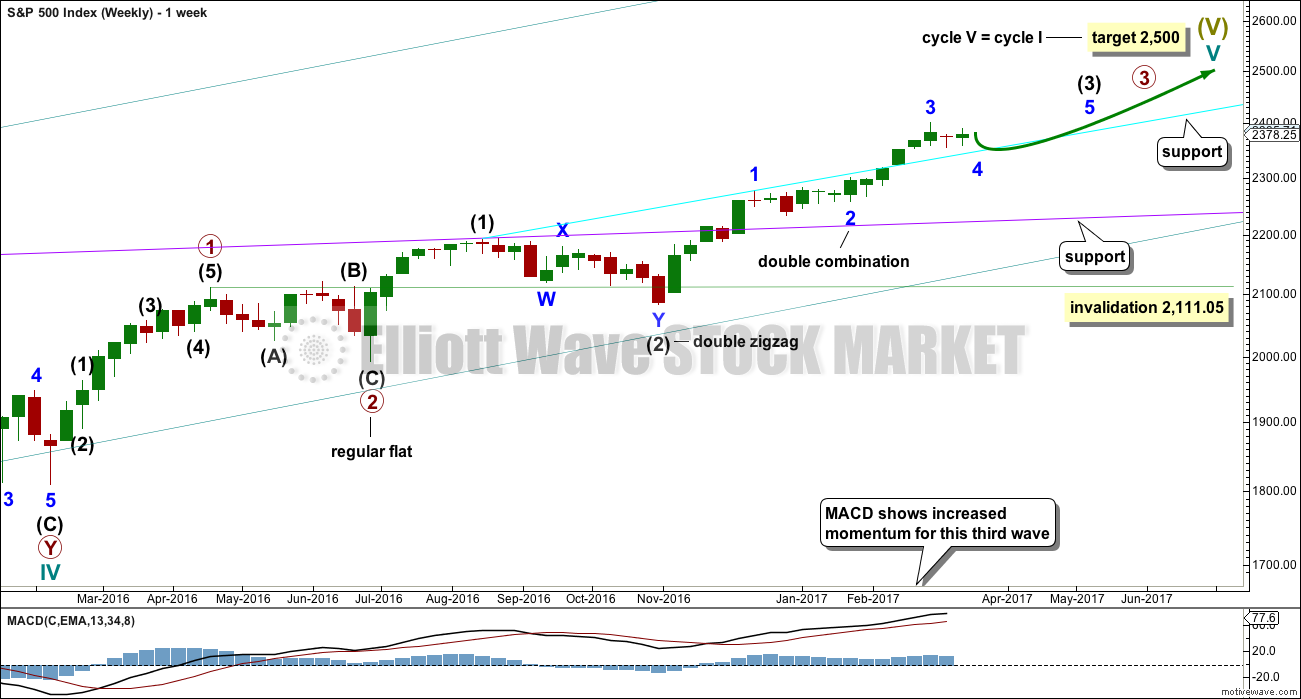
Cycle wave V is an incomplete structure. Within cycle wave V, primary wave 3 may be incomplete or it may be complete (alternate wave count below).
Primary wave 4 may not move into primary wave 1 price territory below 2,111.05.
As price moves lower look for support at each of the longer term trend lines drawn here across previous all time highs. Next support at the cyan line may be met soon.
DAILY CHART
Click chart to enlarge.
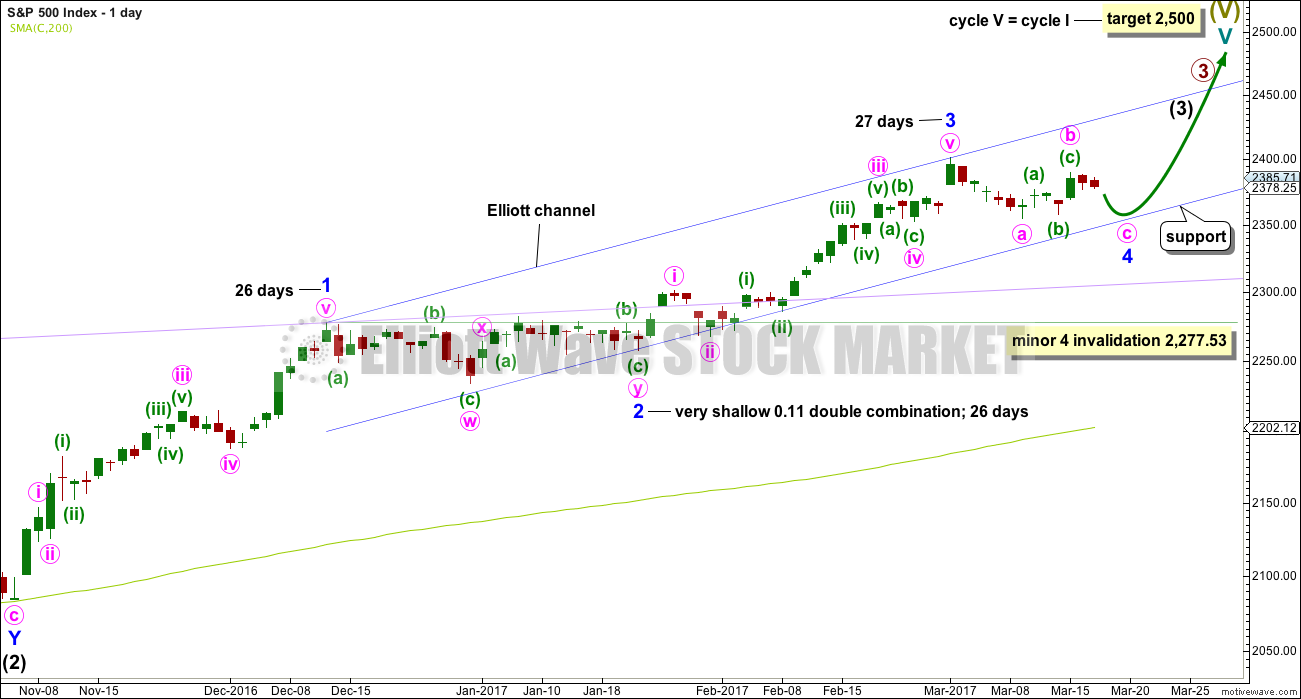
All subdivisions are seen in exactly the same way for both daily wave counts, only here the degree of labelling within intermediate wave (3) is moved down one degree.
This wave count expects the current correction is minor wave 4, which may not move into minor wave 1 price territory below 2,277.53. A new low below this point would confirm the correction could not be minor wave 4 and that would provide confidence it should be primary wave 4.
Minor wave 4 may last about 26 days if it is even in duration with minor waves 1, 2 and 3. That would give the wave count good proportions and the right look. So far minor wave 4 has lasted only 12 days, so it may continue for another 14 if it is even in duration with minor waves 1, 2 and 3.
At this stage, it is looking like this wave count may be more likely than the alternate wave count. A correction at minor degree for minor wave 4 should look similar in range and strength to minor wave 2, which so far it does.
Minor wave 4 may end within the price territory of the fourth wave of one lesser degree about 2,368 to 2,353.
This wave count now expects choppy overlapping movement to find support at the wider blue Elliott channel.
HOURLY CHART
Click chart to enlarge.
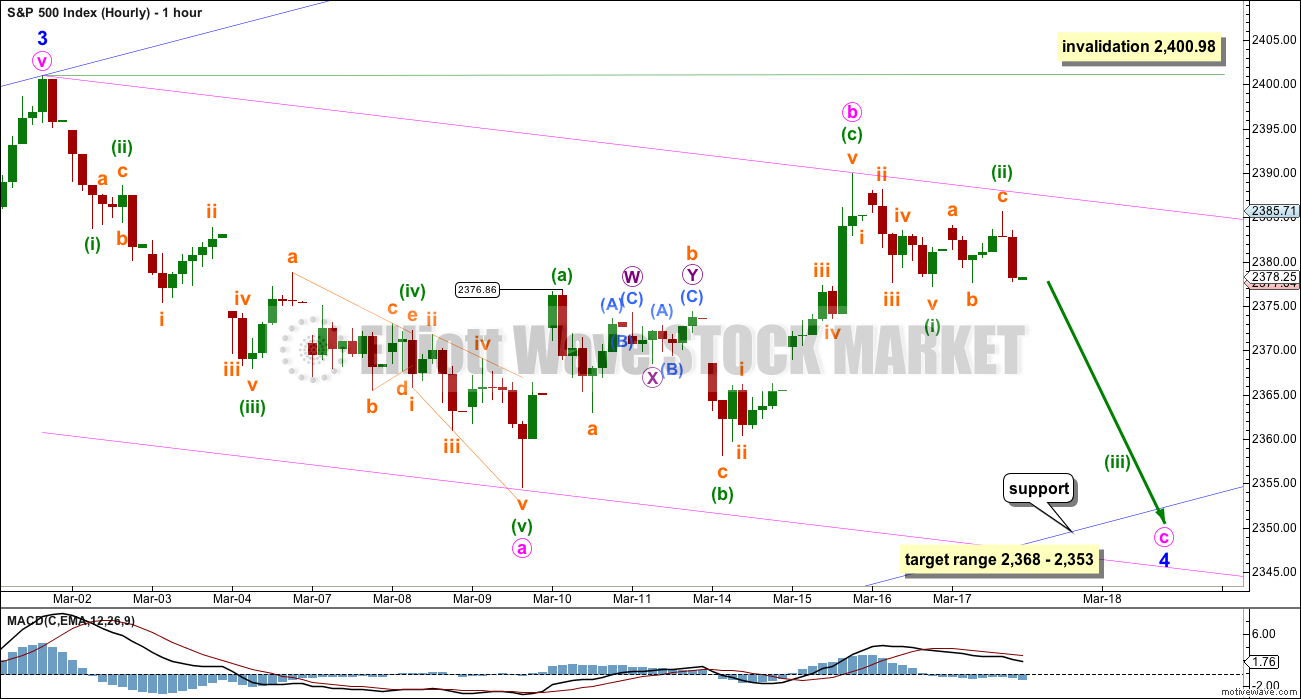
Minor wave 4 looks still like an incomplete zigzag. Within it minute wave b now looks like a complete zigzag.
Use the blue channel to show where minor wave 4 is most likely to end. Expect price to find support at the lower edge.
The target zone of 2,368 to 2,353 is the price territory of the fourth wave of one lesser degree (minute wave iv within minor wave 3 is seen on the daily chart).
So far, within minute wave c, there may be a five down complete for minuette wave (i). Minuette wave (ii) may also be complete as a regular flat correction. If this is correct, then downwards movement should exhibit some increase in momentum when markets open next week.
If price makes a new low below 2,376.86, the high labelled minuette wave (a) within minute wave b, then downwards movement could not be a fourth wave correction within a new impulse unfolding upwards, so the upwards wave labelled minute wave b would be confirmed as a complete three wave structure. A new low below 2,376.86 would add confidence that minor wave 4 is continuing.
If this wave count is invalidated with a new high above 2,400.98, then my labelling of minor wave 4 would be wrong. It could possibly be over or it could be continuing sideways as a flat or combination.
At its end, if this wave count is correct, minor wave 4 may offer a good entry point to join the upwards trend.
Always remember my two Golden Rules:
1. Always use a stop.
2. Do not invest more than 1-5% of equity on any one trade.
ALTERNATE DAILY CHART
Click chart to enlarge.
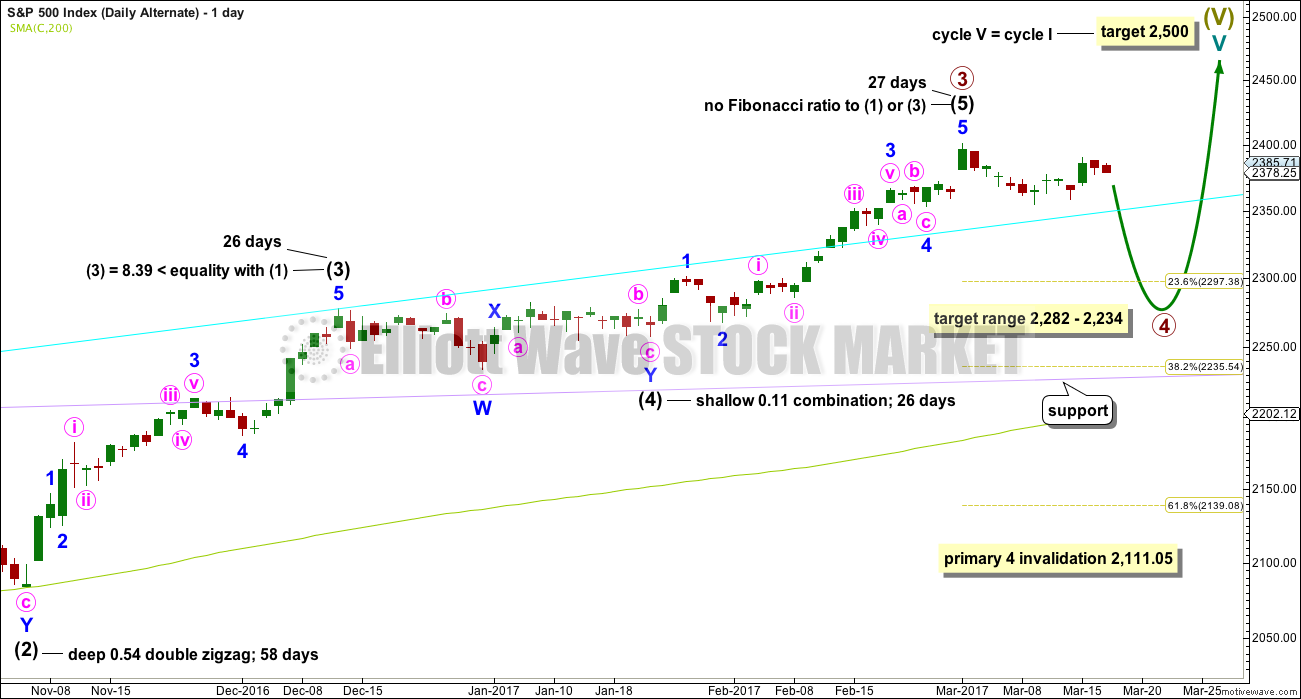
The subdivisions of upwards movement from the end of intermediate wave (2) are seen in the same way for both wave counts. The degree of labelling here is moved up one degree, so it is possible that primary wave 3 could be over.
Primary wave 2 was a flat correction lasting 47 days (not a Fibonacci number). Primary wave 4 may be expected to most likely be a zigzag, but it may also be a triangle if its structure exhibits alternation. If it is a zigzag, it may be more brief than primary wave 2, so a Fibonacci 21 sessions may be the initial expectation. If it is a triangle, then it may be a Fibonacci 34 or 55 sessions.
Intermediate wave (3) is shorter than intermediate wave (1). One of the core Elliott wave rules states a third wave may never be the shortest wave, so this limits intermediate wave (5) to no longer than equality in length with intermediate wave (3). If intermediate wave (5) is now over, then this rule is met.
Minor wave 3 has no Fibonacci ratio to minor wave 1. If minor wave 5 is now over, then it is 4.14 points longer than equality in length with minor wave 3.
Intermediate wave (5) may have ended in 27 days, just one longer than intermediate waves (3) and (4). This gives the wave count good proportions.
The proportion here between intermediate waves (2) and (4) is acceptable. There is alternation. Both are labelled W-X-Y, but double zigzags are quite different structures to double combinations.
The following correction for primary wave 4 should be a multi week pullback, and it may not move into primary wave 1 price territory below 2,111.05.
TECHNICAL ANALYSIS
WEEKLY CHART
Click chart to enlarge. Chart courtesy of StockCharts.com.
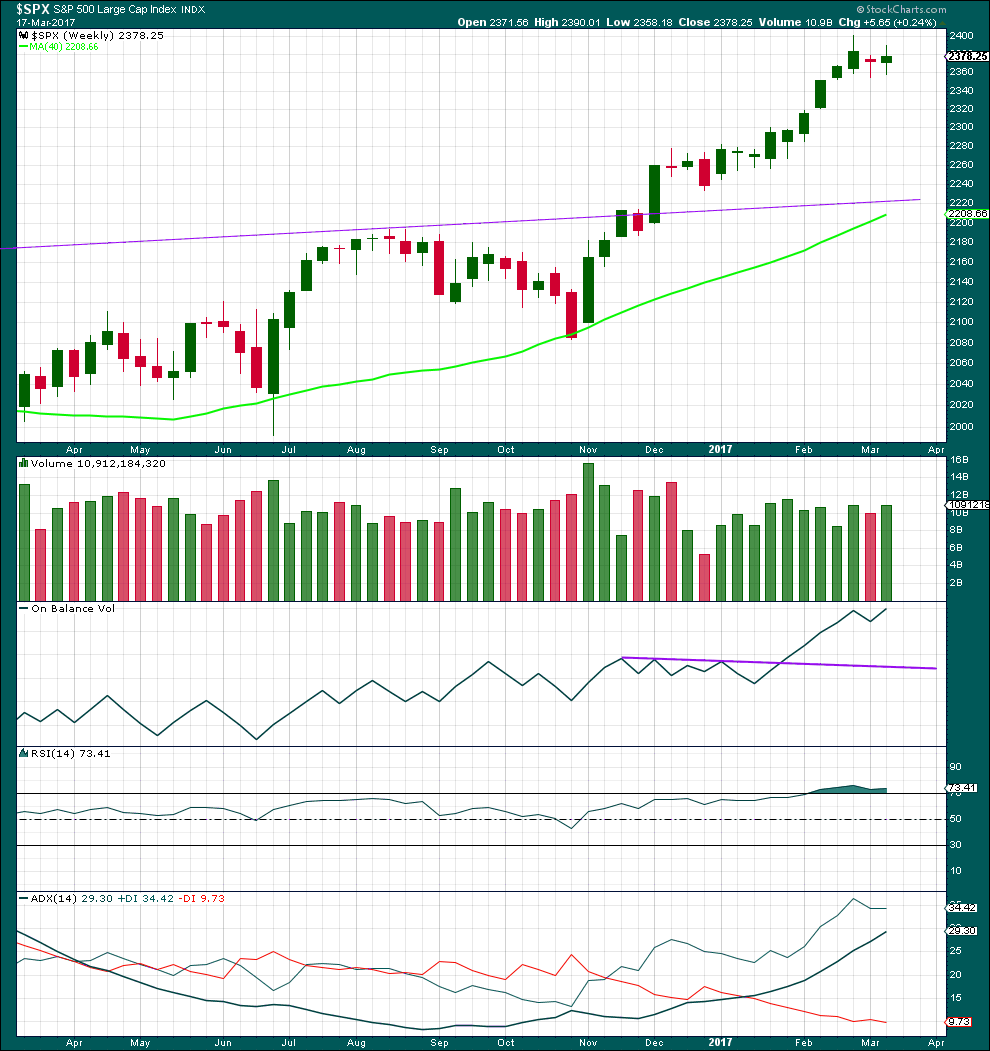
A red doji for last week and a small real body this week look corrective. A small correction looks to be unfolding within a larger upwards trend.
A small increase in volume this week offers some support for upwards movement, but to read this more accurately we should look inside the week at daily candlesticks.
RSI is still extreme, but it may remain so for reasonable periods of time during a trending market. ADX is not yet extreme, so there is room for this trend to continue.
DAILY CHART
Click chart to enlarge. Chart courtesy of StockCharts.com.
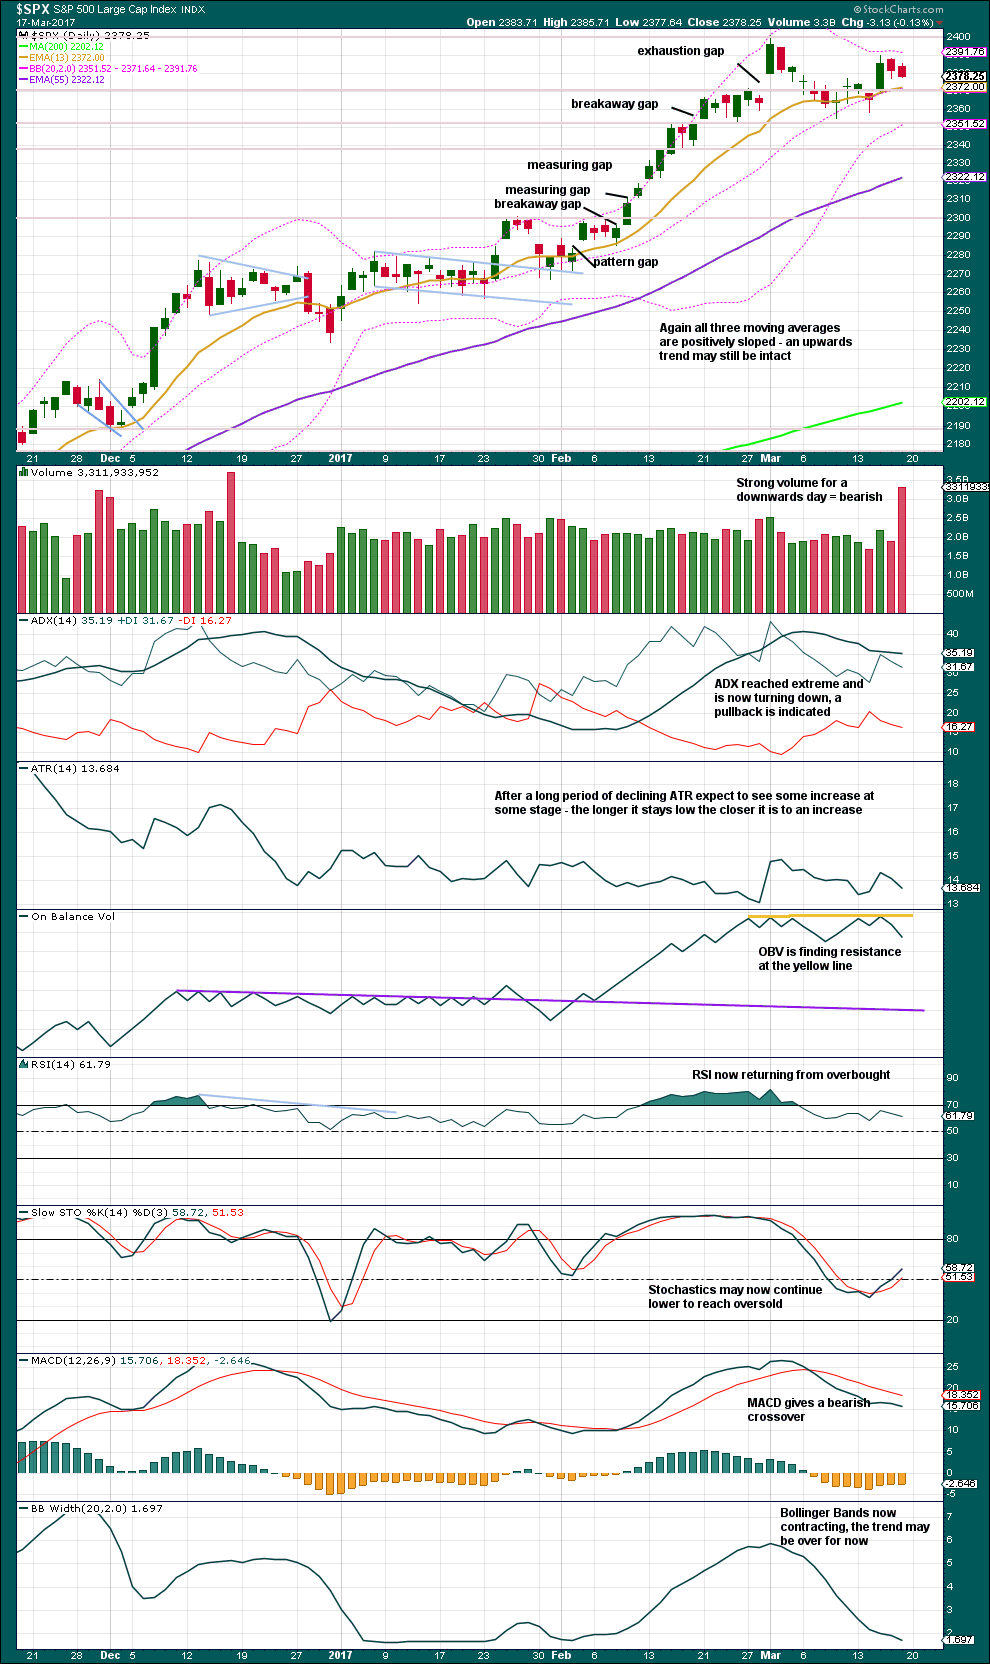
Price is still range bound with resistance about 2,400 and support about 2,355.
Very strong volume for Friday may be due to options expiring this weekend; Friday was the last trading day prior to expiration. This will therefore not be read as very bearish.
It is still reasonable to conclude that the current consolidation is likely to continue further for longer, so that ADX is pulled down from extreme.
VOLATILITY – INVERTED VIX CHART
Click chart to enlarge. Chart courtesy of StockCharts.com.
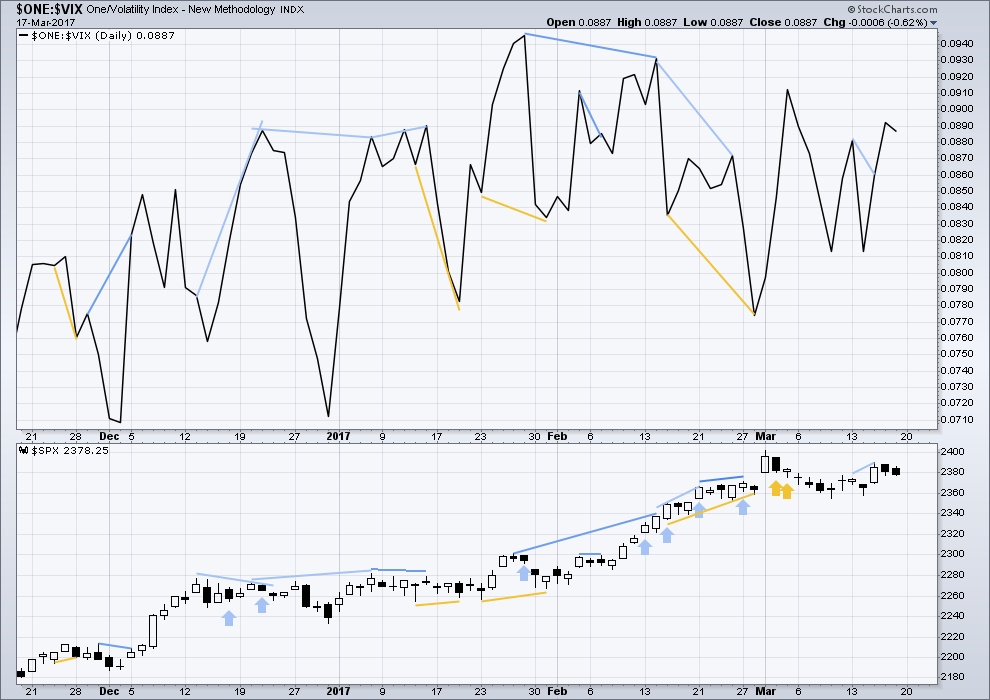
Normally, volatility should decline as price moves higher and increase as price moves lower. This means that normally inverted VIX should move in the same direction as price.
Bearish divergence and bullish divergence spanning a few short days used to be a fairly reliable indicator of the next one or two days direction for price; normally, bearish divergence would be followed by one or two days of downwards movement and vice versa for bullish divergence.
However, what once worked does not necessarily have to continue to work. Markets and market conditions change. We have to be flexible and change with them.
Recent unusual, and sometimes very strong, single day divergence between price and inverted VIX is noted with arrows on the price chart. Members can see that this is not proving useful in predicting the next direction for price.
Divergence will be continued to be noted, particularly when it is strong, but at this time it will be given little weight in this analysis. If it proves to again begin to work fairly consistently, then it will again be given weight.
There is no new divergence between price and inverted VIX for Friday’s session.
BREADTH – AD LINE
Click chart to enlarge. Chart courtesy of StockCharts.com.
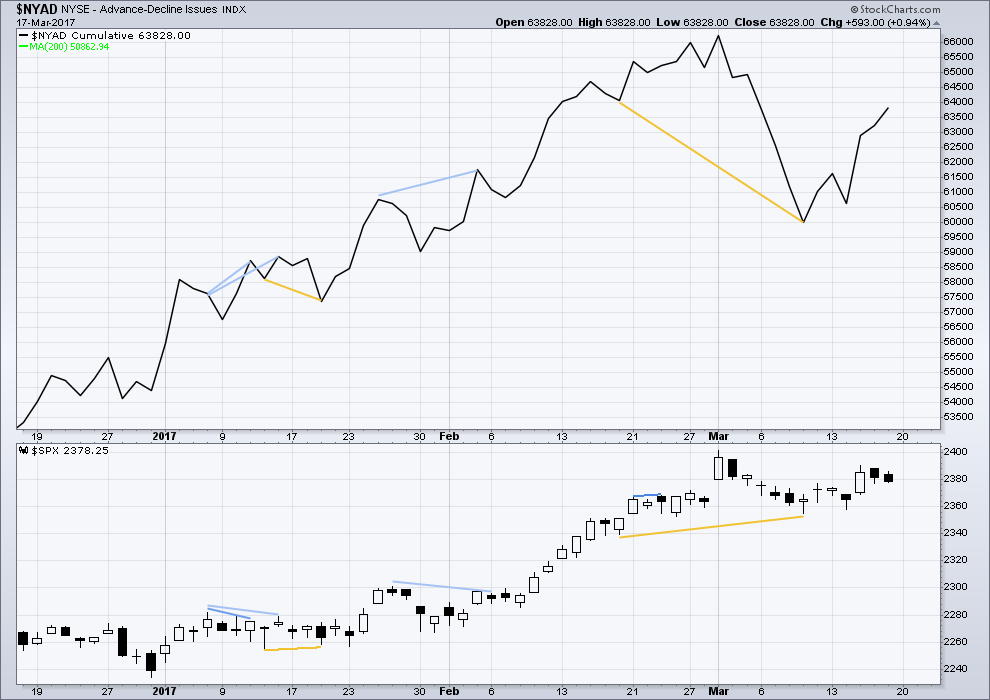
The rise in price has support from a rise in market breadth. Lowry’s OCO AD line also shows new highs along with price. Normally, before the end of a bull market the OCO AD line and the regular AD line should show divergence with price for about 4-6 months. With no divergence, this market has support from breadth.
Price has moved lower for two days in a row now, but the AD line has moved higher. There is weakness within downwards movement; market breadth has increased even though price has declined. This divergence is bullish.
DOW THEORY
The DJIA, DJT, S&P500 and Nasdaq continue to make new all time highs. This confirms a bull market continues.
This analysis is published @ 06:10 p.m. EST on 18th March, 2017.
I don’t know how many of you are following the breaking story of the wholesale surveillance of Americans that has been going on in the US. It turns out Trump was right, and that along with millions of other Americans, he has been illegally monitored going back to the Bush administration. We have a totally criminal enterprise masquerading as a Federal government in the US. This is absolutely incredible and nobody is reporting on this. Here is what’s even more interesting.
When civilians were called to make a random check of the list to confirm the veracity of the information in the data base by journalists who got hold of it, names and addresses were all confirmed. What was NOT confirmed, were a large number of bank accounts associated with many of these names, in which were things like oil rig leases, derivative trades, off-shore holdings…you get the picture.
What in the hell is going on in this country???!!!!!! 🙁
I expect the consolidation will continue with perhaps a quick intra-day run to Lara’s target before we go on to new highs. This has been the pattern of a market with a constant bid under it and that will continue until it changes. See y’all later! 🙂
Wow! Kudla called it! Amazing!
March has historically been an important month for significant trend changes in the market. Will we see another bizzarro market event with an uncharacteristic departure from the expected? If I were to hazard a guess, this looks to be a very shallow correction underway. Alternation would have suggested a deep since the prior second wave correction was shallow. I think this market in NOT going to have a proper correction and will make another run higher. I have a sneaky feeling it could be terminal.
Bots continue to buy little mean deviations and price moves lower.
Typically this leads to a big cash dump towards the close to defend support levels…
A new low below 2,376.86 indicates the prior wave up is over and was very likely a three, that’s what it looks like.
So I have a bit more confidence now in the expectation of downwards movement this week to end when / if price comes to touch the lower edge of the blue channel.
A target of C = 0.618 X A would result in a truncation. A target of C = A would result in a reasonable overshoot of the blue channel. So I’m still not going to give a price target for C to end, I’m still going to use the blue trend line. At this stage that would see a low about 2,354.
At minimum expect C to move at least slightly below A at 2,354.54 to avoid a truncation. It looks like it may only be able to just do that, and maybe not much more.
It is truly amazing watching these market algos kick in. There is a kind of clock-work precision about what they are doing and the levels they are buying. I am curious to see how long this can keep up and how it resolves. We went sideways for over a year previously! What a sobering thought!! 🙂
Another smart Chris that I like, Chris Kimble, has been pointing out double tops made by the transports in 1999 and 2007. The charts are remarkably similar to the price action underway in that the transports rebounded from deep declines, appearing to be on the verge of breakouts before rolling over. Few were expecting to see new highs there, thus confirming the current bull run. Transports, probably more than any other index, paint a truer picture of what is going on in the economy and as we all know for this reason is an important component of DOW theory. Although they have been weaker than the other indices of late, it is still quite strange that they have remained this elevated. All one has to do is look at top and bottom line earnings of companies over the past three years and you will find the decline has been steady and relentless, another reason PE ratios now being sported show optimism in the extreme, and frankly entirely divorced from reality. The question then is why was the index rising in what is clearly a slowing economy? I have no idea what the answer is to that. All I know is that like so many other things we have been seeing in the markets it makes no sense whatsoever. Someone once said the market can remain irrational longer than most of us can remain solvent and ain’t that the truth! 🙂
I think the transports bear (no pun intended!) close watching. They will very likely signal the future of the other senior indices.
I am also watching volatility closely. At some point it will start to rise, in spite of the massively short trades currently in effect against it. Based on what I have been reading about this situation, I expect vol to initially start rising in the face of also increasing prices which is clearly divergent but now I think I understand why. I suspect at some stage we will reach an inflection point where short vol trades will have to be unwound and we will see a sudden spike. This in turn should lead to leveraged long positions being forced to liquidate in a cascade effect of falling prices. The longer we go without a meaningful correction, the less likely the next decline is to be just a correction, but that is just one man’s opinion! 🙂
The very same pattern appears on materials as well.
Yes indeed!
Sorry to get all serious Verne, but I’m curious; do you think they let the pension funds fail?
It is hard for me to see how they are going to save them.
Keep in mind that not only pension funds, but also a very large number of municipalities are also in trouble and are going to default on the hundreds of billions in bonds issued. The pension guarantee fund is a total and complete farce, unable to cover even 1% of outstanding liabilities. Tax revenues are going to continue to fall as boomers retire and businesses fail so everyone is going to need a bail-out. I suspect they will offer pensioners twenty cents on the dollar and call it a save! Those will be the lucky ones! 🙁
I think you’re right on the money. I’m still in shock this afternoon from hearing Evans say “more upside possibility in uncertainty”.
You can’t make that stuff up! 🙂
There is another devious aspects of market events that one cannot ignore, and that is a deliberate attempt to mislead traders by spoofing commonly recognized signals. I took a course with John Carter a few years ago and he showed a remarkable number of chart where you had clear dojis coming after up-trends but did not result in trend reversals but the exact opposite. He had a number of examples of things like that where the market was doing exactly the opposite of what you would have expected and he was of the opinion that it was not by accident. John has developed a number of very interesting sophisticated tools to identify stocks which have their trading patterns distorted by bot trading. He now rarely trades the indices and tends to focus on individual stocks in his trading recommendations as he thinks the indices have long since become divorced from reality. One of the great things about EW, and particularly Lara’s analysis, is while we may not have a lot of certitude about timing and duration, we are more often than not going to be on the right side of the current trend and that is invaluable.
I am starting to think that we may be in some kind of small degree fifth wave up.
If that is the case, we could meander higher for most of this week but the implication is the next move down could be deeper that we are expecting. How the indices close today should give a clue of what’s going on.
Another great analysis and commentary including the video. Yesterday, when I watched C. Ciovacco’s video, I noted the same thing you did about VIX. It is not only unreliable as a correlation to SPX, but he calls it dangerous. After seeing his chart on this, I cannot any longer trust it as an indicator.
Great work. I hope you were able to trap many varmints this weekend.
Hopefully not any bulls or bears. Bull traps and bear traps are hazardous to traders.
No bulls nor bears. Just two rats and one possum 🙂
Three less predators to eat Kiwi chicks.
Oh yeah, and two bee stings. On me 🙁 Turns out going surfing afterwards and dunking myself in salt water does not heal bee stings. Still, it was worth a try.
I agree that there is danger but probably not for the same reasons he does.
An absence of fear does not equal an absence of risk.
To the degree people are interpreting a moribund (and highly shorted) VIX as suggesting an absence of downside risk, to that degree one’s view of its relevance poses danger imo. All that glitters is not Gold….
I have learned a few things this weekend that makes me even more wary about this market and people with pollyanaish views about upside potential its upside market.
The kinds of distortions we are seeing do not necessarily mean that under normal market conditions these signals are not meaningful. The key is to understand we are NOT dealing with normal market conditions by any means.
I am curious as to what all the smart people who think thwy will not be left without a chair when the music stops do when bids literally disappear from the market – especially if it happens overnight….
Agreed Verne, the notion that a static mathematical computation (VIX) that seeks to measure fear/risk is dangerous is a complete joke. VIX futures are heavily shorted by the banksters et al; a relatively recent tool to create the wealth effect by lulling investors to sleep. IMHO, collective central bank distortion of the markets, which has sucked everyone in, will have the same inverted affect once nominal prices retreat and they are exposed more publicly.
Chris,
Perhaps I misrepresented C. Ciovacco and did not express his thoughts clearly. He did not speak about fear in the market or lack thereof. What he said is that the correlation of SPX price to that of VIX is extremely weak and sometimes inverted. If you look at his charts which use raw data, it is undeniable. If I remember correctly, his data includes many, many years. Sometimes VIX and SPX move inversely of one another and equally as often, they do not. Thus, to use VIX as an indicator of SPX directional movement is dangerous.
For me, that was enough information clearly stated to decide I cannot rely upon VIX as an indicator for SPX movement.
Chris C is right about one thing. An inability to engage in true price discovery is dangerous. To me it does not matter whether you are looking at an instrument like VIX, or something like PE ratios. What I think is missing from Ciovacco’s commentary is WHY correlations sometimes break down. So he is right in that a person trying to use VIX in this environment to determine if it is a good time to short the market had better have the right time horizon or they will loose money. Similarly, anyone who believes that the current PE ratios are telling them anything reliable about S&P profits going forward must be smoking something pungent….
Bottom line? All distortions are eventually corrected! 🙂
By the way, your accusation that what I wrote or what C. Ciovacco said is a “complete joke’ is not appreciated.
Chris your analytical training probably gives you a perspective that others might miss. The risk assessment department of brokerage houses are where the smartest people are supposed to be. At least one person has to be a qualified actuary. What a lot of folk are not aware of, is that VIX plays a formal role in how these guys, as well as most trading algorithms, assign risk. It reminds me of what happened with the advent of CDOs when the rating agencies slapped investment grade ratings and sold them to pension funds and other investors as safe. The fact that they had been assigned an investment grade did not necessarily make it so. In a similar vein, when criminal banksters collude to short VIX, thus giving a distorted view to men and machines of the actula level of risk, it is certain to end badly. As you correctly point out, the aim is indeed to foster a climate of complacency and in that they have succeeded wonderfully. What I find interesting is that these really smart guys have to know what is going on for even a blind person can see it. No wonder they changed the rules to allow banks to take depositors’ money when the music stops. I keep hearing about how market transitions are orderly and this or that gauge will give plenty of advance warning of SHTF. I sincerely hope they are right…but I for one am not betting on it….
I am still hoping we get some kind of minor correction to ensure that final wave up but is just does not seem to be forthcoming, in my view a very bad omen… 🙂
Right on Verne. Very few are aware that the algo bots allocate capital weightings based on VIX levels, although I’m not surprised that you know what’s up. Again, IMHO there will not be a quantifiable estimate to this cycle’s ending. For years we’ve been in backwards-ville FUBAR land, and I think there’s enough cracks re-emerging that it could happen at any time. Trading Rule #3= When in doubt, sit out!
meep meep
Road Runner,
The coyote’s after you!
Road Runner,
If he catches you, you’re through!