
Price moved lower for the session, which was what was expected for the short term from the hourly Elliott wave count.
Summary: A deeper pullback looks very likely now to have arrived. It may last at least another two days and possibly a few weeks longer. Target zones are either 2,368 – 2,353 or 2,282 – 2,234. A new low below 2,277.53 would indicate the lower target range should be used.
Downwards movement for two days to find support at the blue channel on the daily and hourly charts, and the pink channel on the hourly chart, is now expected as most likely.
However, there is a little doubt today on the expectation of downwards movement tomorrow; divergence with the AD line and light volume today looks a little bullish.
New updates to this analysis are in bold.
Last monthly and weekly charts are here. Last historic analysis video is here.
MAIN ELLIOTT WAVE COUNT
WEEKLY CHART
Click chart to enlarge.
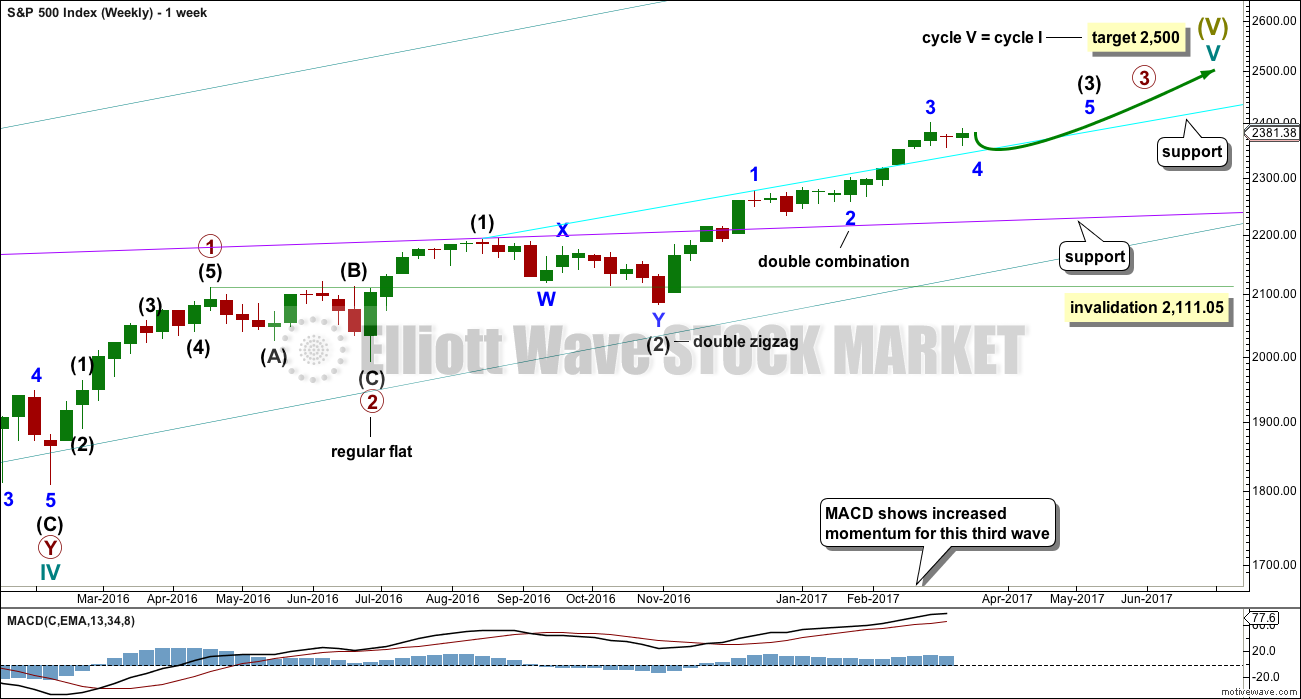
Cycle wave V is an incomplete structure. Within cycle wave V, primary wave 3 may be incomplete or it may be complete (alternate wave count below).
Primary wave 4 may not move into primary wave 1 price territory below 2,111.05.
As price moves lower look for support at each of the longer term trend lines drawn here across previous all time highs. Next support at the cyan line may be met soon.
DAILY CHART
Click chart to enlarge.
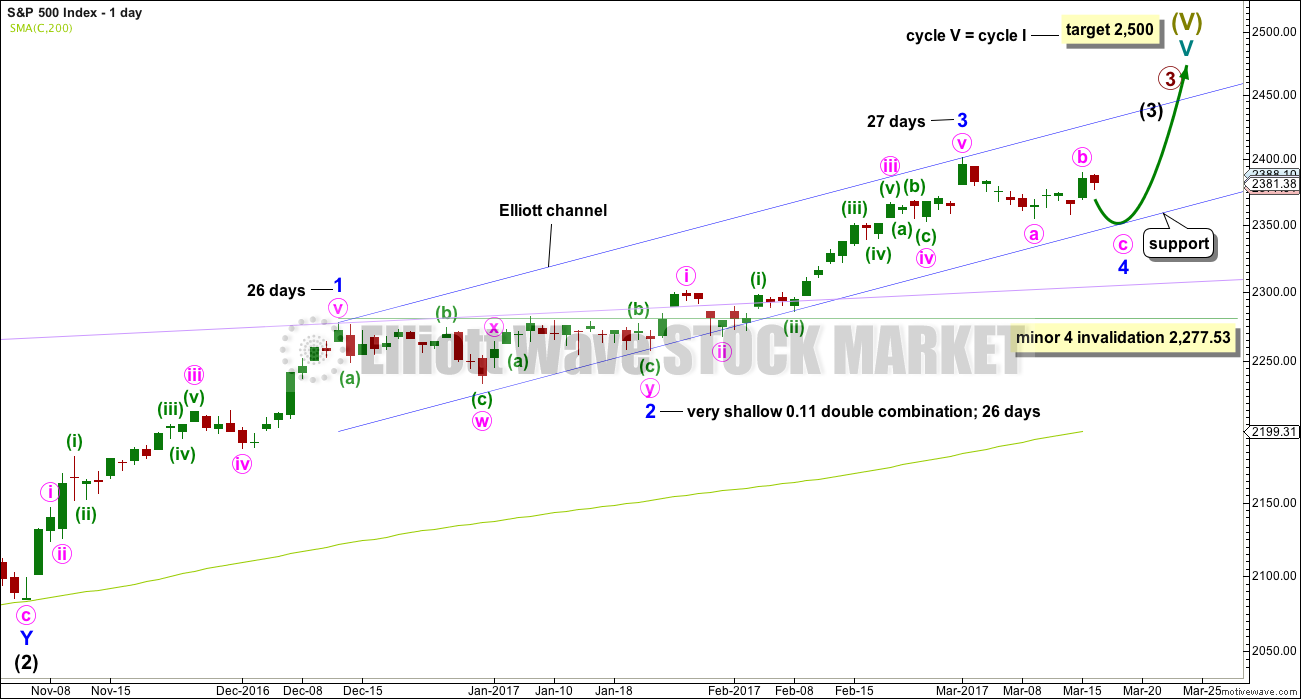
All subdivisions are seen in exactly the same way for both daily wave counts, only here the degree of labelling within intermediate wave (3) is moved down one degree.
This wave count expects the current correction is minor wave 4, which may not move into minor wave 1 price territory below 2,277.53. A new low below this point would confirm the correction could not be minor wave 4 and that would provide confidence it should be primary wave 4.
Minor wave 4 may last about 26 days if it is even in duration with minor waves 1, 2 and 3. That would give the wave count good proportions and the right look. So far minor wave 4 has lasted only 11 days, so it may continue for another 15 if it is even in duration with minor waves 1, 2 and 3. However, zigzags are usually quicker structures than combinations. If minor wave 4 is unfolding as a zigzag (which looks likely and would give perfect alternation), then it may complete in a total Fibonacci 13 days, so it may end now in another 2 days.
At this stage, it is looking like this wave count may be more likely than the alternate wave count. A correction at minor degree for minor wave 4 should look similar in range and strength to minor wave 2, which so far it does.
Minor wave 4 may end within the price territory of the fourth wave of one lesser degree about 2,368 to 2,353.
This wave count now expects choppy overlapping movement to find support at the wider blue Elliott channel.
HOURLY CHART
Click chart to enlarge.
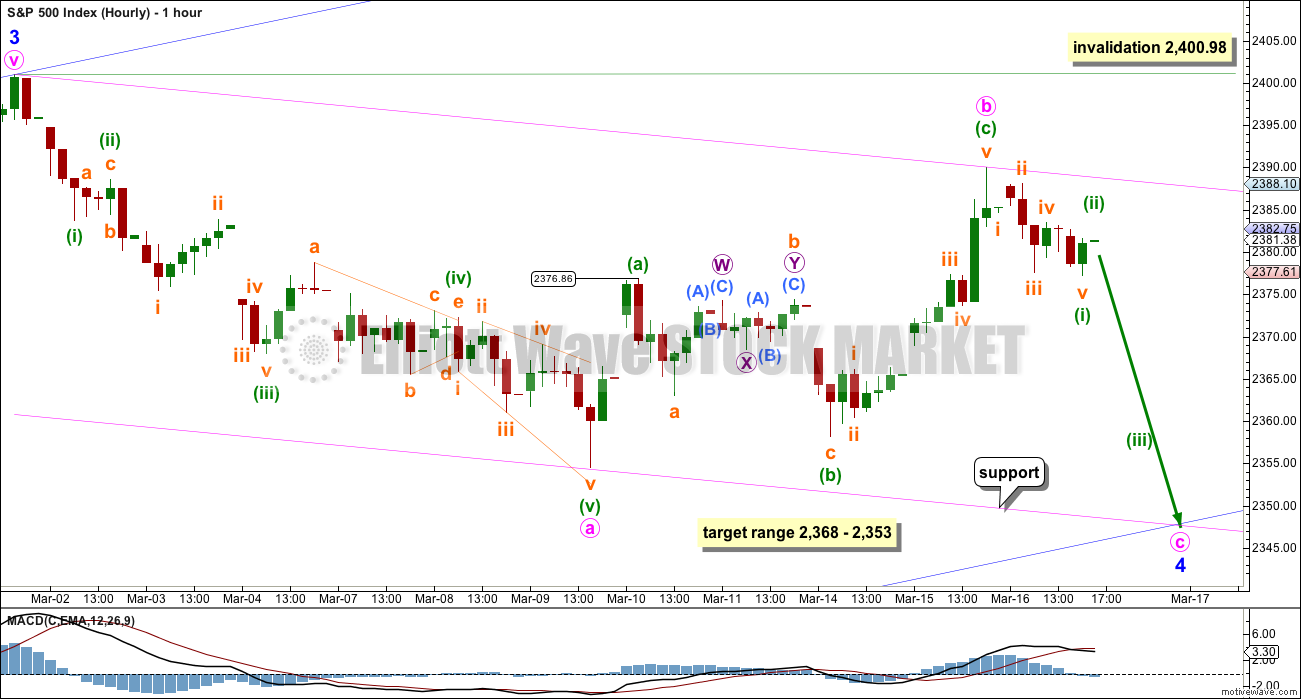
Minor wave 4 looks still like an incomplete zigzag. Within it minute wave b now looks like a complete zigzag.
Use the pink and blue channels to show where minor wave 4 is most likely to end. Expect price to find support at both lower edges.
The target zone of 2,368 to 2,353 is the price territory of the fourth wave of one lesser degree (minute wave iv within minor wave 3 is seen on the daily chart).
So far, within minute wave c, there may be a five down complete for minuette wave (i). Minuette wave (ii) may move higher tomorrow. If it does, then look for upwards movement to find resistance at the upper edge of the pink channel.
If price makes a new low below 2,376.86, the high labelled minuette wave (a) within minute wave b, then downwards movement could not be a fourth wave correction within a new impulse unfolding upwards, so the upwards wave labelled minute wave b would be confirmed as a complete three wave structure. A new low below 2,376.86 would add confidence that minor wave 4 is continuing.
If this wave count is invalidated with a new high above 2,400.98, then my labelling of minor wave 4 would be wrong. It could possibly be over or it could be continuing sideways as a flat or combination.
At its end, if this wave count is correct, minor wave 4 may offer a good entry point to join the upwards trend.
Always remember my two Golden Rules:
1. Always use a stop.
2. Do not invest more than 1-5% of equity on any one trade.
ALTERNATE DAILY CHART
Click chart to enlarge.
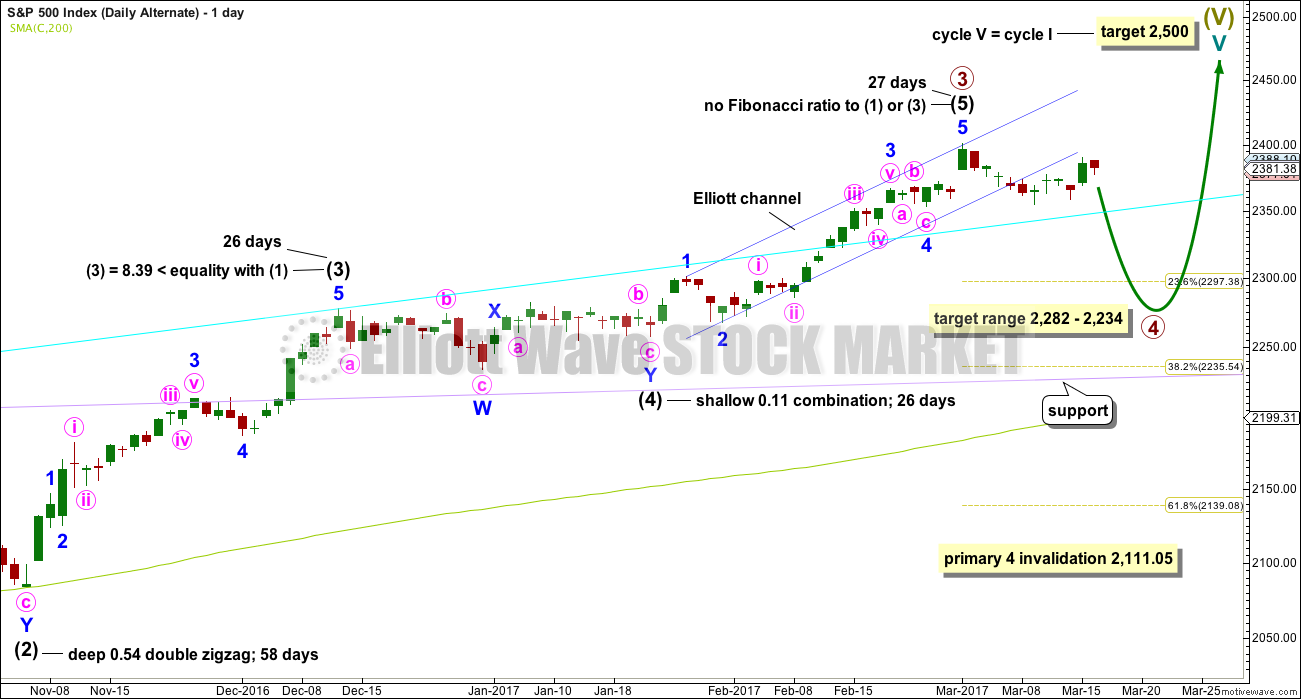
The subdivisions of upwards movement from the end of intermediate wave (2) are seen in the same way for both wave counts. The degree of labelling here is moved up one degree, so it is possible that primary wave 3 could be over.
Primary wave 2 was a flat correction lasting 47 days (not a Fibonacci number). Primary wave 4 may be expected to most likely be a zigzag, but it may also be a triangle if its structure exhibits alternation. If it is a zigzag, it may be more brief than primary wave 2, so a Fibonacci 21 sessions may be the initial expectation. If it is a triangle, then it may be a Fibonacci 34 or 55 sessions.
Intermediate wave (3) is shorter than intermediate wave (1). One of the core Elliott wave rules states a third wave may never be the shortest wave, so this limits intermediate wave (5) to no longer than equality in length with intermediate wave (3). If intermediate wave (5) is now over, then this rule is met.
Minor wave 3 has no Fibonacci ratio to minor wave 1. If minor wave 5 is now over, then it is 4.14 points longer than equality in length with minor wave 3.
Intermediate wave (5) may have ended in 27 days, just one longer than intermediate waves (3) and (4). This gives the wave count good proportions.
The proportion here between intermediate waves (2) and (4) is acceptable. There is alternation. Both are labelled W-X-Y, but double zigzags are quite different structures to double combinations.
The following correction for primary wave 4 should be a multi week pullback, and it may not move into primary wave 1 price territory below 2,111.05.
TECHNICAL ANALYSIS
WEEKLY CHART
Click chart to enlarge. Chart courtesy of StockCharts.com.
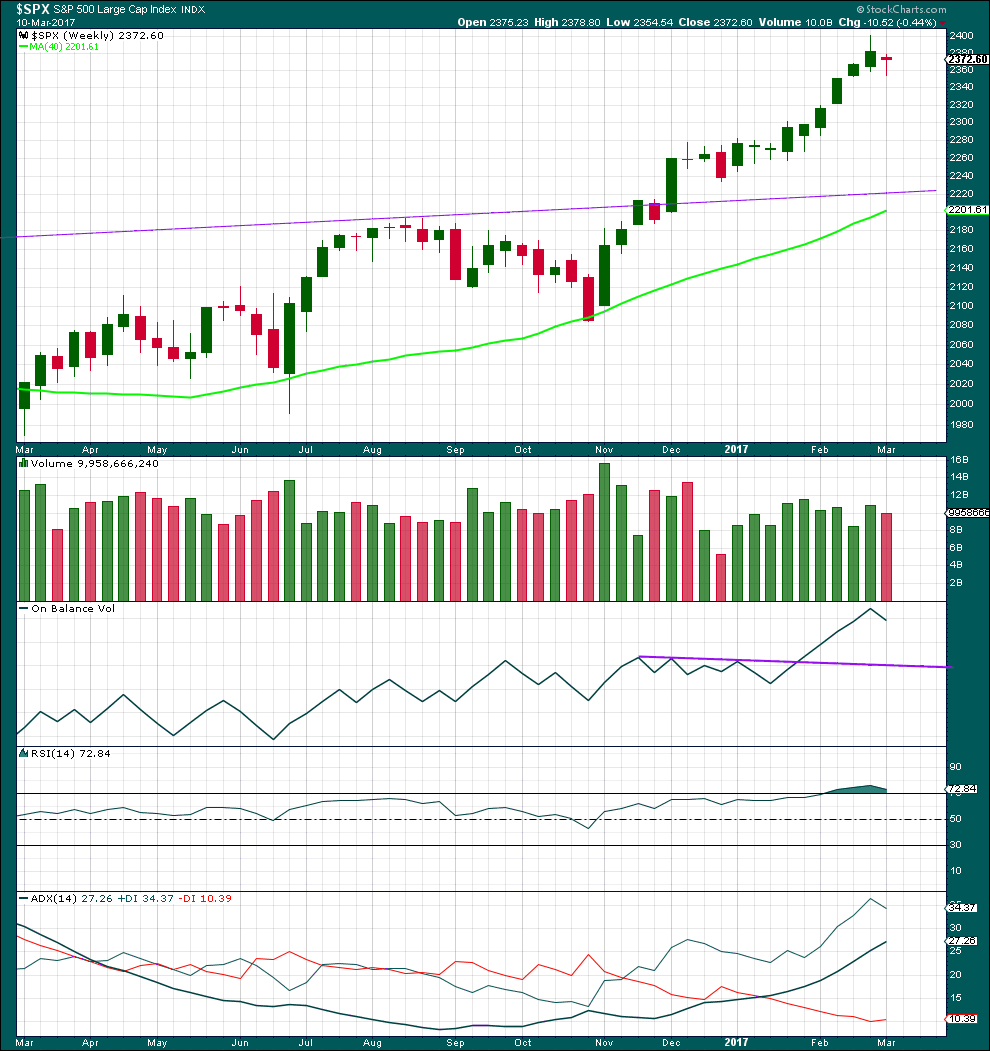
Last week completes a red doji, which moved price lower, after nine green weekly candlesticks in a row. The trend has changed from up to neutral. Volume is lighter this week and the fall in price is not supported by volume. This looks like a pause within a trend and not a new trend.
There is a long way for On Balance Volume to go to find support.
RSI may now return from oversold.
ADX did not reach extreme. There is room for the trend to continue further.
DAILY CHART
Click chart to enlarge. Chart courtesy of StockCharts.com.
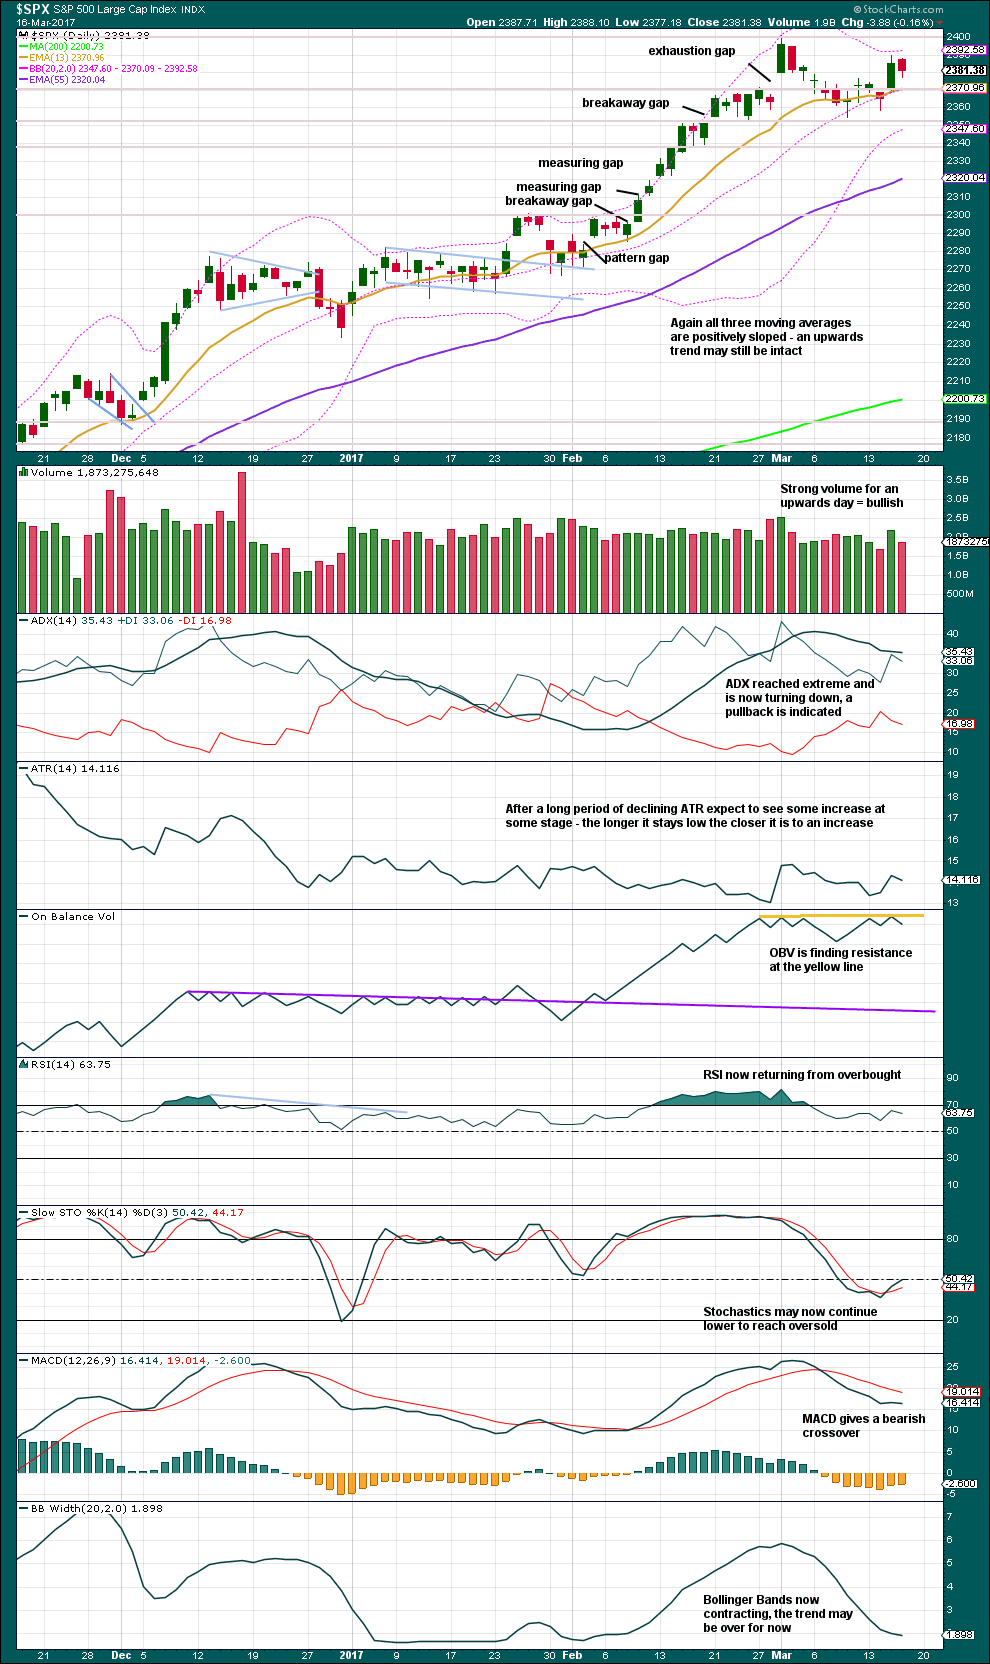
Price is still range bound with resistance about 2,400 and support about 2,355. So far, during this period, it is the upwards day for yesterday which has strongest volume suggesting an upwards breakout is more likely.
Downwards movement today with lighter volume looks corrective. The fall in price did not have support from volume.
This correction has still not brought ADX down from extreme; it is still above 35 and above both directional lines. A reasonable expectation is that this correction is incomplete, that range bound movement is likely to continue for a few more days if not weeks to bring ADX down, so that a trend can again develop.
The yellow trend line for On Balance Volume has now been tested five times, is horizontal, and is now somewhat long held. It now has good technical significance. The turn down today is a bearish signal which supports the Elliott wave count. A break above this line would now be a strong bullish signal.
VOLATILITY – INVERTED VIX CHART
Click chart to enlarge. Chart courtesy of StockCharts.com.
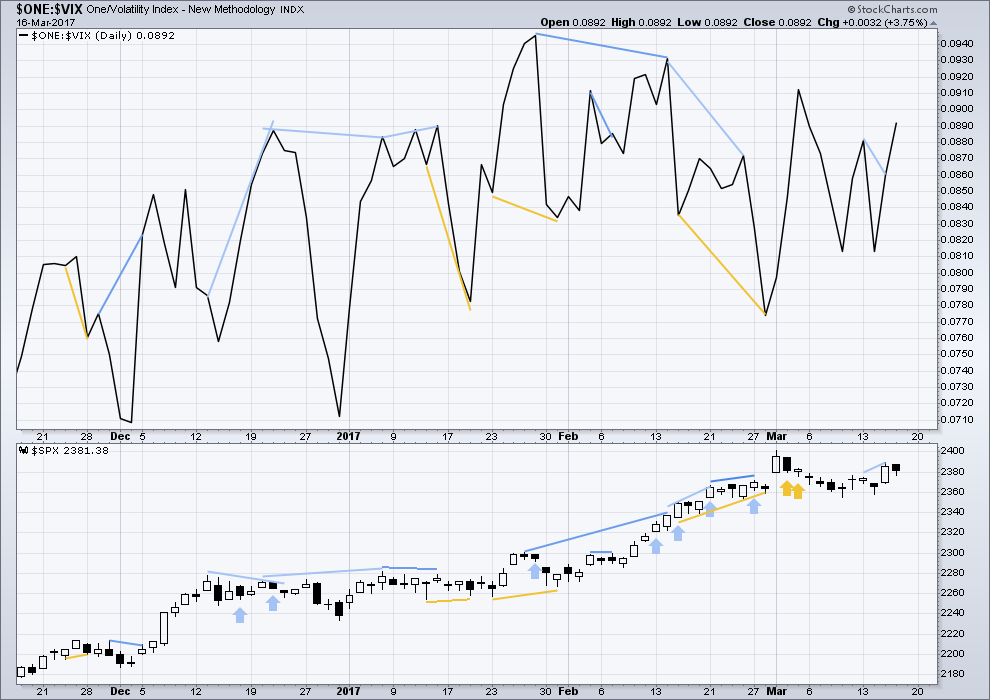
Normally, volatility should decline as price moves higher and increase as price moves lower. This means that normally inverted VIX should move in the same direction as price.
Bearish divergence and bullish divergence spanning a few short days used to be a fairly reliable indicator of the next one or two days direction for price; normally, bearish divergence would be followed by one or two days of downwards movement and vice versa for bullish divergence.
However, what once worked does not necessarily have to continue to work. Markets and market conditions change. We have to be flexible and change with them.
Recent unusual, and sometimes very strong, single day divergence between price and inverted VIX is noted with arrows on the price chart. Members can see that this is not proving useful in predicting the next direction for price.
Divergence will be continued to be noted, particularly when it is strong, but at this time it will be given little weight in this analysis. If it proves to again begin to work fairly consistently, then it will again be given weight.
Bearish divergence noted in yesterday’s analysis has been followed by a red daily candlestick. This divergence may now be considered to have worked for the very short term prediction of price direction.
Price moved overall lower on an inside day with the balance of volume downwards. But as price moved lower VIX showed a decline in volatility, which is not normal. However, no weight will be given to this bullish signal as it has proven to be unreliable lately and in this case is not strong because price did not make a new low.
BREADTH – AD LINE
Click chart to enlarge. Chart courtesy of StockCharts.com.
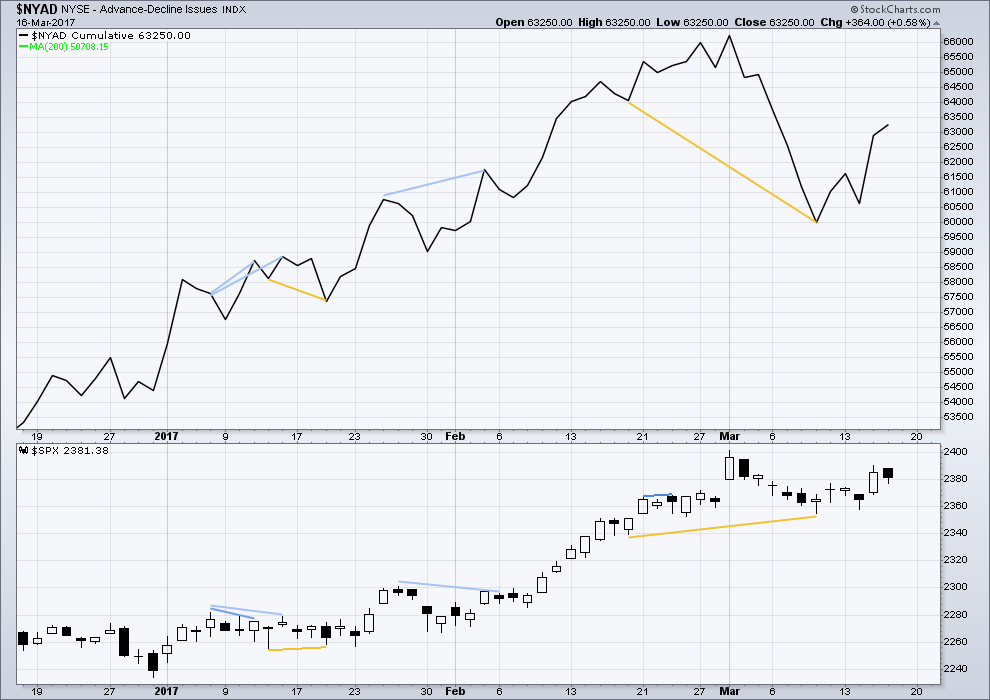
The rise in price has support from a rise in market breadth. Lowry’s OCO AD line also shows new highs along with price. Normally, before the end of a bull market the OCO AD line and the regular AD line should show divergence with price for about 4-6 months. With no divergence, this market has support from breadth.
The AD line moved higher while price moved a little lower to close red with the balance of volume downwards. The small fall in price today was accompanied by an increase in market breadth. This divergence is interpreted as bullish; today there was weakness within price.
DOW THEORY
The DJIA, DJT, S&P500 and Nasdaq continue to make new all time highs. This confirms a bull market continues.
This analysis is published @ 07:57 p.m. EST.
I finally found a guy (Bob Kudla) who understands how the algorithms that short volatility work, and yes, they do exist!
I always knew it. The readings we are seeing are wholly un-natural and in my view tell an ominous tale of things going on behind the scenes. Apparently a low volatility environment is a trigger for other algos to maintain leverage as well as reduce hedging protection ( makes perfect sense this would produce an F’d up put call ratio!). Here is the skinny…volatility CANNOT be permanently shorted and the way they have been doing it will require those trades to eventually be unwound and the machines they have been spoofing are going to run wild. This it totally nuts! I have an awful lot or reading to to this weekend and will keep everyone posted on what I learn. Take care.
Wow. That would explain rather a lot…
And yeah, that’s really ominous! When this all unwinds it could be explosive
All the lights went on when I heard that interview with Kudla. He used to be an M&A specialist with a specialty in risk management and he simply cannot believe what has been going on. He was giving some incredible and very specific information about the the timing and consistency of the algos and said he had never ever seen anything like it. He also said that when the algos switch to “risk off” mode as volatililty eventually charges back to the mean the cascade of selling is going to be hard to contain as volatility determines the level of risk that risk management departments of brokerage houses allow – as volatility rises they will insist that positions be liquidated and this can lead to a domino effect. He said this was exactly what happened in 1987. I thought that was interesting since the level of optimism we are now seeing was only exceeded four other times recently, two of them being in that year.
That’s all she wrote!
Have a great weekend everyone. Be sure and spend time with friends and family and enjoy life away from the banksters! 🙂
Thanks Verne
Another blaring ad in my inbox: Special buy alert!! “DOW 25,000.00 here we come!!” 🙂
Can someone please tell me what time (in GMT please) the markets close tonight now that clocks have changed in the US? I always get a bit confused when closing is on a Friday compared to the rest of the week.
I about half an hour from this post…
I think about 8.00 p.m GMT
The time stamps on comments is EST, and it’s adjusted for daylight savings. So right now it’s 3:49pm EST
Has anyone been following the story of the gigantic cocaine drug bust in the Caribbean the last few weeks? There has been absolutely nothing from the MSM about this. Apparently the island of St Vincent spent hundreds of millions on building a new airport that took its first charter delivery from Mexico a few weeks back. A fishing vessel, “Lady Michelle” docked at the harbour at the time of the charter delivery, and apparently under surveillance by the U.S Coast Guard, was subsequently disabled by a Navy electronic warfare plane off the coast of Suriname in international waters, and later boarded by the Coast Guard, with recovery of 4 tonnes of cocaine. There are some other interesting twists to this story I am still trying to confirm but there has been very little in the news about this.
I know I sound like a broken record. I also am aware we are looking at a market filled with broken metrics. Having said that, the volatility readings are suggesting to me that this is a much more dangerous market than it appears at a casual glance. Frankly, this kind of volatility extreme is what one generally sees on the second wave retrace after a top is in, where there is startling divergence as price makes a lower high, and volatility makes a lower low. The other possibility is that we are going to see price continue to move up inside the parabola. Something’s gotta give…!
Minor 4 continues it’s slow move. I’m labelling it as a zigzag still, but it could be a triangle too. The labelling within it could possibly change.
And that right there folks is the danger in trying to trade a correction. When price is range bound and consolidating it moves from support to resistance and back again, but not in a straight line. The number of Elliott wave structures a fourth wave can be is over 23. While I’m labelling this one as a zigzag and that does have a good probability, that doesn’t mean it has 100% probability.
Anyhoo… still expecting it’s most likely (about 80%?) to be a zigzag and end at the lower edge of the blue channel. It can’t do that in just one day unless something magic happens, so it’s going to be longer in duration than a Fibonacci 13 days. 21 maybe?
And now I’m off to re-set trap lines in a Kiwi zone. Looking to see if we’ve caught any possums, ferrets, stoats, weasels, rats or cats. Last time I found one rat, one cat and one huge possum. Ugh.
Bush crashing up darn mountains for about 3-5 hours, for the best possible cause, to protect Kiwi. Chicks are still young, a couple hatched just a couple of weeks ago so they’re very vulnerable.
Analysis will be done this evening (NZ time) or tomorrow, so a bit later than usual. Thank you for your patience all.
Tim Knight made a comment a few weeks ago that really made me smile.
He said when the bear market arrives he is not sure that even he is going to like it.
To really appreciate the irony of the statement you have to understand that Tim loves to trade the “dark side”, as I do. Markets do, after all, tend to fall faster than they rise.
It is truly amazing to hear all the talk about DJI 40,000.000 and SPX 3,000.00 with S&P trailing PEs at a whopping 26 plus! It is also admittedly truly remarkable how the market seems entirely oblivious to any risk whatsoever, either geo-political or macro-economic. This un-believeably bloated blob of manipulation and mal-investment seems totally immune to any day or reckoning does it not?
Nevertheless, there is nothing new under the sun, what has been, is what will be.
Some folk have the patience to patiently await the inevitable and plan accordingly, others…. they eventually drink the Kool-Aid and join the mantra- “This time is different!” 🙂
Yep. When lots of people are saying “this time it’s different” the top is close.
Here in NZ we have a property market bubble, and it’s not so much the “this time it’s different” but “NZ property has never crashed and so will never crash ever”. International examples of property market bubbles vs NZ property market are dismissed, because our market is different.
Yeah, right.
Some kind of triangle underway. We should see a sharp move out of it and while I hope it is up, it may not be…
the market is stagnant!!
Zzzzzzzzzz!!!……
I am hoping this most likely fourth wave completes imminently and we get a sharp quick fifth wave up which I think will be a significant top. It is looking very unlikely that we will get any kind of serious correction before another spike up, which I think will be short and sweet! Looks to me like the proverbial calm….
Reloading USO puts. March 31 11.00 strike @ 0.65 per contract 50 contracts
I’m waiting to get back into this one too Verne.
If SVXY prints a red doji above the BBs today:
Don’t think
Just Drink! 🙂
Buying to open FXE 104 strike March 24 calls. Filled at 0.50, 100 contracts….
Bought to open March 24 SVXY 141.0 strike puts at 2.58, 100 contracts.
Keeping a sharp eye on 142 puts expiring today. If we get a C wave down that would be an easy triple….
W.D Gann has done some interesting research on the characteristics of what he called runaway legs up in bull markets, and we are clearly in one at the moment. About 38% of all bull markets end with runaway legs higher.
With regard to duration, terminal runaway moves generally (77%) end in less than five months, and we will be there by April 4th.
Runaway legs in 1929 gained 32%, in 1987 22% and currently we are at about 15%.
From a point of view of sentiment Flannagan recorded only four other recent instances of sentiment higher than we are currently seeing, two of these instances being in 1987!
Several folk have observed the remarkable absence of any significant corrections in the current run higher and in my view the longer this continues, the stronger the case becomes for a terminal run underway worthy of serious consideration. I had opined in a non-technical kind of way that the banksters were “all-in”, and any serious decline that occurred would be taking place in spite of their best efforts, and suggest they had lost their ability to keep the market propped up. Gann has acutually formulated a rule for this that I think is interesting. He states that the first time you exceed the largest minor correction during the runaway leg higher, (currently about 2%), that is a sell signal. The first decline at the end of a terminal runaway leg higher is typically 20%, and probably explains why an analyst I read a few weeks ago argued that what we get next was not just going to be a “correction”. Yesterday, March 17, we equalled the duration of the great bull run of the twenties. Long live the bull…maybe! 🙂
Thank you for sharing this Verne.
It looks to me that Dow Theory may come in rather handy, it would need a new low below the prior major low in the bull market from DJT, DJIA and I’ll add SPX and Nasdaq.
Now, that is more than the last minor correction so it would have confirmation a lot later, but the basic principle is the same. New lows.
Tulip bulbs for sale, tulip bulbs for sale. Get them while they’re red hot. Hmmm … where are all those Greater Fools. You know, the ones who expect this tree will grow to the moon.
Now, don’t get me wrong on tulips. I like them and planted about 360 last Fall. My wife, though, was sure that she had married the Greatest Fool. :-]
Chuck
Tiptoe through the window
By the window, that is where I’ll be
Come tiptoe through the tulips with me…! 🙂
WADR to Tiny Tim…
What’s up Doc? 🙂
dat darn wabbit
You guys are hilarious 🙂
Bugs? Very bunny.