
An upwards day was expected for Friday. Price made a lower low and lower high, the definition of a downwards day, but the session closed green.
Price remains above the near by invalidation point on the hourly Elliott wave count.
Summary: Aggressive and more risk tolerant traders may like to trade this last wave up before a larger pullback arrives. Stops may be set just below 2,371.54. The target is at 2,424 and the limit is at 2,450.76.
If price makes a new low below 2,371.54, exit all long positions because a deeper pullback may have arrived.
Always follow my two Golden Rules:
1. Always use a stop.
2. Invest only a maximum 1-5% of equity on any one trade.
New updates to this analysis are in bold.
Last monthly and weekly charts are here. Last historic analysis video is here.
MAIN ELLIOTT WAVE COUNT
WEEKLY CHART
Click chart to enlarge.
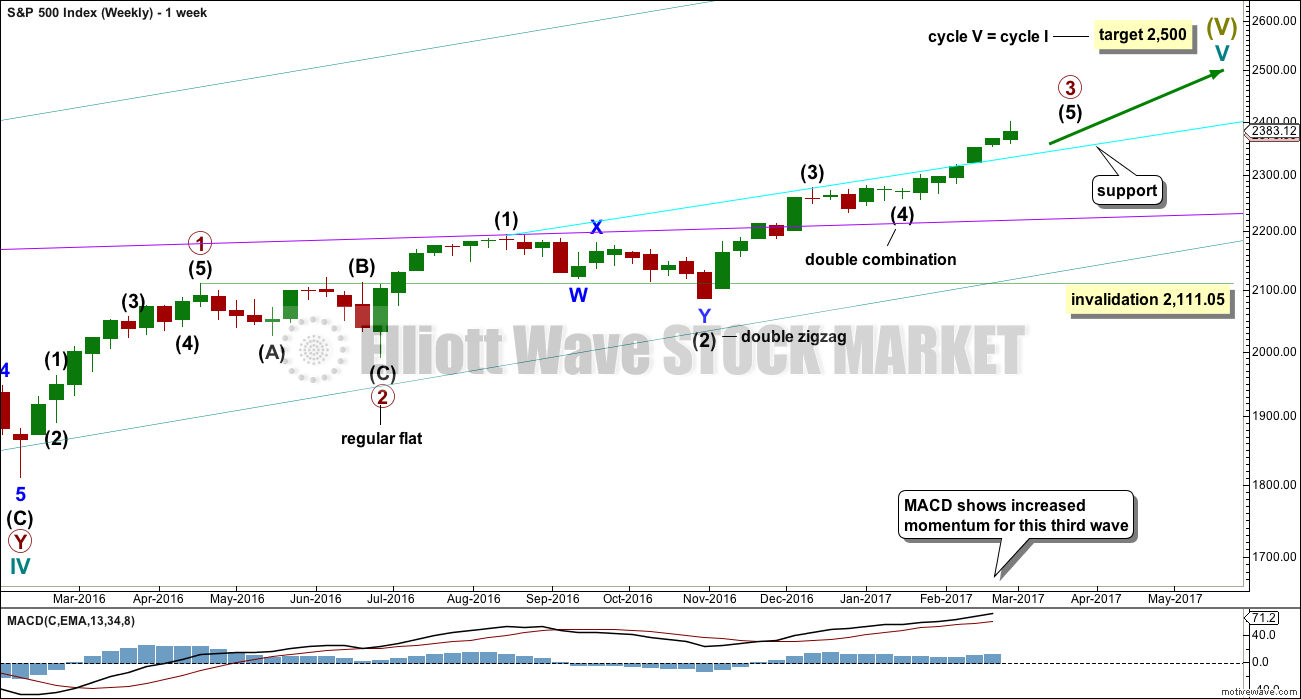
Cycle wave V is an incomplete structure. Within cycle wave V, primary wave 3 may be relatively close to completion.
When primary wave 3 is complete, then the following correction for primary wave 4 may not move into primary wave 1 price territory below 2,111.05.
Primary wave 2 was a flat correction lasting 47 days (not a Fibonacci number). Primary wave 4 may be expected to most likely be a zigzag, but it may also be a triangle if its structure exhibits alternation. If it is a zigzag, it may be more brief than primary wave 2, so a Fibonacci 21 sessions may be the initial expectation. If it is a triangle, then it may be a Fibonacci 34 or 55 sessions.
Primary wave 3 is now close to complete.
DAILY CHART
Click chart to enlarge.
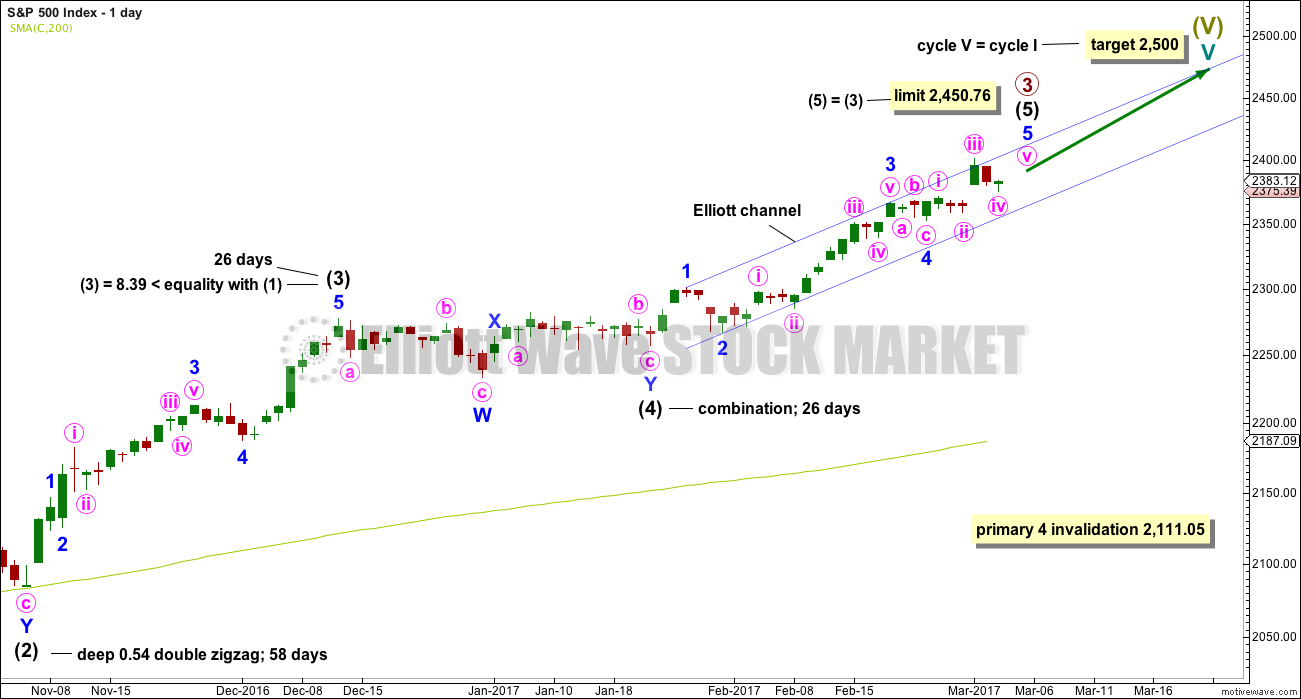
Intermediate wave (3) is shorter than intermediate wave (1). One of the core Elliott wave rules states a third wave may never be the shortest wave, so this limits intermediate wave (5) to no longer than equality in length with intermediate wave (3) at 2,450.76.
Minor wave 3 has no Fibonacci ratio to minor wave 1. It is more likely that minor wave 5 will exhibit a Fibonacci ratio to either of minor waves 3 or 1.
Minor wave 2 was a deep 0.77 zigzag lasting three days. Minor wave 4 may be a complete single flat correction. There is perfect alternation between minor waves 2 and 4 and they have better proportion now on the daily chart.
Intermediate wave (5) has so far lasted 28 days. At this stage, an expectation of a Fibonacci 34 days total for intermediate wave (5) looks reasonable, so it may now continue for another 6 days or sessions.
The proportion here between intermediate waves (2) and (4) is acceptable. There is alternation. Both are labelled W-X-Y, but double zigzags are quite different structures to double combinations.
Minor wave 5 is very close to completion; it is possible that it could any day now. When it is complete, then that would complete for this wave count the entire wave of primary 3. The following correction for primary wave 4 should be a multi week pullback, and it may not move into primary wave 1 price territory below 2,111.05.
HOURLY CHART
Click chart to enlarge.
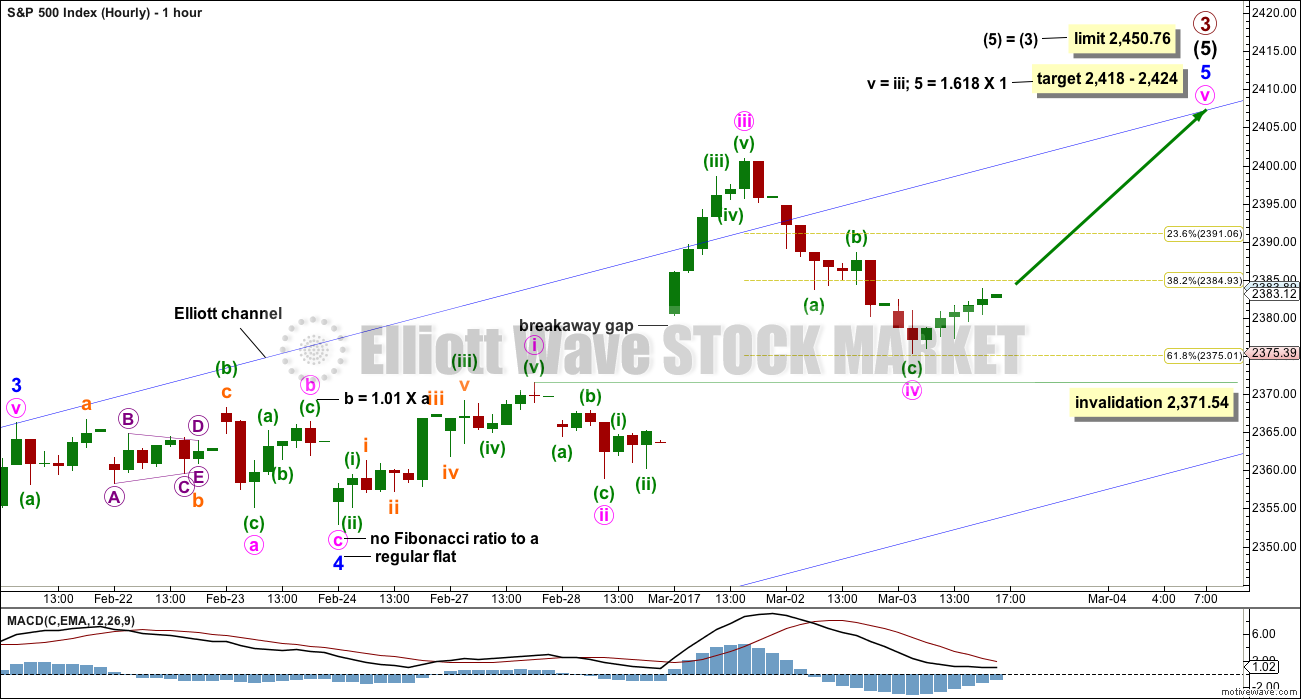
Another breakaway gap should provide support while the trend continues. So far this gap is providing support. If it is closed, then it would be possible that primary wave 3 could be over. That would indicate a substantial trend change.
There is no Fibonacci ratio between minute waves iii and i.
Minor wave 5 has passed equality with minor wave 1 and the structure is incomplete. The next likely target for minor wave 5 would be 1.618 the length of minor wave 1.
The target is widened to a 6 point zone. Minute wave v should be longer than minute wave i to avoid a truncation. A target at 2,418 is close to the target calculated at minor degree, so this has a higher probability. The lower end of the zone is favoured because it is calculated at a lower degree.
Minute wave iv may not move into minute wave i price territory below 2,371.54.
At this stage, invalidation of this hourly wave count would indicate primary wave 3 may be over and primary wave 4 may have begun.
ALTERNATE DAILY CHART
Click chart to enlarge.
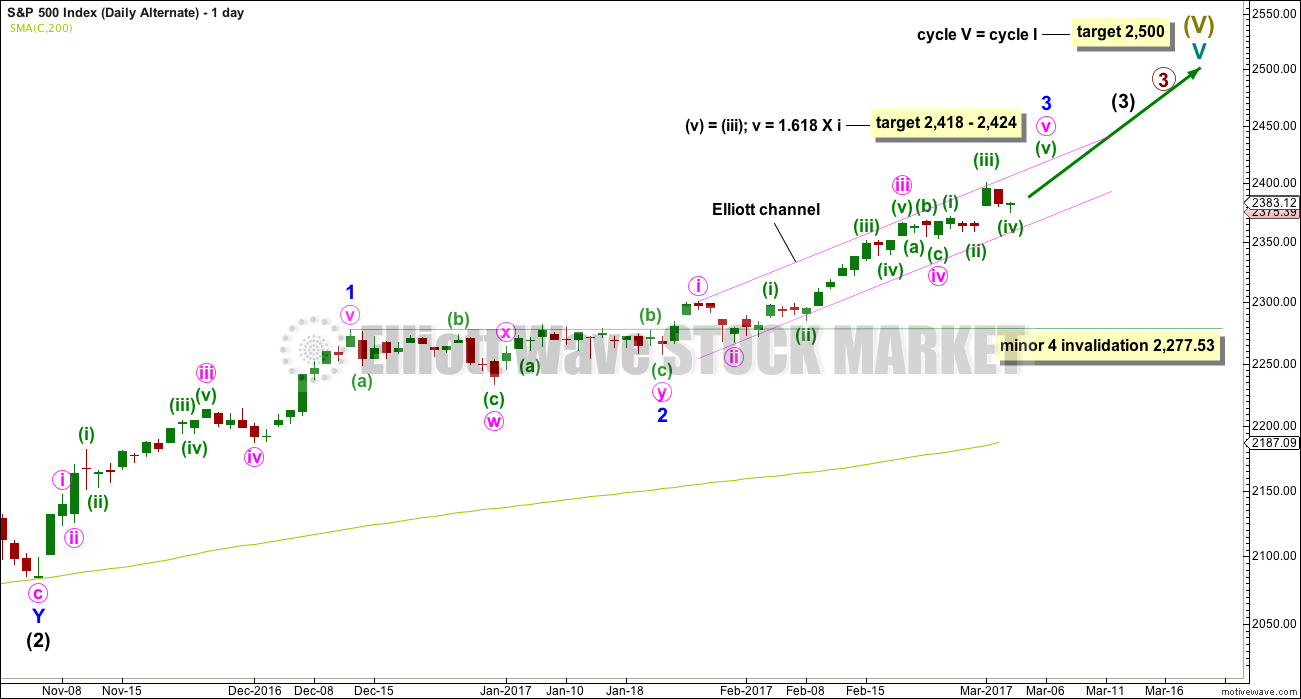
What if recent strong upwards movement was the middle a third wave at three degrees? This is supported by a fairly bullish look for the classic technical analysis chart.
All subdivisions are seen in exactly the same way for both daily wave counts, only here the degree of labelling within intermediate wave (3) is moved down one degree.
This alternate also expects an upcoming correction, but for minor wave 4, that may not move into minor wave 1 price territory below 2,277.53. A new low below this point would confirm the correction could not be minor wave 4 and that would provide confidence it should be primary wave 4.
Both wave counts expect essentially the same direction next, so the hourly chart for this alternate would look the same with the exception of the degree of labelling. The short term target zone is also the same.
TECHNICAL ANALYSIS
WEEKLY CHART
Click chart to enlarge. Chart courtesy of StockCharts.com.
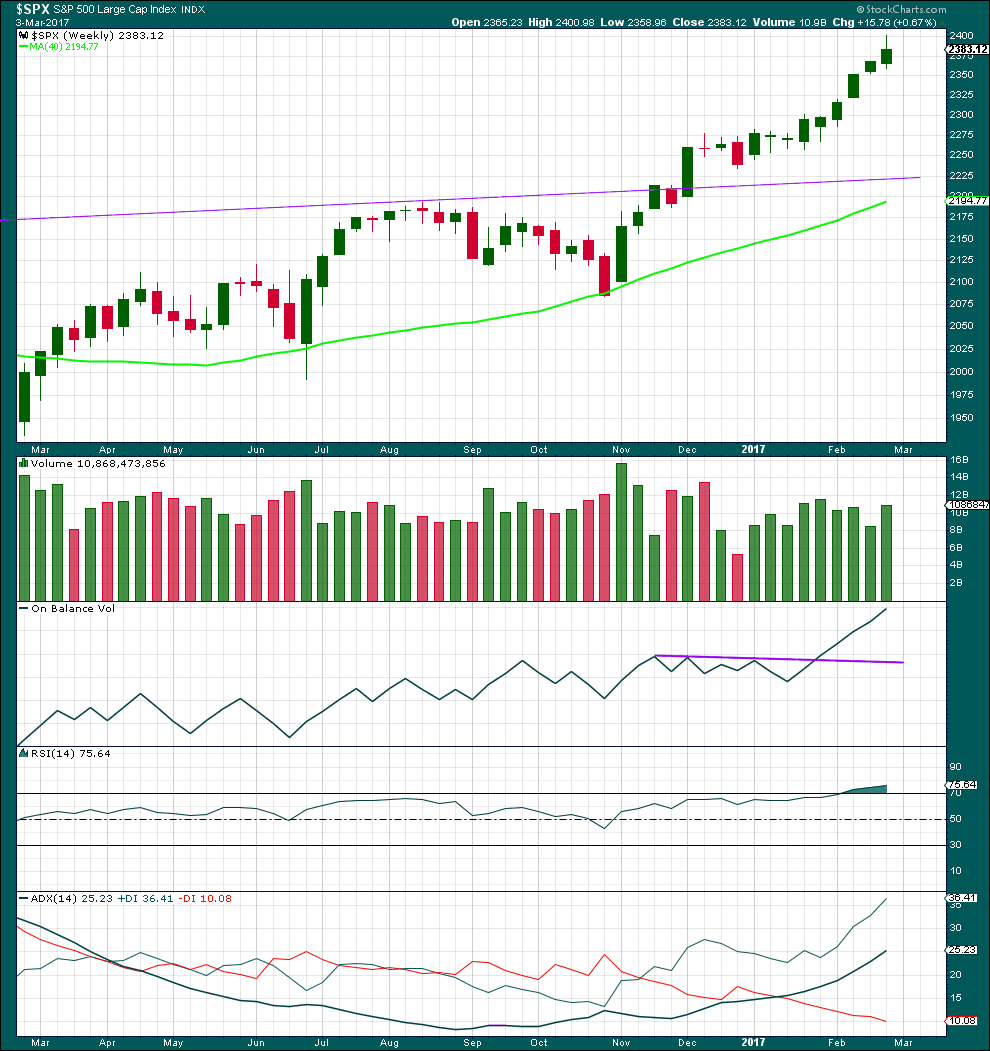
There are now nine green weekly candlesticks in a row. A larger correction may be expected soon.
Volume this week is stronger than the three weeks prior. There was good support this week for upwards movement.
On Balance Volume remains very bullish.
RSI is overbought, but in a bull market this can remain extreme for a reasonable period of time. If it begins to exhibit divergence with price at the weekly chart level, then a larger correction may be expected to begin. There is no divergence at this time.
This trend is not yet extreme.
DAILY CHART
Click chart to enlarge. Chart courtesy of StockCharts.com.
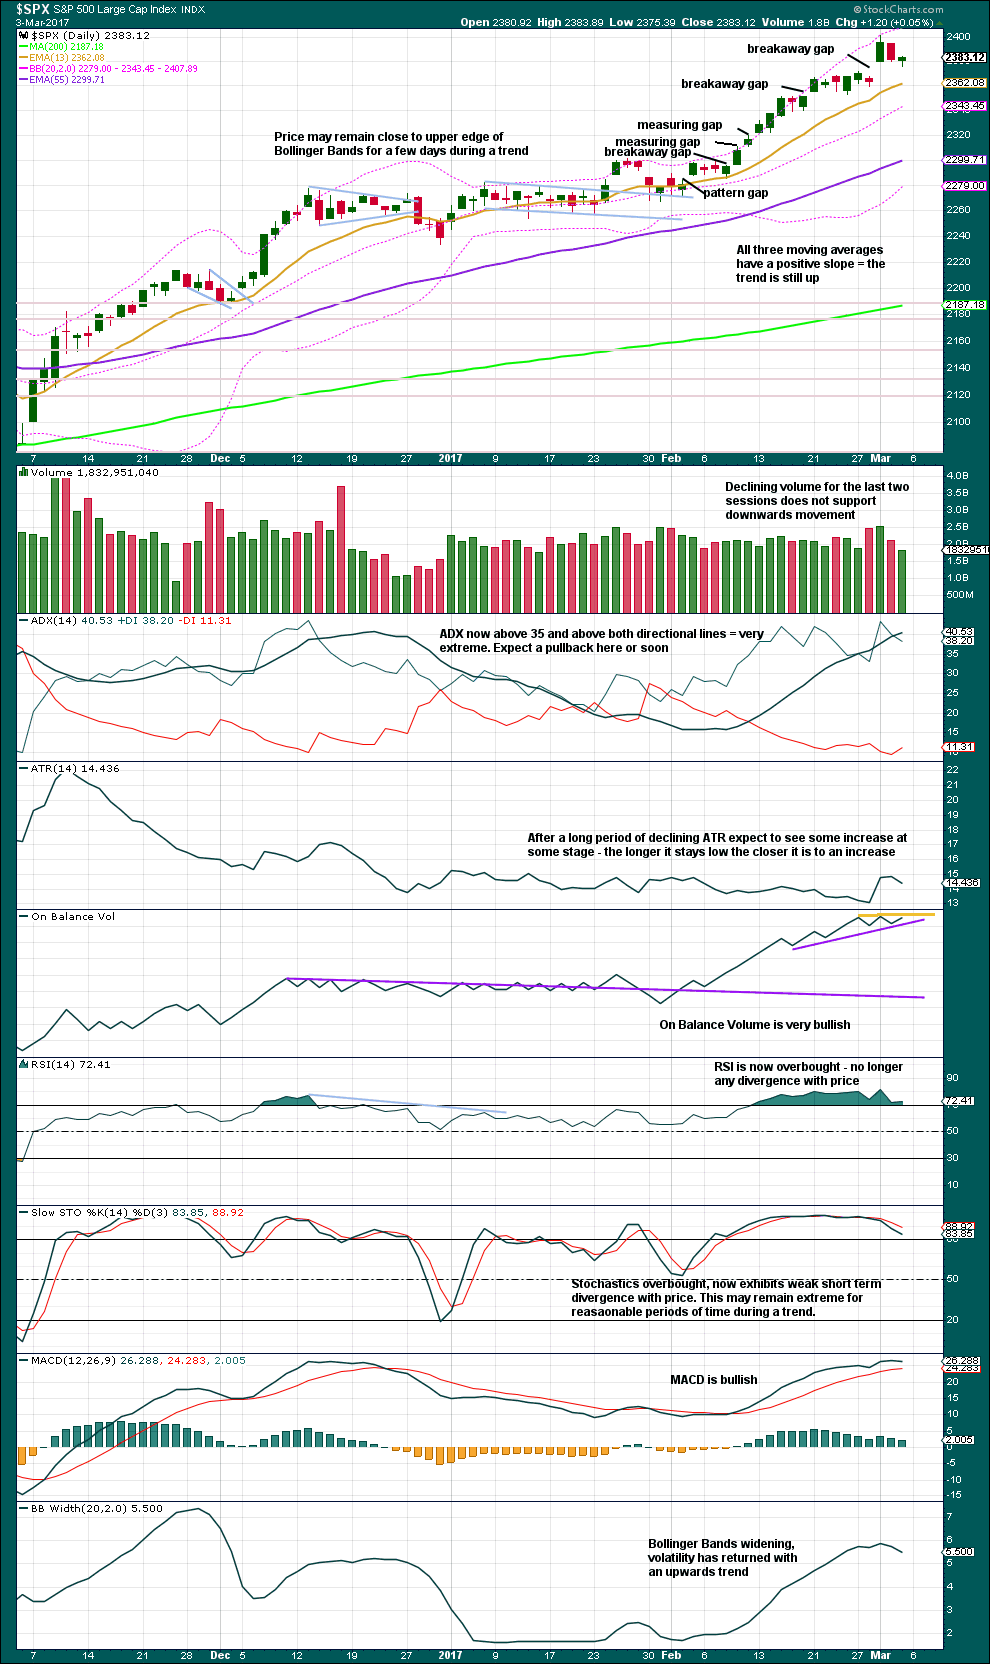
Friday saw overall downwards movement and a decline in volume. However, the session closed green and the balance of volume was upwards. This is bearish; there was not good support during the session for upwards movement.
ADX is now very extreme. Traders are advised to be very cautious with long positions.
Look out for a pullback soon. If the last breakaway gap is closed, then expect a pullback has begun. Stops may be moved up to the lower edge of the breakaway gap.
VOLATILITY – INVERTED VIX CHART
Click chart to enlarge. Chart courtesy of StockCharts.com.
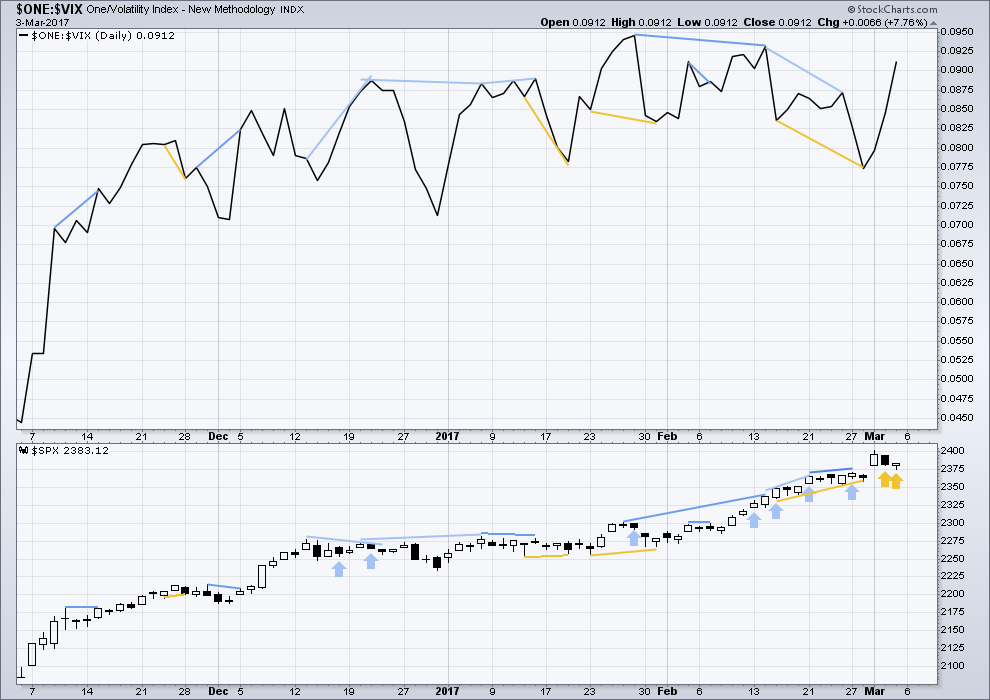
Normally, volatility should decline as price moves higher and increase as price moves lower. This means that normally inverted VIX should move in the same direction as price.
Bearish divergence and bullish divergence spanning a few short days used to be a fairly reliable indicator of the next one or two days direction for price; normally, bearish divergence would be followed by one or two days of downwards movement and vice versa for bullish divergence.
However, what once worked does not necessarily have to continue to work. Markets and market conditions change. We have to be flexible and change with them.
Recent unusual, and sometimes very strong, single day divergence between price and inverted VIX is noted with arrows on the price chart. Members can see that this is not proving useful in predicting the next direction for price.
Divergence will be continued to be noted, particularly when it is strong, but at this time it will be given little weight in this analysis. If it proves to again begin to work fairly consistently, then it will again be given weight.
During Friday price moved lower, but the session closed green and the balance of volume was up. Volatility declined. This would normally be read as bullish.
BREADTH – AD LINE
Click chart to enlarge. Chart courtesy of StockCharts.com.
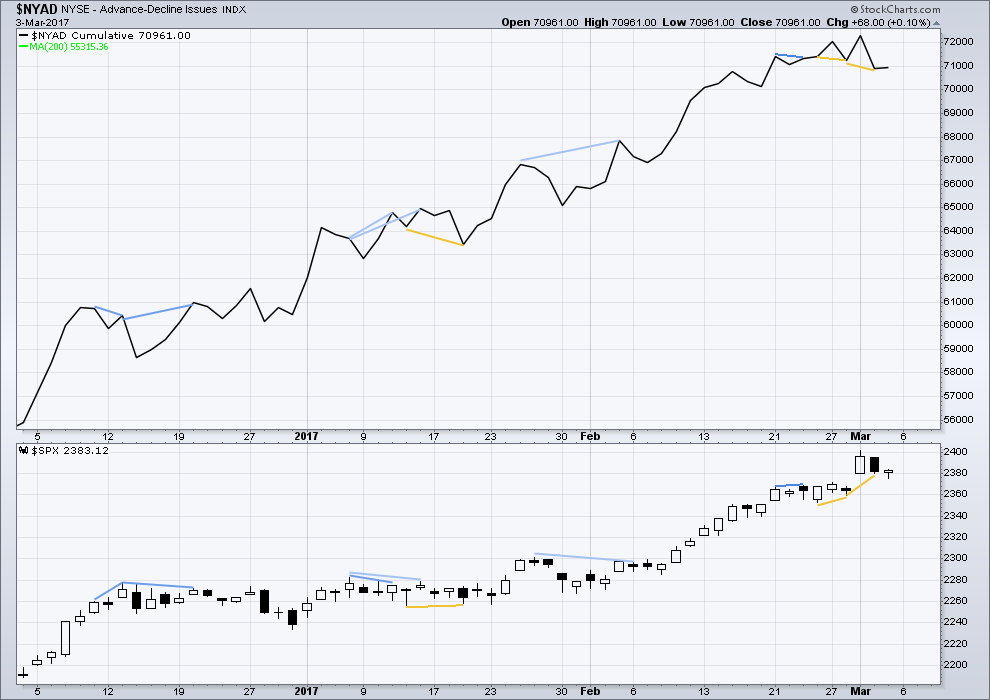
The rise in price has support from a rise in market breadth. Lowry’s OCO AD line also shows new highs along with price. Normally, before the end of a bull market the OCO AD line and the regular AD line should show divergence with price for about 4-6 months. With no divergence, this market has support from breadth.
Short term bullish divergence noted in yesterday’s analysis has not been followed by upwards movement. However, price did rebound strongly at the end of Friday’s session. This divergence may yet be resolved by an upwards day on Monday.
While divergence between price and inverted VIX does not appear to be working well lately, it is still working well for the AD line. Any divergence between price and the AD line will be given more weight at this time.
DOW THEORY
The DJIA, DJT, S&P500 and Nasdaq continue to make new all time highs. This confirms a bull market continues.
This analysis is published @ 12:35 a.m. EST on 4th March, 2017.
The gap is closed and the invalidation point on the hourly chart is breached. The fifth wave was over.
Now a fourth wave correction has likely begun.
This is either primary wave 4 to last at least two months for the main wave count, or it’s minor wave 4 to last about 2-4 weeks for the alternate wave count.
Either way a five down should develop on the hourly chart
Thanks for the update Lara. Hopefully we can start iii before the close. The markets usually don’t oblige my requests
One advantage of a “managed decline”, which is what I suspect we will see as the decline unfolds. is that it gives up plenty of time to get positioned for the new trend, unlike the kind of brutal reversal you generally see in things like EDs. To the casual glance, volatility has all but disappeared from this market and I suspect that if we are indeed going to go on to new highs, Mr Market has a lot of work to do on the downside to dispel the historic bullish glee we have seen on this leg up. While the initial decline may be leisurely, I expect it to end with a bang. I think someone said the last second wave was a zig zag so some kind of triangle or expanded flat would be a good candidate methinks…
Perplexing. The miners are diving, but now at 61.8 retrace a point where they could bounce, but in order for that to happen the stock market will probably have to go down. Silver and gold commercials have been buying shorts, which was the right thing to do since silver plunged. The question is whether or not the next move down in gold will move the miners. Could have a swift move down in gold and silver overnight followed by a move down in the stock market which washes everything out. Was hoping for a larger move down in the Spx but levitation is occurring, see if it holds up again into the close, if not might be a big down day in the markets. If so, anything is possible.
How long before we fill that gap? I’ve got a very itchy trigger finger! 😀
I saw something creepy today. I saw a very strange looking police car parked close to an ATM machine. In addition to the big letters spelling POLICE across the doors, it also had the letters DHS which I presume stand for Department of Homeland Security. I live in a University twin city so you can see four different squad cars around from the two cities, the University and the State police. What in the hell is DHS doing prowling around???
They are trying to pin down a rogue trader who is moving the markets 😉
Yikes! 🙂
One of the most commonly ignored consequences of relentless central bankster intervention in the market has been the resulting mis-pricing of risk. I was going to wait for the exhaustion gap to be filled but I think I have seen enough.
Buying one half full load of SVXY March 17 130 strike puts for limit price of 4.65.
Will add second half on gap closure at 2363.64
They are going to keep attempting to arrest the decline but they at this point I think are spitting in the wind. We already have a small island reversal with the open this morning and I suspect all their pumping will today is set the market up for a substantial gap down. We are seeing the market fall in the absence of any committed selling whatsoever. You have got to give them a “C” for “Courage”. I know some of you would rather give them an ‘”F” for….well. I’ll let you fill in the blanks. I can certainly think of a few choice descriptors! Maybe we should have a contest but I suspect that would keep Lara quite busy editing… ! 🙂
Thanks for the laugh. I needed that!
Anytime, my friend… 🙂
🙂 Yes please, no contest there. I give them an “F” for sure.
The gap is now well and truly filled, so it’s an exhaustion gap. Primary 4 looks like it’s arrived.
Or for the alternate this could just be minor 4.
2371.71 gone… next stop
According to Lara’s commentary:
“At this stage, invalidation of this hourly wave count would indicate primary wave 3 may be over and primary wave 4 may have begun.”
A retrace of 23% of Primary 3 would be about 2325. A 61.8% retracement would be about 2200. It should be somewhere in between. But also remember Lara’s remarks for the past week or so about how quickly the first part of this correction could come. Because of VIX divergence, Lara gave strong caution.
Thanks Rodney. Macd is rolling over on the qqqs. This market just looks like it is being managed. That would be a travesty in the long run. Free markets? Cmon
Absolutely! They are going to keep fighting the decline until they loose control, which itself is not a matter of if, just when….cycle trough due sometime in mid March so it could be a slow torturous move down. SVXY indicating profound complacency…
It is hard to believe, UVXY is still negative for the day while VIX is positive. Hmmm…..
A simmering volcano… stand by… 🙂
FYI everybody:
I’m not at home for the next few days. I’m in Gisborne visiting friends. So I’ll be attending to requests for extra analysis when I get back home on Friday.
There just happens to be great surf right here right now in Gisborne…. woo hoooo!
Great work again Lara. I like the daily Alternate count. In fact, I would give it at least 50% odds right now. I also am thinking the target for Cycle V will need to be moved to around 2800 or 3000 SPX. Of course, these are just guesses and only price will tell us if we are moving that high. Have a great day and remainder of the weekend.
PS to doc – Great work, 4 in a row. Unfortunately you did not make it a double header by being first on the video post as well.
Rodney
3000 really. That would put us at multiples of around 23. Anything is possible I suppose.
Rodney
Obviously you are more optimistic about the market. How do you think current ES drops much (~10 points) now? I like your post. Do you have any idea about tomorrow’s market? Will it start a big correction for now?
Thanks.
Hi David,
My thoughts about SPX 2800 or 3000 are purely speculation and based upon seeing the upward waves extend. The Alternate daily count alludes to such a possibility.
As far as what happens tomorrow and near term, my suggestion is to follow Lara’s ideas. I am not the one who should be giving such ideas. I stated last week that I closed all long positions in my short term, trading account and in my long term (non-leveraged) investing account. I let the long position ride on my mid-term (non-leveraged) account. Like Lara’s count show, I am looking for a larger correction (2200-2250) after this current Primary 3 (or Minor 3 of Alternate daily) completes.
I post my trades here because several years ago, many of the members of this blog did so to help one another learn and grow in trading skills. I appreciated it then and continue to do so now hoping it might be of some benefit. I know it benefits me when others do so.
Have a great day and week.
2200 – 2250. I’m hoping Rodney
I want see 2350 broken then I may get in
four in a row,,woo hoo
You’re on a roll Doc 🙂