
Upwards movement was not expected for Monday. The main Elliott wave count expected downwards movement for the session.
The current situation has multiple possibilities and for members today three hourly Elliott wave counts are again presented along with some cautious trading advice on how to approach this market.
Summary: It looks like tomorrow may most likely be a downwards day. Expect price to move at least slightly below 2,352.87. Repeated divergence between price and VIX shows again today and this is a strong warning to traders that there is potential here for a surprising sharp drop in prices.
New updates to this analysis are in bold.
Last monthly and weekly charts are here. Last historic analysis video is here.
MAIN ELLIOTT WAVE COUNT
WEEKLY CHART
Click chart to enlarge.
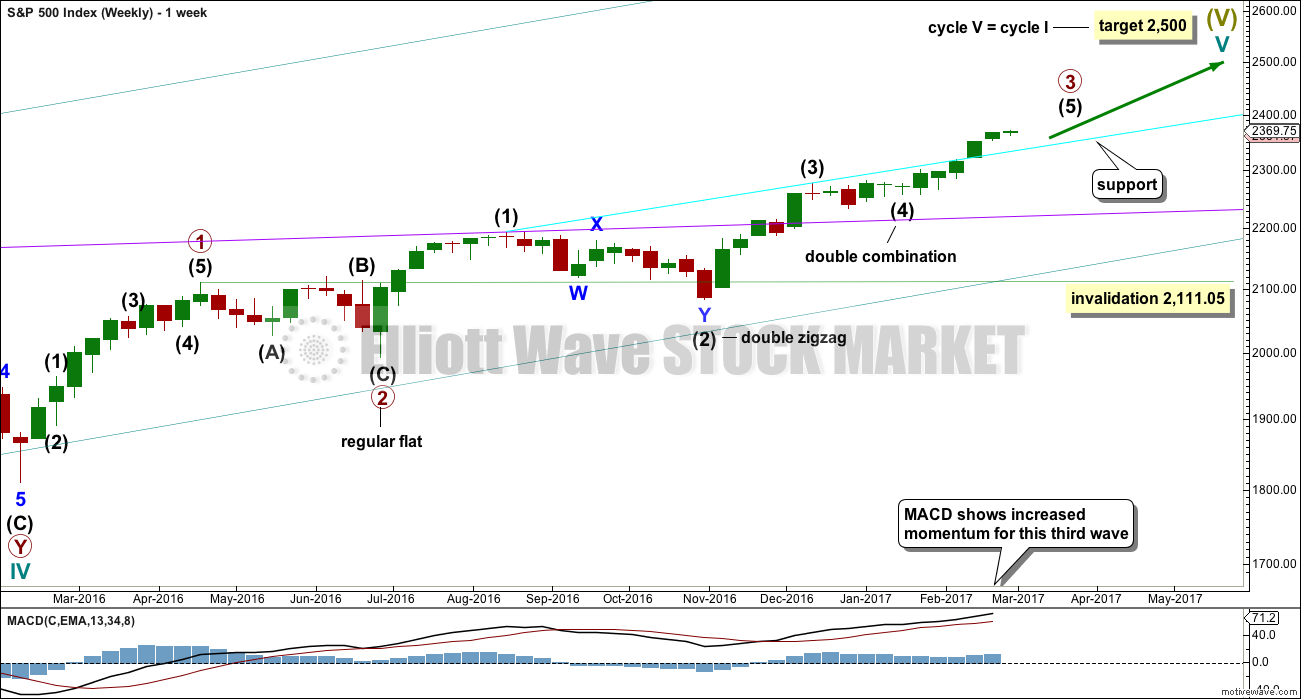
Cycle wave V is an incomplete structure. Within cycle wave V, primary wave 3 may be relatively close to completion.
When primary wave 3 is complete, then the following correction for primary wave 4 may not move into primary wave 1 price territory below 2,111.05.
Primary wave 2 was a flat correction lasting 47 days (not a Fibonacci number). Primary wave 4 may be expected to most likely be a zigzag, but it may also be a triangle if its structure exhibits alternation. If it is a zigzag, it may be more brief than primary wave 2, so a Fibonacci 21 sessions may be the initial expectation. If it is a triangle, then it may be a Fibonacci 34 or 55 sessions.
Primary wave 3 is now close to complete.
DAILY CHART
Click chart to enlarge.
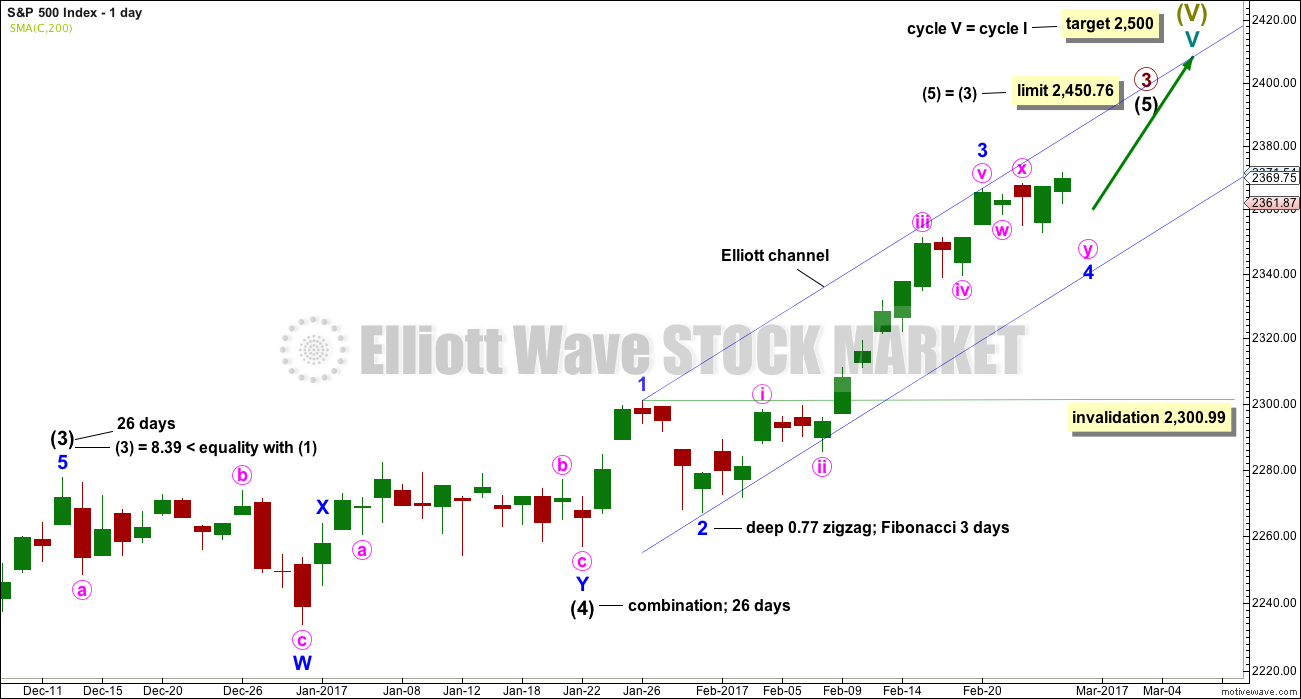
Intermediate wave (4) is a complete combination: zigzag – X – flat. It would have been even in duration with intermediate wave (3), both lasting 26 days.
Intermediate wave (3) is shorter than intermediate wave (1). One of the core Elliott wave rules states a third wave may never be the shortest wave, so this limits intermediate wave (5) to no longer than equality in length with intermediate wave (3) at 2,450.76.
Minor wave 3 has no Fibonacci ratio to minor wave 1. It is more likely that minor wave 5 will exhibit a Fibonacci ratio to either of minor waves 3 or 1. The target assumes it will exhibit the most common Fibonacci ratio.
Minor wave 2 was a deep 0.77 zigzag lasting three days. Minor wave 4 today shows more clearly on the daily chart. It may have completed as a very common expanded flat correction. There is perfect alternation between minor waves 2 and 4 and they have better proportion now on the daily chart.
Intermediate wave (5) has so far lasted 24 days. It may be expected to be shorter both in length and duration compared to intermediate wave (3). At this stage, an expectation of a Fibonacci 34 days total for intermediate wave (5) looks reasonable, so it may now continue for another 10 days or sessions.
The proportion here between intermediate waves (2) and (4) is acceptable. There is alternation. Both are labelled W-X-Y, but double zigzags are quite different structures to double combinations.
Minor wave 4 may be still incomplete. It may not move into minor wave 1 price territory below 2,300.99.
HOURLY CHART
Click chart to enlarge.
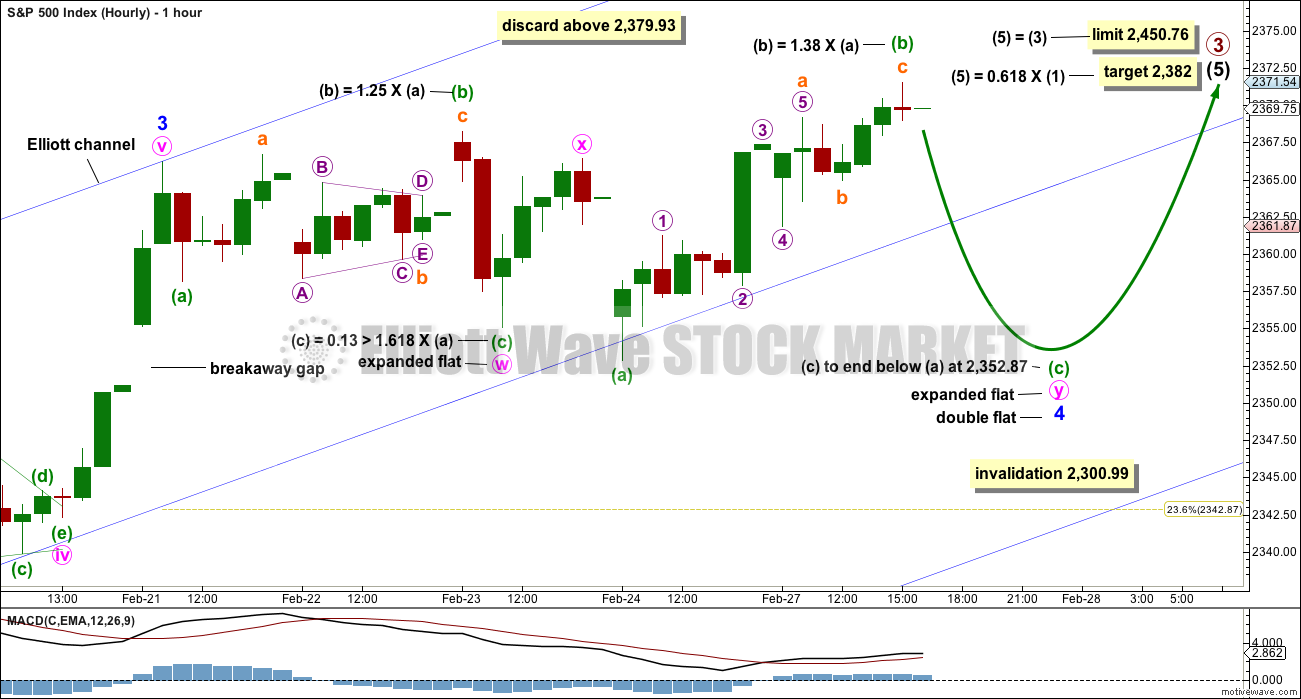
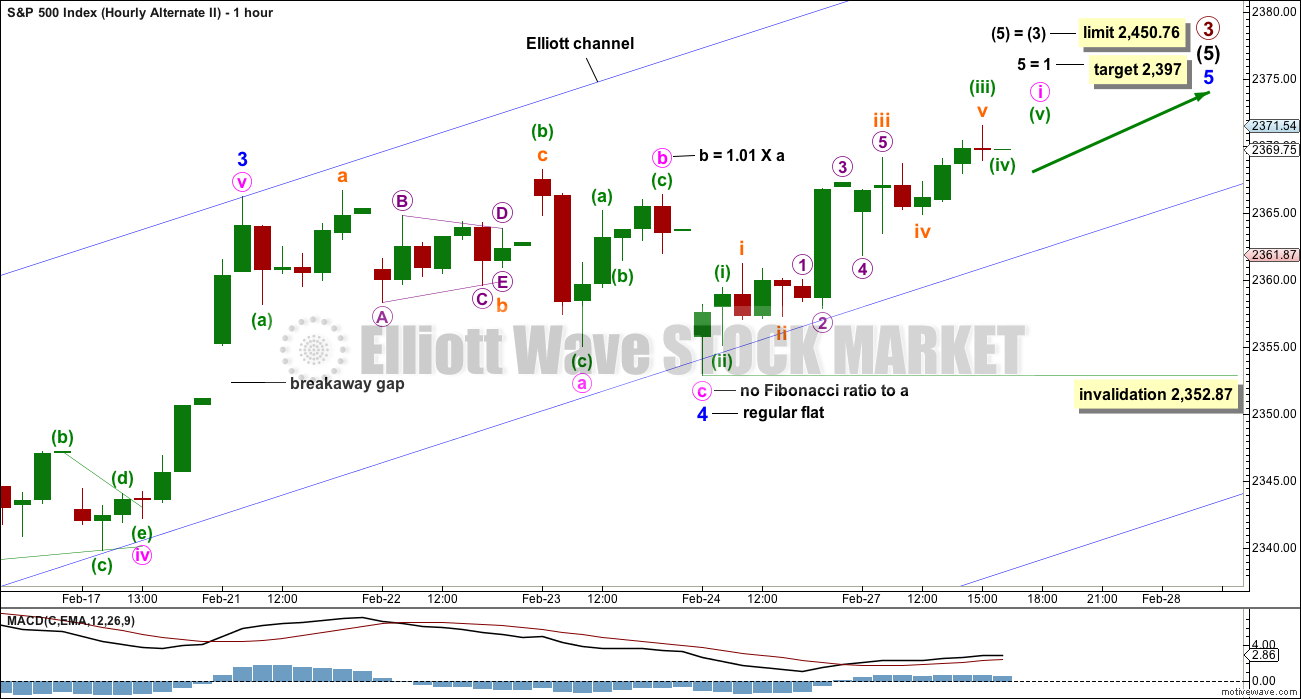
A double flat may be unfolding. No target is given for minuette wave (c) down because it is still not clear if minuette wave (b) has ended.
Within the second flat of the double labelled minute wave y, minuette wave (b) would be twice the length of minuette wave (a) at 2,379.93. Above that price point the idea of a second flat unfolding would be discarded based upon a very low probability. Unfortunately, this price point may be too high to be useful.
This wave count expects a downwards wave to move below 2,352.87, so that minuette wave (c) moves below the end of minuette wave (a) avoiding a truncation and a very rare running flat.
There is some small support today for this first wave count from light volume and divergence with VIX. For these reasons it is my judgement today that this first hourly wave count is the most likely, about 65%.
ALTERNATE HOURLY CHART
Click chart to enlarge.
Alternatively, it is possible that minor wave 4 could be a completed regular flat.
Within the regular flat, minute wave a is a three, itself a flat correction. Minute wave b is a zigzag. Minute wave c moves below the end of minute wave a.
Price does not have support from volume although it moved higher today. A new target is calculated for minor wave 5. Within minor wave 5, minute wave iv may not move into minute wave i price territory below 2,361.24.
SECOND ALTERNATE HOURLY CHART
Click chart to enlarge.
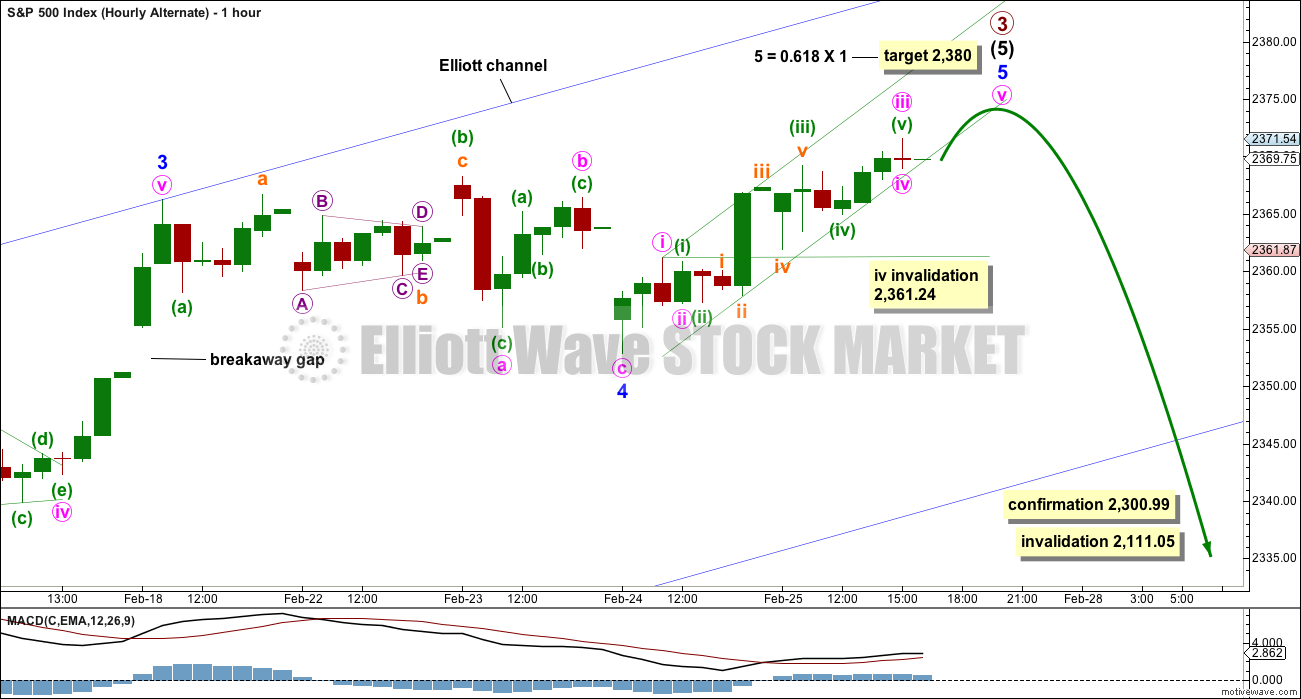
This second alternate hourly wave count is identical to the first alternate above up to the low labelled minor wave 4.
Thereafter, the upwards movement to start minor wave 5 is moved down one degree and labelled slightly differently.
The target is higher; this is a more common Fibonacci ratio for a fifth wave to exhibit, so this target may have a higher probability.
When minute wave i is complete, then minute wave ii may not move beyond its start below 2,352.87.
TECHNICAL ANALYSIS
WEEKLY CHART
Click chart to enlarge. Chart courtesy of StockCharts.com.
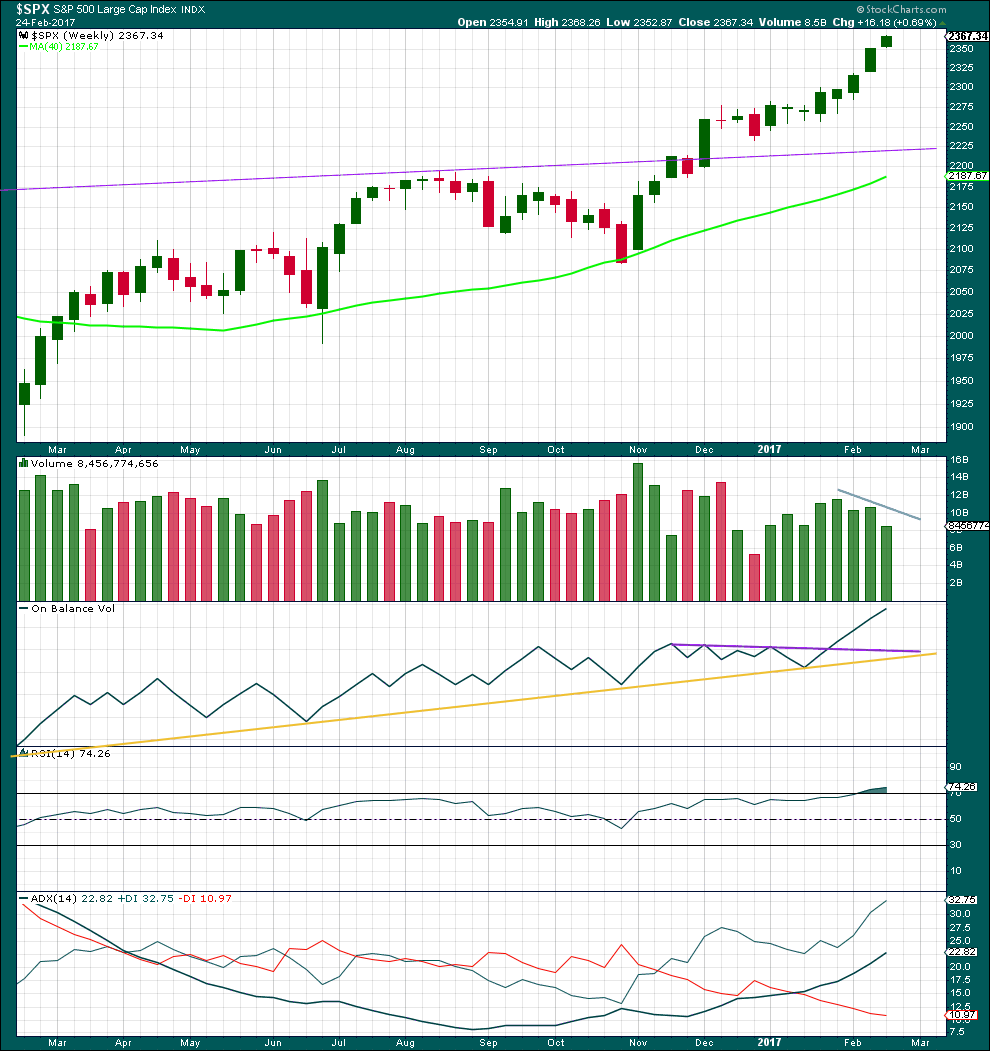
There are now eight green weekly candlesticks in a row. A larger correction may be expected soon, but not quite yet.
There has been some decline in volume over the last three weeks. This trend is showing early signs of weakening.
On Balance Volume remains very bullish.
RSI is overbought, but in a bull market this can remain extreme for a reasonable period of time. If it begins to exhibit divergence with price at the weekly chart level, then a larger correction may be expected to begin. There is no divergence at this time.
This trend is not yet extreme.
DAILY CHART
Click chart to enlarge. Chart courtesy of StockCharts.com.
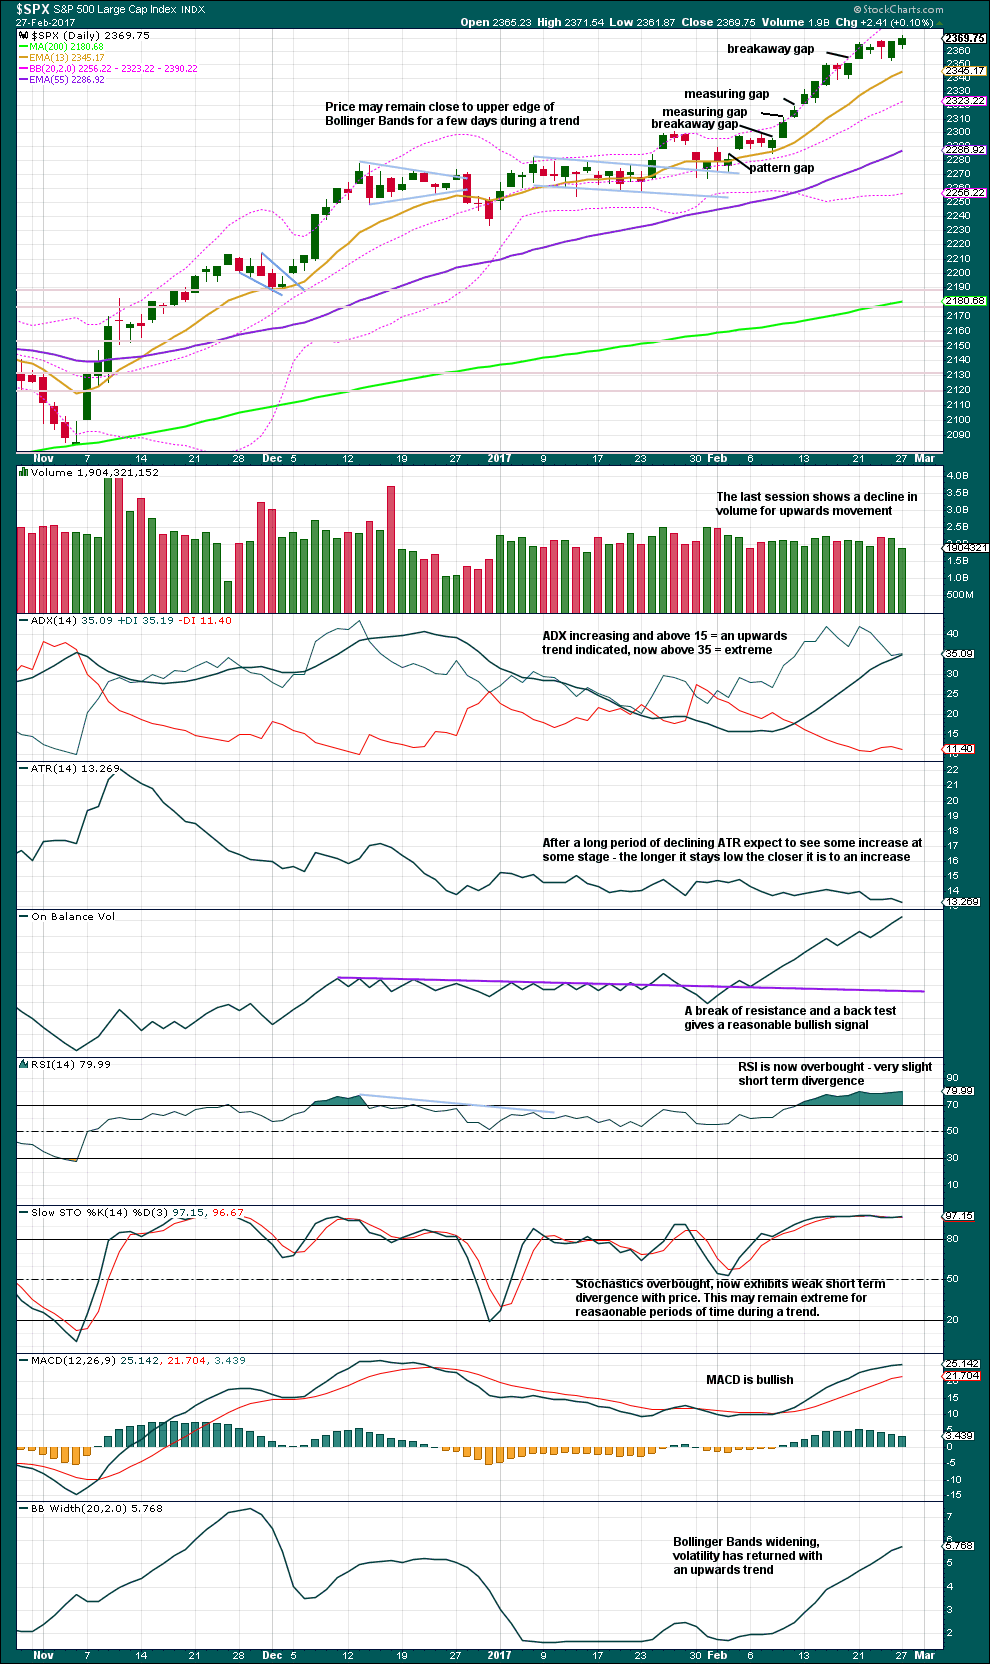
Two upwards days in a row come with declining volume. This is more typical of part of a correction than it is for part of a sustainable trend. This favours the main hourly wave count and it may also favour the first alternate hourly wave count, which sees an imminent trend change at primary degree.
ADX is now entering extreme territory. RSI has been extreme now for several days.
Assume the trend remains the same until proven otherwise. So assume the trend remains upwards, but notice that this upwards movement is looking overstretched and a reasonable pullback coming soon is expected. Because of this expectation consider protecting a reasonable amount of profit in long positions or taking some profit and scaling out.
Also, although there is a big risk that price could move suddenly and strongly lower at this time, it is advised to not try and pick a top and enter a short position here.
VOLATILITY – INVERTED VIX CHART
Click chart to enlarge. Chart courtesy of StockCharts.com.
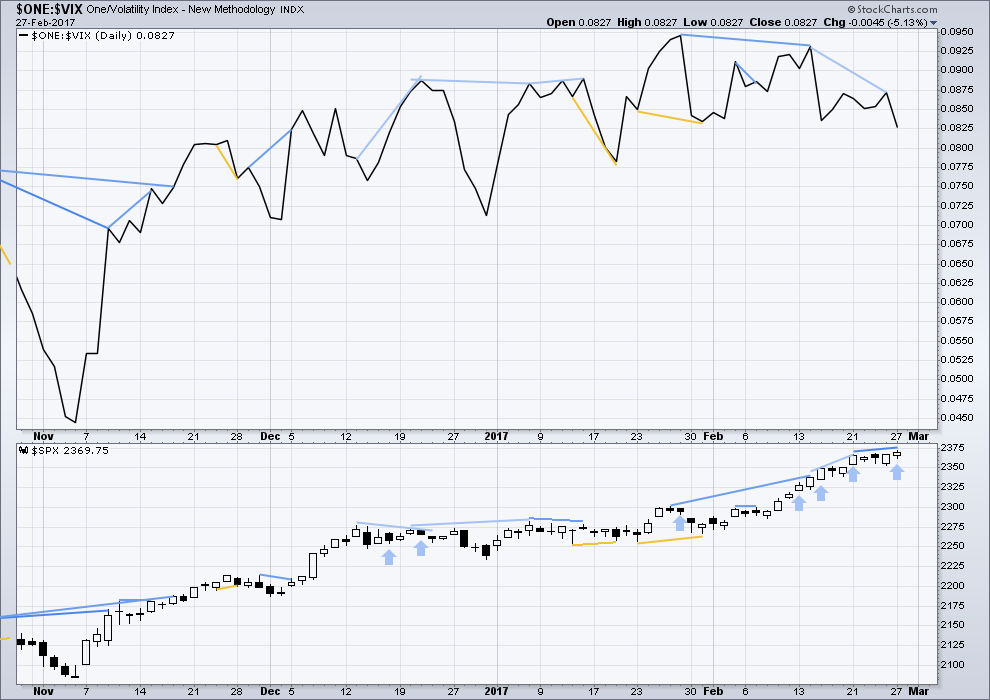
Normally, volatility should decline on rising price. There is double multi day divergence now between price and inverted VIX. This is bearish.
Either VIX is now decoupled from this market, or this persistent divergence will be resolved by primary wave 3 ending sooner than expected and primary wave 4 beginning very strongly. This divergence signals traders to be very cautious; assume the trend remains the same, but if entering the trend be aware for the potential here of a swift drop in price and use stops accordingly. Risk no more than 1-3% of equity.
Another day today closes with a reasonable upwards movement from price and a reasonable upwards movement from VIX (meaning inverted VIX moved downwards). This is absolutely not normal. Volatility reasonably increased today although price made new highs. This is read again as very bearish.
Although recent bearish divergence between price and VIX has not yet been followed by any downwards movement, that does not mean it cannot happen. There is much bearish warning here, so we should take it seriously.
There is potential here for a very quick sharp drop in price, which may be surprising, so watch this market carefully. Do not let your account be surprised. Protect it with stops.
BREADTH – AD LINE
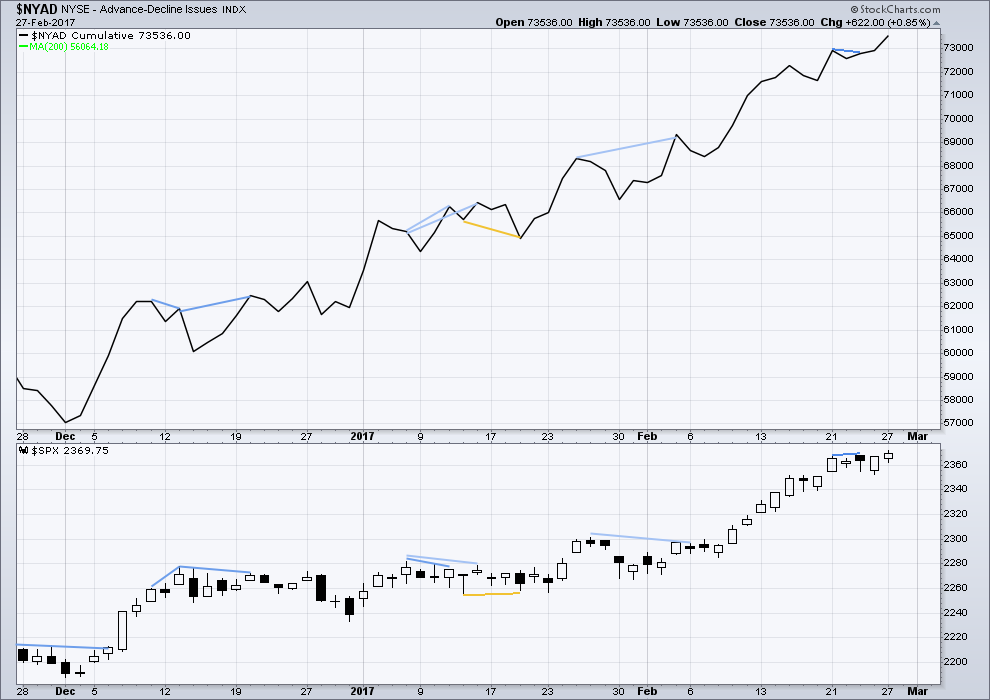
Click chart to enlarge. Chart courtesy of StockCharts.com.
The rise in price has support from a rise in market breadth. Lowry’s OCO AD line also shows new highs along with price. Normally, before the end of a bull market the OCO AD line and the regular AD line should show divergence with price for about 4-6 months. With no divergence, this market has support from breadth.
There is no new divergence today between price and the AD line. The rise in price has support from a rise in market breadth.
DOW THEORY
The DJIA, DJT, S&P500 and Nasdaq have made new all time highs in December of 2016. This confirms a bull market continues.
This analysis is published @ 08:42 p.m. EST.
Well! The 1987 streak was equalled, but not exceeded. As they say, while history does not always repeat, it often rhymes…’ Bye all!… 🙂
In 1987, DOW was up 13 days in a row (2/2/~2/20/1987). Currently, DOW is up 12 days in a row (2/9/~2/27/2017).
Yep. The streak was broken today. We are also now two weeks beyond the 2000 plus days of the bull market ending in 1929
O.K. We want to see inverted VIX bounce hard before the close after this move down. If it takes out the recent low all bets are offf imo…
Looks like my proposed fourth moved back into wave on territory…my labelling must be incorrect…as usual! 🙂
Yeah. So now the labelling switches for that part to two overlapping first and second waves.
We really should see this small degree fourth end and the fifth down to complete the impulse before the close imo…
Updated hourly chart:
A target is now calculated for minor 4 to end, using the most common Fibonacci ratio for minuette (c) to minuette (a).
However, the target may be too low. The last breakaway gap (which also could actually be labelled an exhaustion gap now) is still providing support. It may force minor 4 to be a little more shallow than the target expects.
Looking right on the money. MACD should continue divergence on final jaunt higher and so should VIX with a higher low, or even outright divergence with price…
Nice call Lara!
Thank you Ryan 🙂
SVXY needs to stay above 118.44 to bolster the bullish case…
It looks like last night’s main daily and hourly counts are right on. Great call Lara. I am not positive but I think we are looking for five waves down to complete Minuette ‘c’ of Minute ‘y’ of Minor 4 It also looks like we are currently in wave 3 of the five expected. If so, Minor 4 should be over today or tomorrow.
thanks Rodney 🙂
Lara, please pardon a basic question but I’m a rookie at EW so I’m confused by something.
In the commentary on the Daily Chart, you say that intermediate wave (3) can’t be the shortest wave, which means that intermediate (5) is limited to equal the length of (3), which was 26 days. So the maximum duration for (5) is 26.
Then you say that (5) has lasted 24 days so far. And that it is reasonable to expect a Fibonacci 34 days total for (5) so it may continue for another 10 sessions.
But doesn’t that contradict your earlier statement that (5) is limited to 26 days?
I’m sure I’m missing something but don’t know what that could be. Please clarify. Thanks very much.
By the way, aided by your analysis, I just opened a March 3rd iron condor that is profitable if the SPX closes Friday between 2352 and 2388. This 4 day condor offers a maximum return on risk of 64% and return on margin of 20%.
Lance
I’ll hop in here quickly before Lara has made her morning coffee…
The core EW rule that third waves cannot be the shortest refers to price movement, not time duration. When you have a chance, dig down into the stuff under Lara’s “Education” tab. It’s excellent.
The definitive text on all things EW is “Elliott Wave Principle” by Frost & Prechter. Buy it. Devour it.
^ Perfect. Thanks Curtis.
*goes back to morning coffee*
AHA! Thanks. I did read the materials in the education tab but didn’t grasp the distinction that you just explained. I appreciate it….
Will we match 1987 with a 13th record high close?! (DJI) 🙂
Does anyone know where we can download historical data of DOW, SPX and Nasdaq for up to 90 years for free? I can only find free data for 40 years.
Thanks.
I too would love to know. I’ve spent hours searching for this online. I can find it for Gold from Kitco, but not for the indices 🙁
If I can get it in .csv format I can import it into Motive Wave. But only for daily data.
The Seeking Alpha article by Richard Shaw — 100 Years Of S&P 500 Earnings, Dividends And Prices — has a hyper link to an Excel file that includes S&P monthly data from Jan 1871 to Feb 2017. This data set was developed by Robert Schiller. This data set might be of some value.
Chuck
Thanks chuck
Thank you, Chuck.
Im thinking one last push higher before the wind in the sails gets let out. However I would love too see 5 % come out of this market
First waves up in SPX have been frisky in recent impulses. If we see VIX continue higher with price tomorrow it would be typical for an impending higher degree correction and favor the first alternate. Look for price to end at the day’s low if we indeed get a top tmorrow. Another bounce off the day’s lows imo favors the main count.
head and shoulders break down on the 3-day, VIX higher. They’ll blame tomorrow’s volatility on Donald’s speech….
Naaaah…! Really??!! 😀