
A red daily candlestick with a long lower wick makes the Elliott wave count have a better look now at the daily chart level.
Summary: The target at minor degree is recalculated to 2,399. Persistent divergence with price and vix, and now today with price and the AD line, indicates caution here. Members holding long positions may raise stops to 2,355 to protect profits. The recent breakaway gap is providing support.
Members trying to enter the long side here risk entering late in the trend, so manage risk carefully. Always use a stop and do not invest more than 1-3% of equity here.
New updates to this analysis are in bold.
Last monthly and weekly charts are here. Last historic analysis video is here.
MAIN ELLIOTT WAVE COUNT
WEEKLY CHART
Click chart to enlarge.
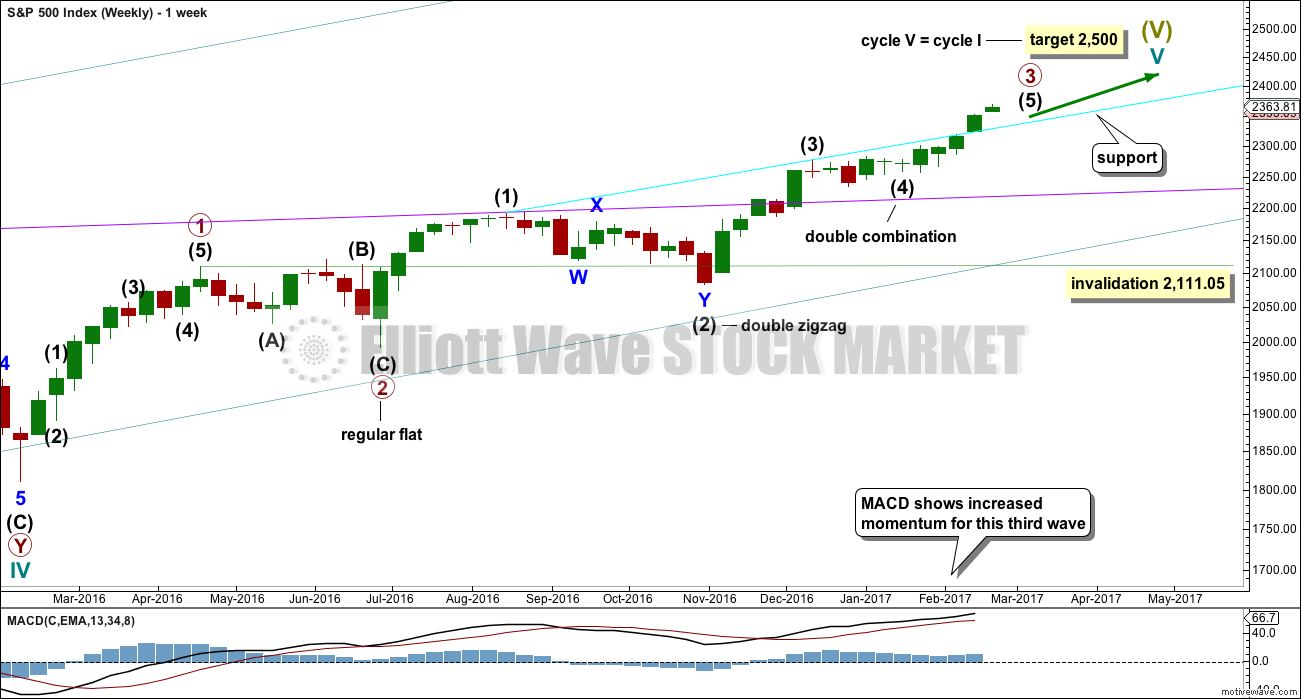
Cycle wave V is an incomplete structure. Within cycle wave V, primary wave 3 may be relatively close to completion.
When primary wave 3 is complete, then the following correction for primary wave 4 may not move into primary wave 1 price territory below 2,111.05.
Primary wave 2 was a flat correction lasting 47 days (not a Fibonacci number). Primary wave 4 may be expected to most likely be a zigzag, but it may also be a triangle if its structure exhibits alternation. If it is a zigzag, it may be more brief than primary wave 2, so a Fibonacci 21 sessions may be the initial expectation. If it is a triangle, then it may be a Fibonacci 34 or 55 sessions.
Primary wave 3 is now still incomplete.
DAILY CHART
Click chart to enlarge.
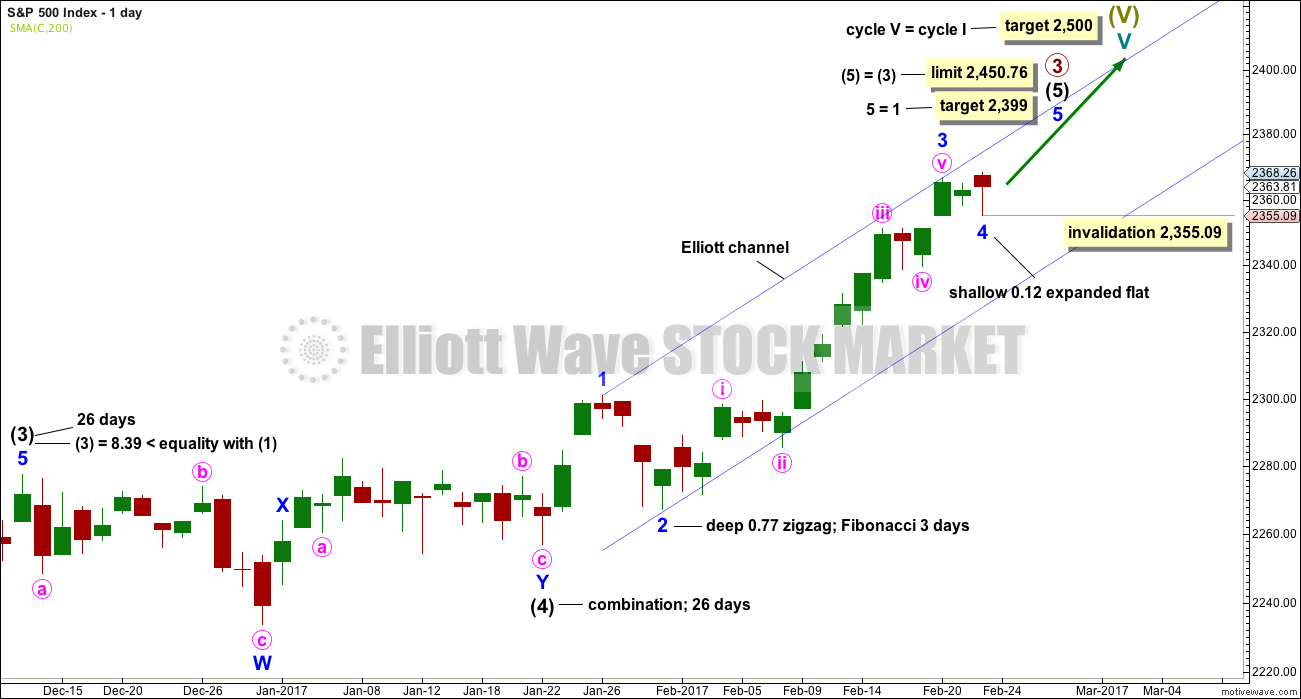
Intermediate wave (4) is a complete combination: zigzag – X – flat. It would have been even in duration with intermediate wave (3), both lasting 26 days.
Intermediate wave (3) is shorter than intermediate wave (1). One of the core Elliott wave rules states a third wave may never be the shortest wave, so this limits intermediate wave (5) to no longer than equality in length with intermediate wave (3) at 2,450.76.
Minor wave 3 has no Fibonacci ratio to minor wave 1. It is more likely that minor wave 5 will exhibit a Fibonacci ratio to either of minor waves 3 or 1. The target assumes it will exhibit the most common Fibonacci ratio.
Minor wave 2 was a deep 0.77 zigzag lasting three days. Minor wave 4 today shows more clearly on the daily chart. It may have completed as a very common expanded flat correction. There is perfect alternation between minor waves 2 and 4 and they have better proportion now on the daily chart.
Intermediate wave (5) has so far lasted 22 days. It may be expected to be shorter both in length and duration compared to intermediate wave (3). At this stage, an expectation of a Fibonacci 34 days total for intermediate wave (5) looks reasonable, so it may now continue for another 12 days or sessions.
The proportion here between intermediate waves (2) and (4) is acceptable. There is alternation. Both are labelled W-X-Y, but double zigzags are quite different structures to double combinations.
HOURLY CHART
Click chart to enlarge.
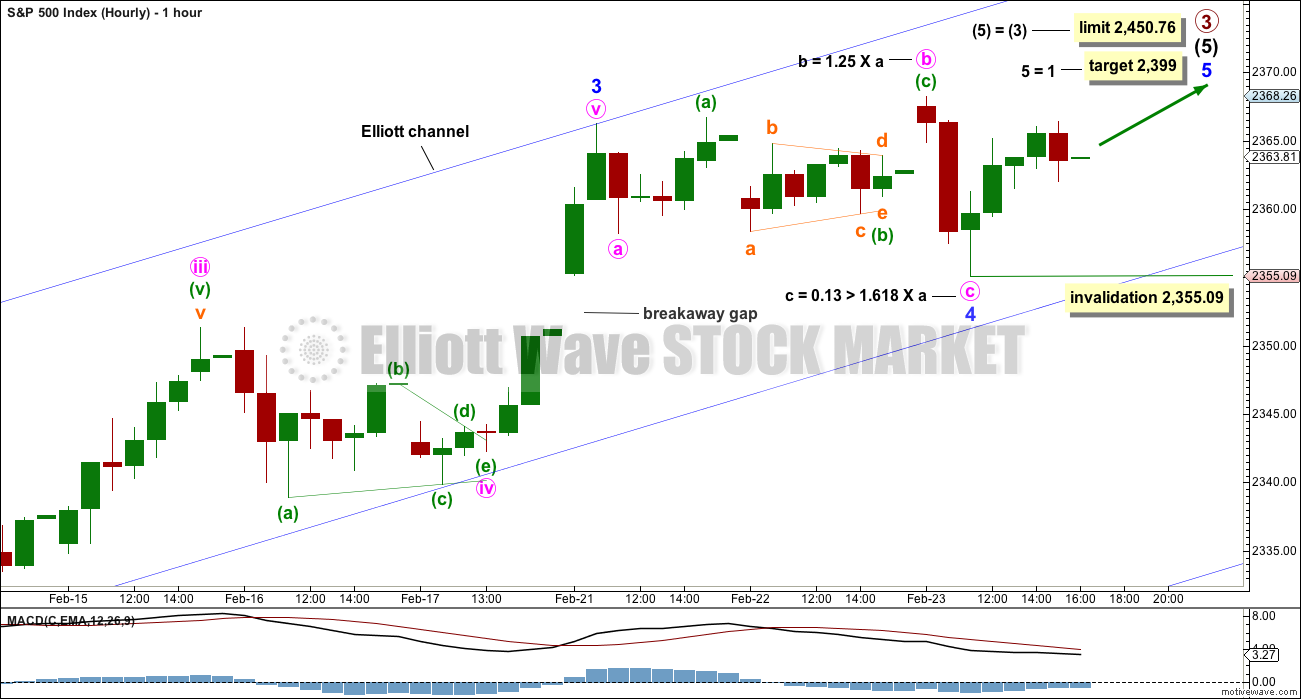
Minor wave 4 fits perfectly as an expanded flat correction, which are very common structures. There was a triangle in there and it looks like it was a B wave within a B wave.
Within minor wave 5, no second wave correction may move beyond the start of its first wave.
The breakaway gap has offered support, as breakaway gaps often do. This adds a little confidence to using the invalidation point as a place to pull up stops to. Gaps can be useful in trading.
If this wave count is invalidated by a new low below 2,355.09, then minor wave 4 may be continuing further as a double flat. This is possible, but the probability is low because it does look like the breakaway gap is offering support.
TECHNICAL ANALYSIS
WEEKLY CHART
Click chart to enlarge. Chart courtesy of StockCharts.com.
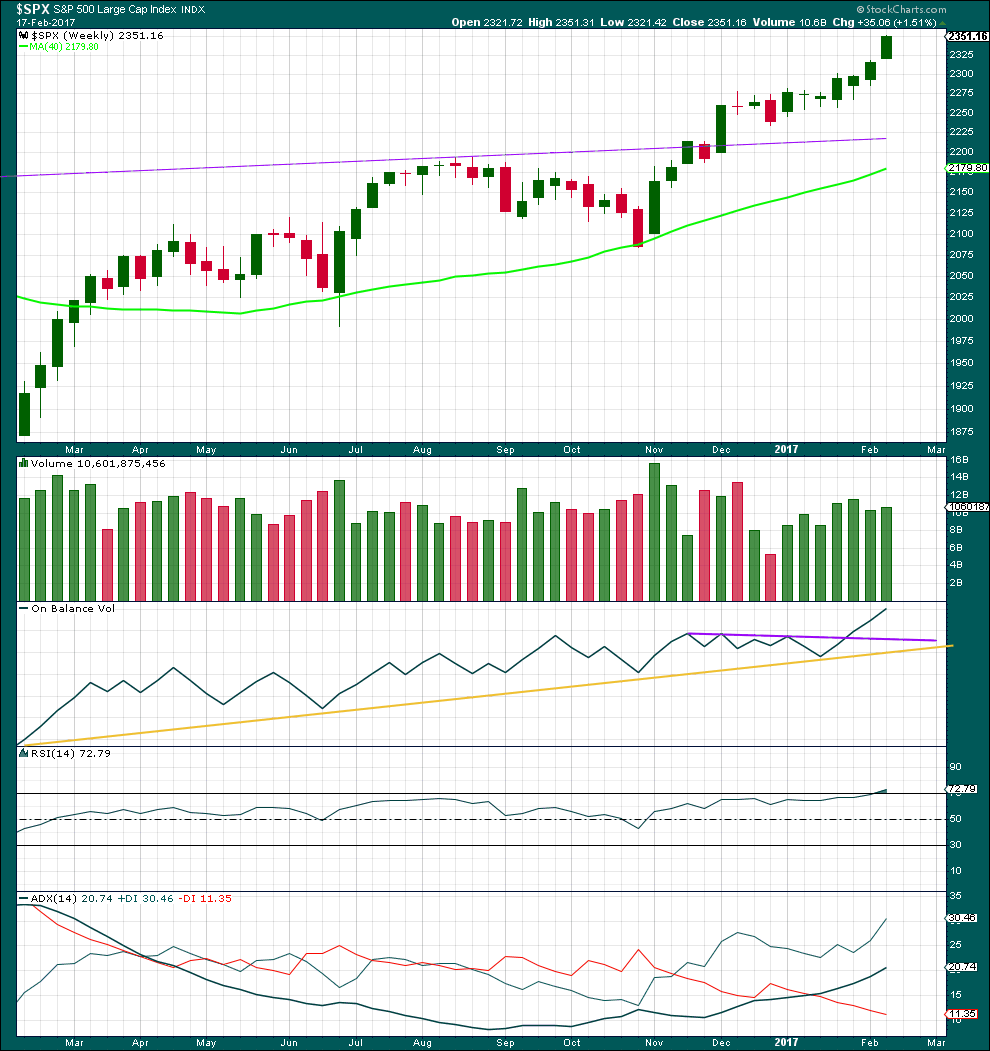
Last week completes the third candlestick in a Three White Soldiers pattern on the weekly chart. This is a bullish continuation pattern. The lower edge of the first candlestick may now offer support about 2,267.21.
A slight increase in volume last week beyond the prior week is also bullish.
On Balance Volume at the weekly chart remains very bullish.
RSI is only just now entering overbought at the weekly chart level. This may remain extreme for a few weeks during a strong trend. At this stage, it does not exhibit any divergence with price to indicate weakness.
ADX still indicates an upwards trend that has some distance to travel before it becomes extreme.
This weekly chart is very bullish indeed.
DAILY CHART
Click chart to enlarge. Chart courtesy of StockCharts.com.
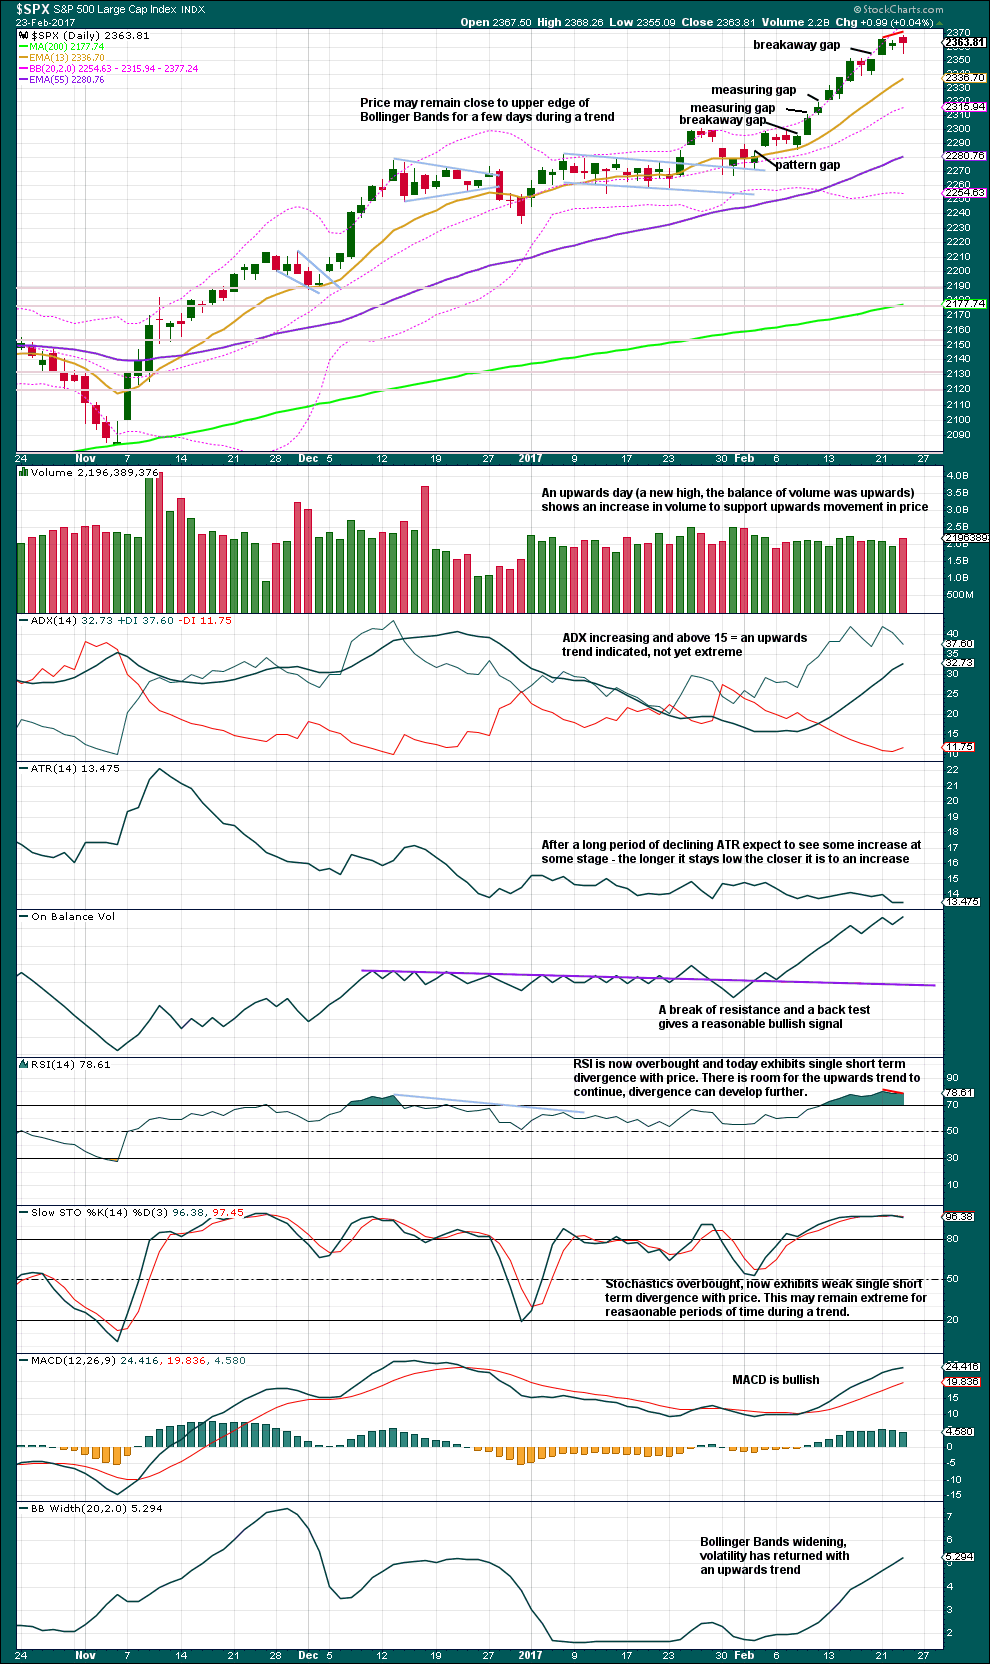
A new high for an outside day saw the balance of volume upwards. An increase in volume today supports upwards movement during the session. This supports the Elliott wave count and the targets.
The breakaway gap is offering support.
There is slight bearish divergence today with price and RSI while RSI is overbought. This indicates some caution for long positions here. Stochastics also shows very weak single divergence with price at this new high.
MACD shows longer term divergence with price.
The problem with divergence is that it can continue and persist for reasonable periods of time. The most reliable is RSI when it is extreme, but this can develop into double and even triple divergence before price turns.
Divergence today indicates caution for long positions, but it does not mean price must turn here.
VOLATILITY – INVERTED VIX CHART
Click chart to enlarge. Chart courtesy of StockCharts.com.
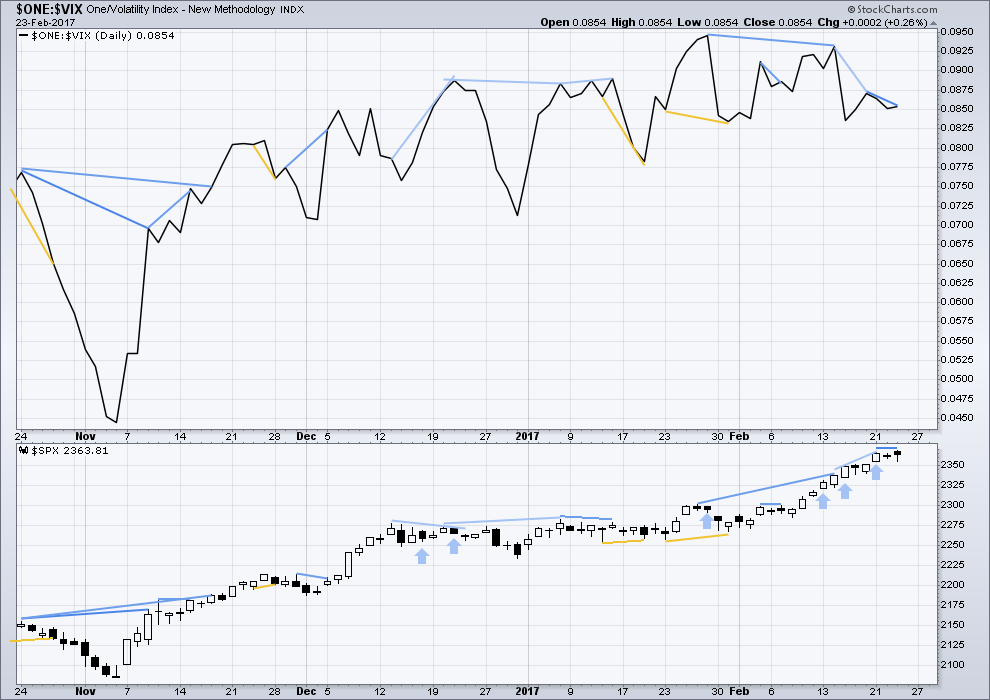
Normally, volatility should decline on rising price. There is triple multi day divergence now between price and inverted VIX. This is bearish.
Either VIX is now decoupled from this market, or this persistent divergence will be resolved by primary wave 3 ending sooner than expected and primary wave 4 beginning very strongly. This divergence signals traders to be very cautious; assume the trend remains the same, but if entering the trend be aware for the potential here of a swift drop in price and use stops accordingly. Risk no more than 1-3% of equity.
Strong warning: Watch the market closely. Be disciplined with stops. Protect profits on long positions. If entering long here, reduce risk to only 1-3% of equity.
BREADTH – AD LINE
Click chart to enlarge. Chart courtesy of StockCharts.com.
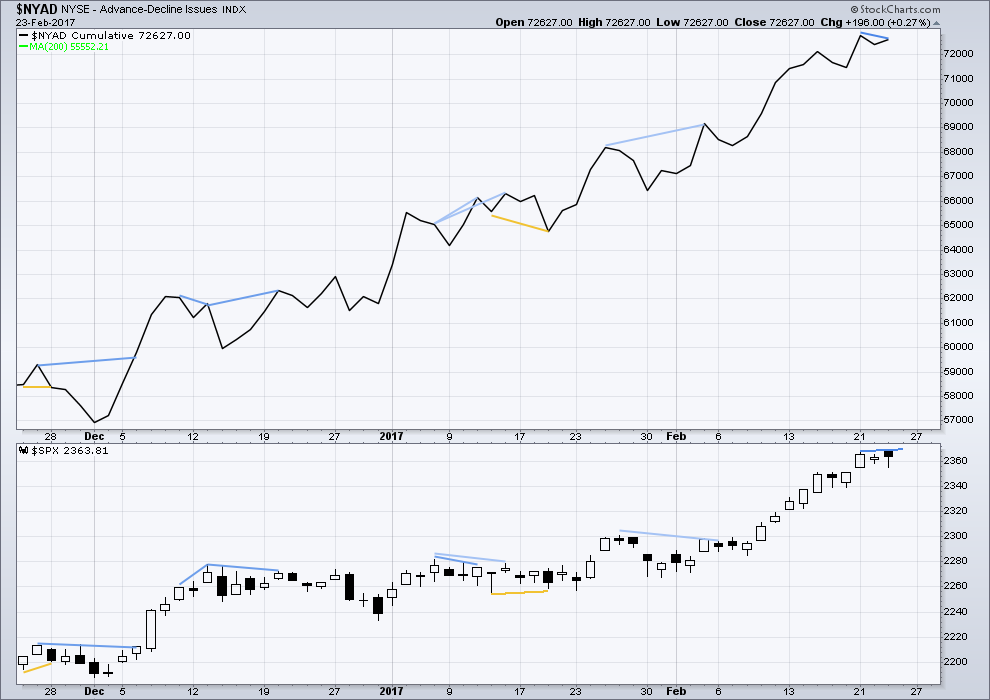
The rise in price has support from a rise in market breadth. Lowry’s OCO AD line also shows new highs along with price. Normally, before the end of a bull market the OCO AD line and the regular AD line should show divergence with price for about 4-6 months. With no divergence, this market has support from breadth.
There is new short term divergence today between price and the AD line. The new high today was not supported by a new high in market breadth. This is bearish.
DOW THEORY
The DJIA, DJT, S&P500 and Nasdaq have made new all time highs in December of 2016. This confirms a bull market continues.
This analysis is published @ 8:05 p.m. EST.
Just launched a small speculative trade: bought 2 SPY Puts at the close (Mar 3 exp)
From Lara’s updated [x] we’ve got the (a) and (b) of an expanding flat at today’s close, awaiting a sharp down in (c) of [y] of 4 on Monday, then I sell my Puts. Stop a liitle above today’s closing high.
Boredom makes you do strange things. Can’t wait for Lara’s weekend report to splash cold water on me. 🙂
I see some interesting comments below… gotta rush out right now, will read when I get back. Thanks guys for sharing your thoughts!
I was premature in labelling minor 4 over 🙁 It’s continuing and looks so far like an almost complete combination: flat – x – zigzag.
When it’s done I can recalculate the target for minor 5 to end.
One more brisk move up. We should be shortly getting another great opportunity to go long volatility. Have a great weekend all!
Re. trading.
My interpretation of Lara’s analysis led me to do an iron condor on the SPX. I opened the positions on Tuesday of week, Feb 21. Essentially, the strategy was based on the SPX staying above 2350 and below 2380 on the day of expiration, February 24, … which is today. Barring a big dip at the close today, the strategy worked, resulting in a 34% return on risk or a 13% return on margin in 4 days.
Excellent! I like to trade simple short term SPY Calls and Puts, but not this week. I’m too green to tackle complex option trades, but looks like you may have a winner.
I do also trade only spx with derivatives spxl and spxs and always helpful to get a second opinion
(my tools .. Elliott and fib )
I bought some UVXY and Sold a few longs today (regional banks, techs). I am truly afraid that we may have a max upside of 2-5% but potential downside of 10-20% fairly quickly. So tight stops (mental or otherwise) along with trimming some gains is a good idea. Remember, pigs get slaughtered. Also, I agree with Vern; when this down move starts (which could be anytime between now and July), it will be very swift. Long term SPY puts another strategy to look into. Have a good weekend everyone. (I am still long emerging markets, Mexican markets and USD). Shorting DAX options and European ETFs. I know I am early but have to start somewhere.
Economic theoreticians have debated what is the most powerful investment principle.
The one most commonly cited one is the principle of compounding.
A minority contend it is the principle of reversion to the mean.
It has been nothing short of stunning to watch central banksters over a period of many years now attempt to nullify the latter.
Some measure of their success in promulgating the idea of their invincibility is the remarkable bullishness of market participants of late. Folk of otherwise sound mind are calling for DOW 30,000.00 and some even DOW 40,000.00!
Intelligent (?) academicians are writing papers about the abolition of the business cycle and how with the erstwhile FED at the helm, we will not see another serious market decline into the distant future. There are even some EW analysts on that bandwagon. I remember learning about the concept of the “Elastic Limit” in Physics courses I took in college. We all are experimentally aware of what happens when you stretch a rubber band and how the speed and violence of the snap back is in direct proportion to how far it is stretched…that is unless you exceed the “Elastic Limit”.
The idea of reversion to the mean has been a cornerstone of my trading approach and i have to confess I have had my head handed to me on far more occasions recently than I can remember. It seems to me that there is an interesting way to combine the idea of compounding, and reversion to the mean, and I have already alluded to it, namely, that the farther away from the mean a measurement becomes, the more violent, i.e. compounded, its rate of return to said mean. Getting back to physics. there is one very important exception. Who knows what happens when the “Elastic Limit” is exceeded? 😀
Thanks Verne, great work.
Regarding the thought from those that say “we will not see another serious market decline into the distant future”, I remember the conversation back in 2000 that the market could boom forever because “things were different now (in 2000)”. We know how that quickly ended.
Oh Yes! Another famous assertion- “This time its different…!”
Which is what we hear in pretty much every fully inflated bubble. “this one is different”.
And of course it’s not.
When the Fed began it’s work in 1913, $1.00 was worth $1.00.
According to WorldCyclesInstitute.com, today that 1913 dollar is only worth 4 cents.
After the coming crash, if the Fed keeps printing money and the dollar continues to be devalued, who knows how high the Dow can go in future years, but in more worthless dollars.
EWI says the Dow in terms of the price of Gold peaked in 1999.
The Dow in terms of price of gold
Verne, you’re friends have been in there all day printing to hold this thing up. From 3:20-3:45 is just ridiculous. They literally don’t care that they are nationalizing the capital markets.
It is absolutely mind boggling isn’t? My previous question about what happens when any material exceeds its elastic limit does have a very technical answer- a break!
We are looking at severely broken markets folk. The banksters are all in desperately trying to arrest every impulsive decline. I am not sure if we have an interim top in as yet and I think Lara’s count of an upcoming minor five, if correct, will see a swift final wave up. We will know the worm has turned when the kinds of attempts at buying the market dips we saw this morning is met with even more violently impulsive declines. They will ultimately loose control but they have not quite yet. We should get a good clue from how volatility behaves next week. This was quite a move down for an incomplete minor four wave and the strong turn in XIV suggests that we had an at least interim low today. I don’t think we would have seen this strong a bounce with a sharp C wave still to come but stranger things have happened. NDX and IWM look like second wave bounces. We could could get a new low Monday with a bullish engulfing candle to signal the fifth up. I think it is going to be nasty, brutish, and short, to quote Mr Hobbes….I unloaded half my volatility position and will reload on next pop higher…. 🙂
It may be they are spread thin…they were not able to get the same pop in NDX and RUT. They will continue to focus firepower on DJ and SPX as those are the most watched…
” Who knows what happens when the “Elastic Limit” is exceeded? ”
I’m guessing it breaks?
In terms of markets, I think that would be worse than a violent reversion to the mean. A totally broken market may just…. crash then disappear. Possibly.
]Exactly!! Spoken like a true analyst! This has been the thing that has me so worried-a failure of mean reversion is definitely not cause for euphoria as it implies an elastic limit has been exceeded. It implies a broken market.
I could not agree more…far worse. We can already see some troubling signs. An absence of sellers means no short covering. No short covering means no market bottom. When the market is sustained only by central bank buying, when they reach the limit of their leveraged buying we will not have a correction, but something far worse as you suggest.
If I read this correctly regarding an ongoing wave 4, yesterday’s low would be [w]* followed by zigzag up as [x] followed by today’s sharp (a) and zigzag(b) of [y] in progress. If (b) is complete at 10:05, and (c) were to equal (a), that would take (c) of [y] of 4 down to 2346 – into the zone of the prior [iv] of 17Feb.
(b) may still be in progress at 10:40 which will throw my map off somewhat.
* I use [ ] to denote circles
(a)=(c) of [y] now 2347.71, still in the territory of [iv]
(b) of [y] of 4 may be a triangle in progress at 2:30 EST
With the futures showing a gap down move at the open, it appears the daily and hourly charts will be invalidated. I am guessing minute C of Minor 4 is not yet over. Last evening Lara wrote.
“If this wave count is invalidated by a new low below 2,355.09, then minor wave 4 may be continuing further as a double flat. This is possible, but the probability is low because it does look like the breakaway gap is offering support.”
This may present an opportunity to join the trend for those who are not yet long. But remember all of Lara’s warnings! We are nearing a Primary 3 top.
The last high on hourly chart could have been minor 5 having a brief run to new high coming out of fourth wave triangle.
If that is correct, it implies hard down Monday. Pancholi turn dates were Feb 23,24 so that would fit. XIV pointing to some kind of continuing bounce. That could be entirely owing to the ongoing BTFD mania and get negated next week. If we move higher without a meaningful correction I will be watching from a safe distance…I suspect it could be a terminal move. I have not seen but one single chart that entertains that possibility and it has a completed five wave wedge up from last Feb lows 2016. I guess one could see the waves as Zig Zags but price has blown way past the 1-3 trendline
no alternative count ?????