
Again, upwards movement continues as the main Elliott wave count expects.
And the very bearish alternate Elliott wave count remains just viable.
Summary: The target is 2,338 for the short term and 2,382 for a longer term trade. Price should find strong support about 2,300 now. The invalidation point is at 2,285.38.
Divergence today between price and inverted VIX indicates a reasonable probability of a red candlestick tomorrow.
A new high above 2,334.58 would eliminate a very bearish alternate and provide confidence in this upwards trend. The trend has support from breadth, but not good support so far from volume.
New updates to this analysis are in bold.
Last monthly and weekly charts are here. Last historic analysis video is here.
MAIN ELLIOTT WAVE COUNT
WEEKLY CHART
Click chart to enlarge.
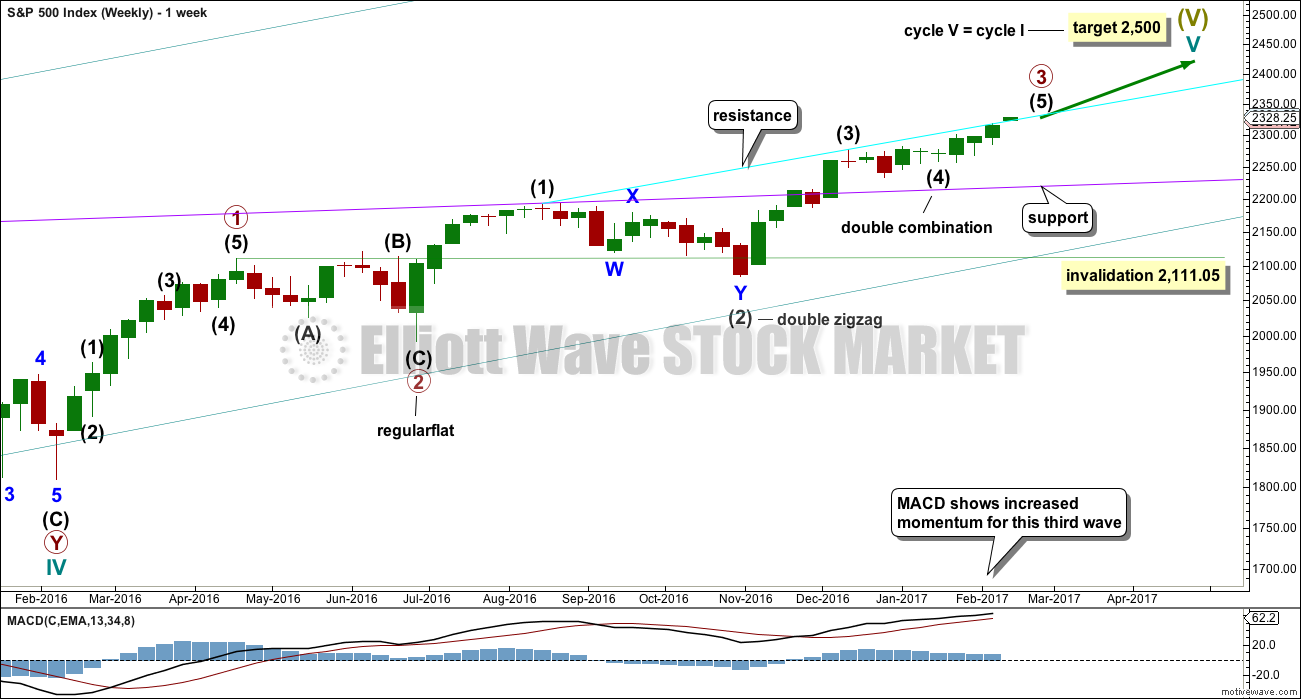
Cycle wave V is an incomplete structure. Within cycle wave V, primary wave 3 may be relatively close to completion.
When primary wave 3 is complete, then the following correction for primary wave 4 may not move into primary wave 1 price territory below 2,111.05.
Primary wave 2 was a flat correction lasting 47 days (not a Fibonacci number). Primary wave 4 may be expected to most likely be a zigzag, but it may also be a triangle if its structure exhibits alternation. If it is a zigzag, it may be more brief than primary wave 2, so a Fibonacci 21 sessions may be the initial expectation. If it is a triangle, then it may be a Fibonacci 34 or 55 sessions.
Primary wave 3 at this stage though is incomplete and may continue to move price higher.
DAILY CHART
Click chart to enlarge.
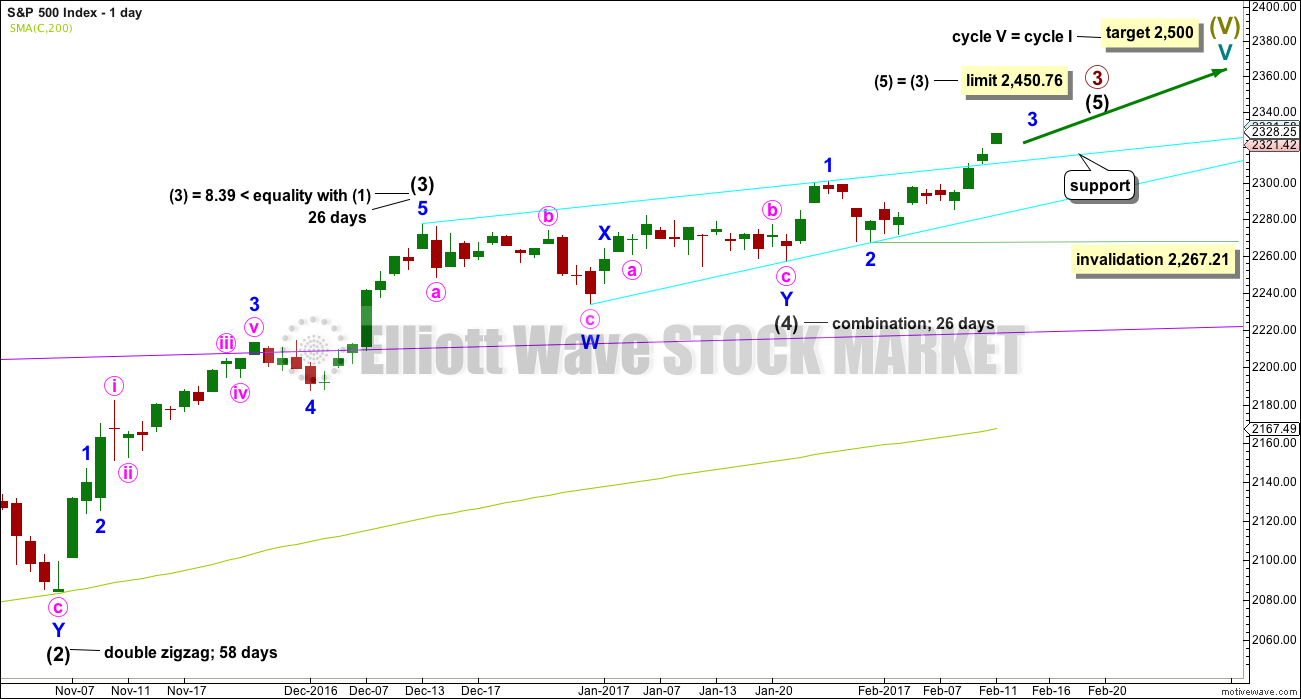
Intermediate wave (4) is a complete combination: zigzag – X – flat. It would have been even in duration with intermediate wave (3), both lasting 26 days.
Intermediate wave (3) is shorter than intermediate wave (1). One of the core Elliott wave rules states a third wave may never be the shortest wave, so this limits intermediate wave (5) to no longer than equality in length with intermediate wave (3) at 2,450.76.
Minor wave 3 has moved beyond the end of minor wave 1, meeting the rule. Within minor wave 3, no second wave correction may move beyond the start of its first wave below 2,267.21.
Intermediate wave (5) has so far lasted fifteen days. It may be expected to be shorter both in length and duration compared to intermediate wave (3). At this stage, an expectation of a Fibonacci 21 days total for intermediate wave (5) looks reasonable, so it may now continue for another six days or sessions. This is starting to look a bit too brief now though. It may continue to total a Fibonacci 34 sessions.
Price has now broken above the cyan line. This line may now offer support.
The proportion here between intermediate waves (2) and (4) is acceptable. There is alternation. Both are labelled W-X-Y, but double zigzags are quite different structures to double combinations.
HOURLY CHART
Click chart to enlarge.
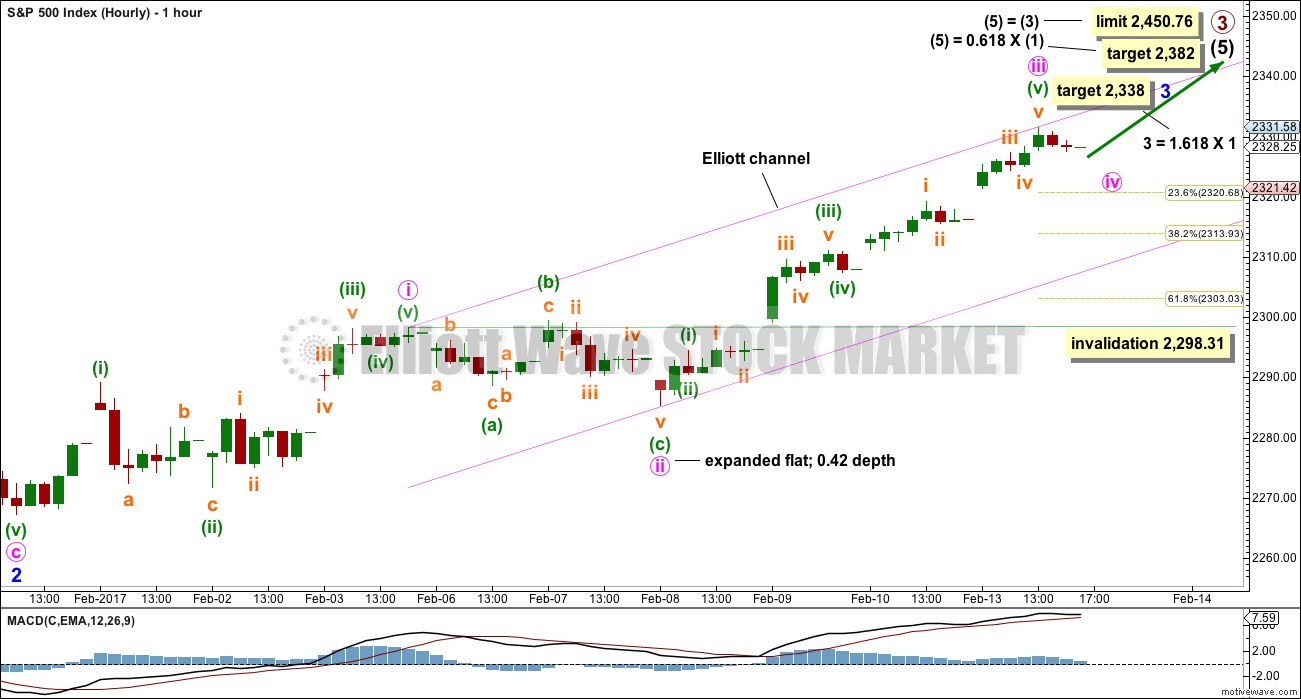
Intermediate wave (5) must subdivide as a five wave structure, either an impulse or an ending diagonal. It is not possible to eliminate either option at this stage, but it does look very much like an impulse.
Within intermediate wave (5), minor waves 1 and 2 may be complete.
Minor wave 3 may only subdivide as an impulse. Within minor wave 3, minute waves i through to iii may now be complete. Minute wave iii looks like it continued higher today and no longer exhibits a Fibonacci ratio to minute wave i.
Minute wave iv may begin here, or soon. It should be expected to be shallow and find support at the lower edge of the Elliott channel. If minute wave iii continues higher, then keep redrawing the channel. Minute wave iv may not move into minute wave i price territory below 2,298.31.
Minute wave iv may be expected to show up on the daily chart as at least one red daily candlestick or doji. It may last up to about three or four days, but at this stage it may be expected to be more brief than minute wave ii.
ALTERNATE ELLIOTT WAVE COUNT
DAILY CHART
Click chart to enlarge.
I will publish alternate ideas from time to time in response to members queries or concerns.
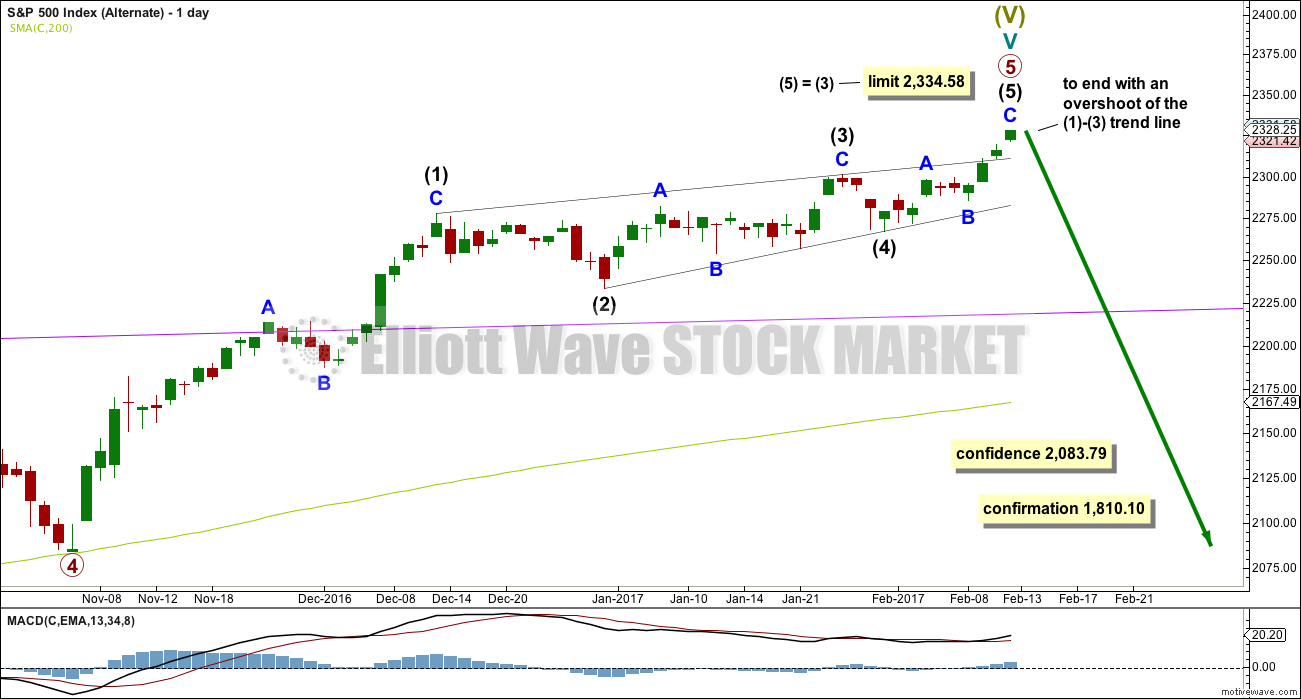
An ending contracting diagonal may now be complete. However, these usually end with a small overshoot of the 1-3 trend line. This one now has two candlesticks above the trend line, not just overshooting it. This looks wrong.
Current upwards movement (which began on the 4th of November, 2016) must be a fifth wave for it to be an ending diagonal. That means that primary waves 1 through to 4 may be complete.
The only way for this to work and meet all Elliott wave rules is to see primary waves 1 and 2 over very quickly. This makes primary wave 3 longer than primary wave 1, so that the core rule stating a third wave may not be the shortest is met. (To see the entire detail of primary waves 1 through to 4 see last analysis here).
Ending contracting diagonals must have subwaves that all subdivide as zigzags.
This wave count has some support from long term classic analysis at the monthly chart level, but it is not supported by Lowry’s analysis. At this time, Lowry’s do not see normal conditions for a major market top in place.
This wave count has a very low probability. It requires confidence below 2,083.79.
TECHNICAL ANALYSIS
WEEKLY CHART
Click chart to enlarge. Chart courtesy of StockCharts.com.
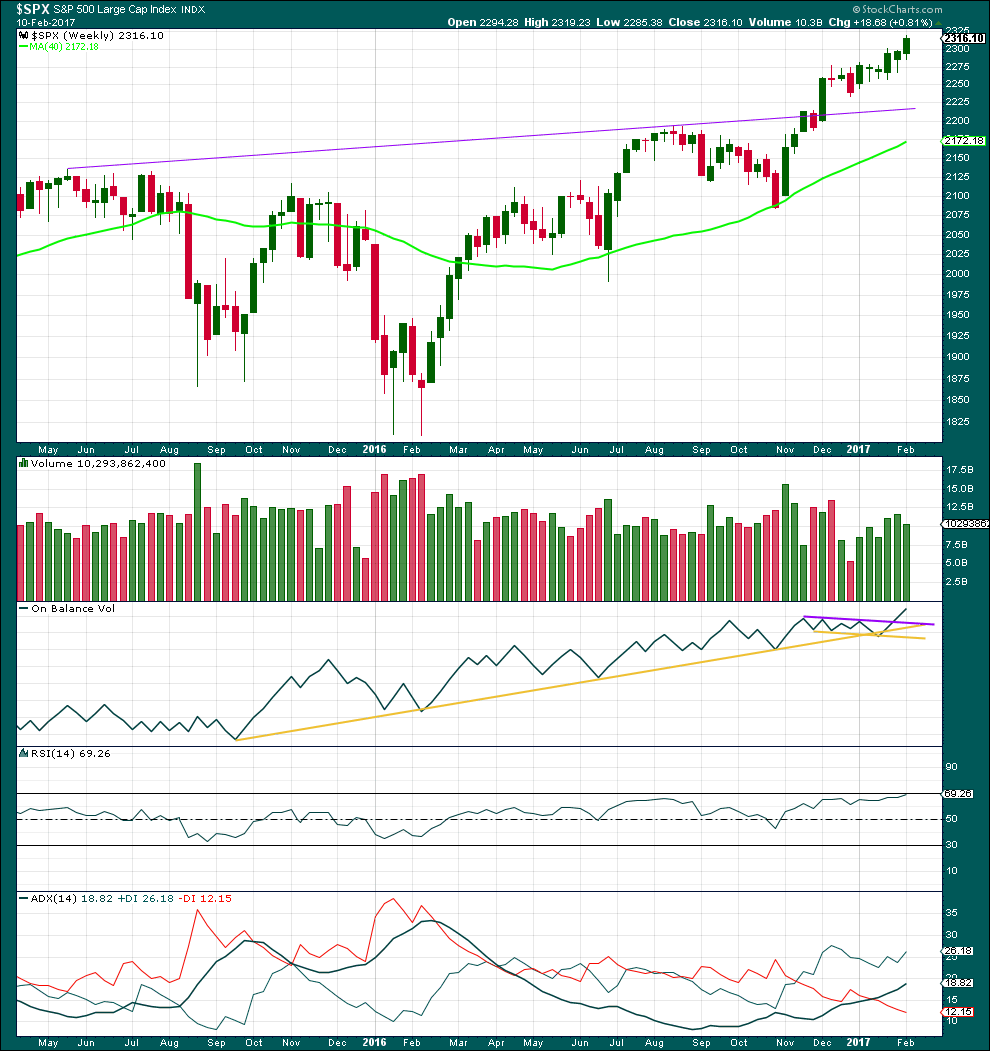
Overall, price is moving higher on increasing volume. Last week sees a decline in volume from prior week, but volume is still stronger than the first three weeks of upwards movement.
On Balance Volume gave a bullish signal with a break above the purple resistance line. This line may now offer support and assist to halt any fall in price from being too deep.
RSI is not yet overbought at the weekly chart level. There is room for price to rise further.
ADX indicates an upwards trend, and ADX has a long way to go before it becomes extreme.
DAILY CHART
Click chart to enlarge. Chart courtesy of StockCharts.com.
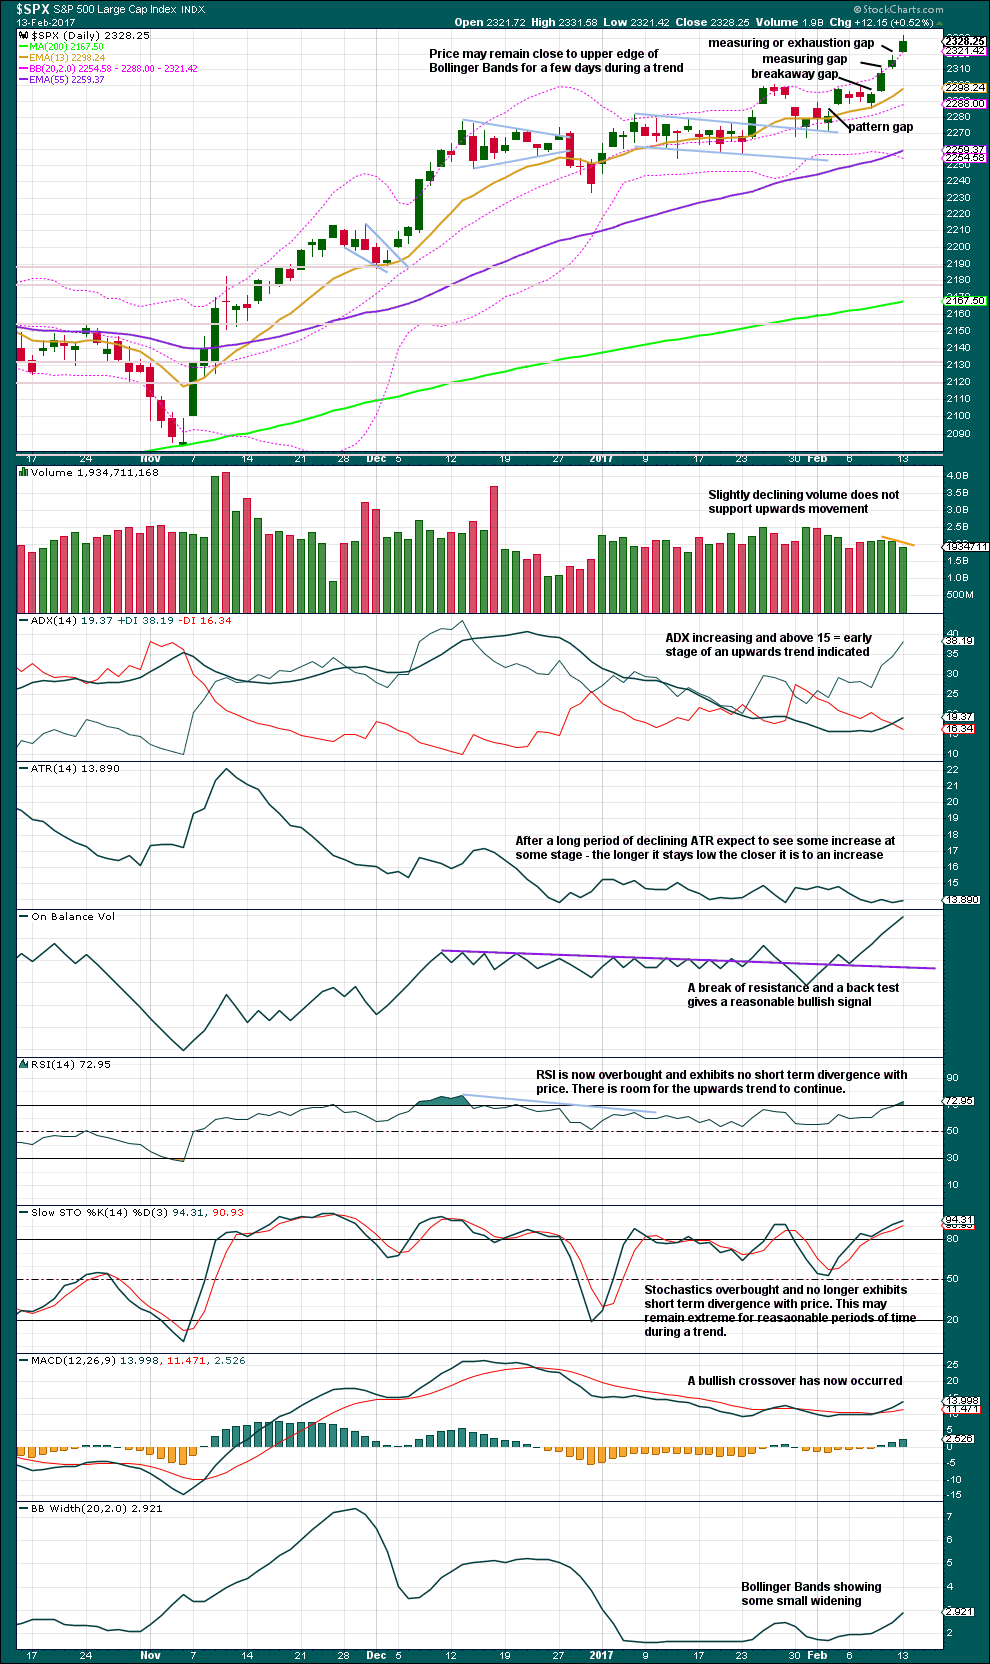
The last two upwards days both have a decline in volume. Look out for a small pullback here or very soon. The Elliott wave count would expect it to be minute wave iv.
RSI is now overbought. When / if it exhibits divergence with price at extremes, then look out for a deeper pullback.
Gaps are labelled today. It is impossible to tell if the gap up today is another measuring gap or an exhaustion gap. If tomorrow prints a red candlestick or doji, then it would be an exhaustion gap. If tomorrow prints another green candlestick, then it would be a measuring gap.
VOLATILITY – INVERTED VIX CHART
Click chart to enlarge. Chart courtesy of StockCharts.com.
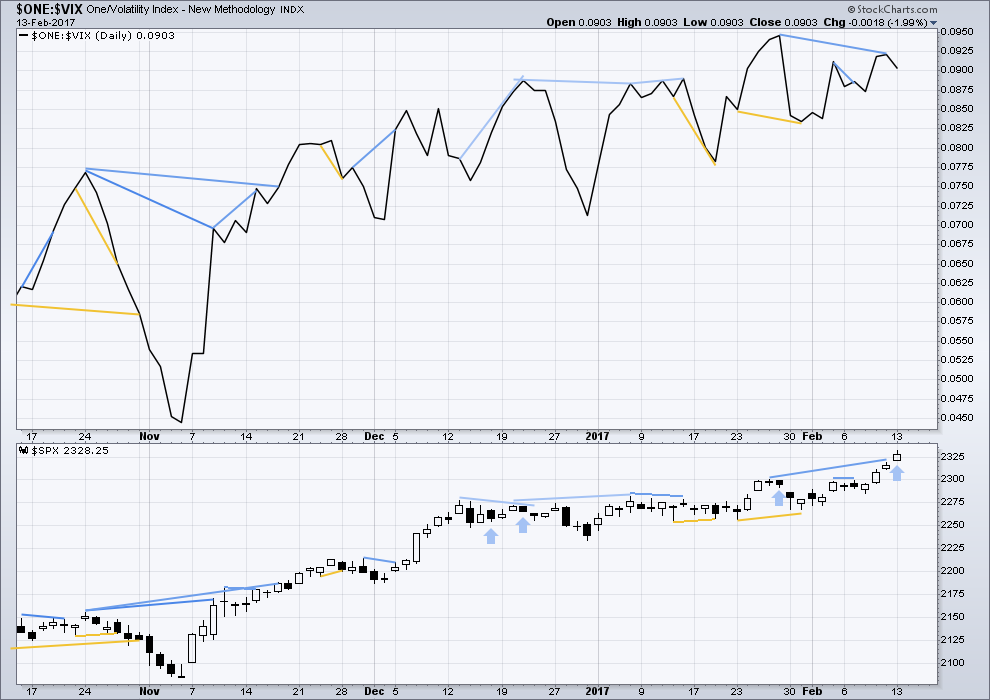
There are a few instances of multi day divergence between price and inverted VIX noted here. Bearish divergence is blue. Bullish divergence is yellow. It appears so far that divergence between inverted VIX and price is mostly working to indicate short term movements spanning one or two days. While this seems to be working more often than not, it is not always working. As with everything in technical analysis, there is nothing that is certain. This is an exercise in probability.
Along with short / mid term bearish divergence, there is now also single day bearish divergence between price and inverted VIX. Volatility increased while price moved higher today and this is opposite of normal behaviour.
Three prior instances are noted with short blue arrows. Two of those three instances were followed by at least one downwards day. The current instance may be expected to be followed by one or two downwards days.
BREADTH – AD LINE
Click chart to enlarge. Chart courtesy of StockCharts.com.
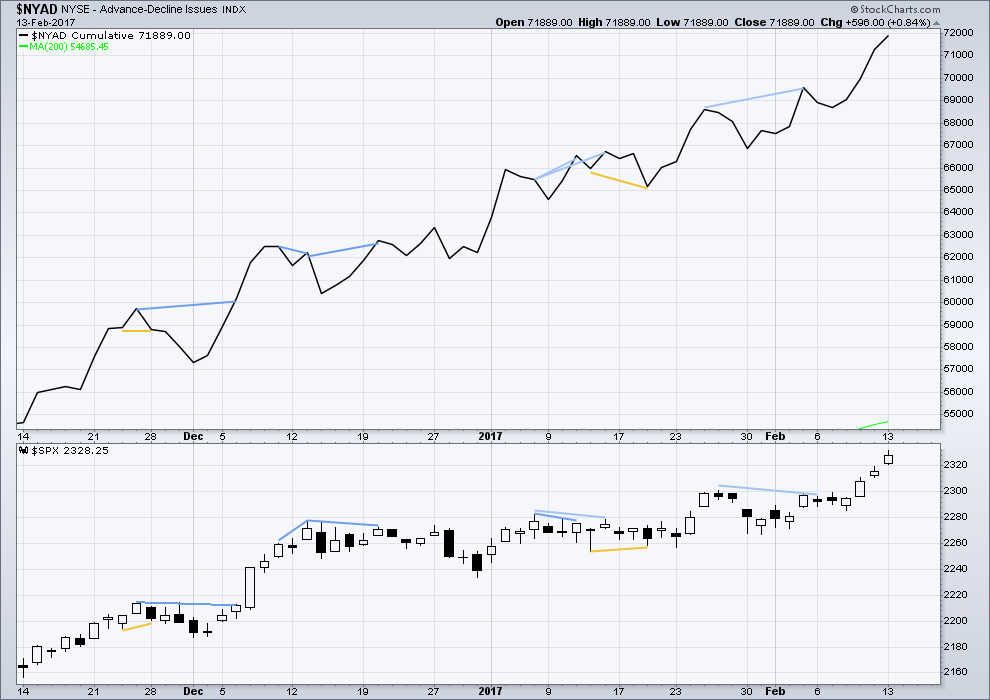
There is no short nor mid term divergence today between price and the AD line. The rise in price to a new high today was accompanied by a corresponding new high in the AD line. The rise in price has support from a rise in market breadth. Lowry’s OCO AD line also shows new highs along with price. Normally, before the end of a bull market the OCO AD line and the regular AD line should show divergence with price for about 4-6 months. With no divergence, this market has support from breadth.
DOW THEORY
The DJIA, DJT, S&P500 and Nasdaq have made new all time highs in December of 2016. This confirms a bull market continues.
This analysis is published @ 7:10 p.m. EST.
The very bearish alternate has today been invalidated. Although it did previously look like a rising wedge (an Elliott wave ending contracting diagonal) may be completing, today that is invalid. Within it the third wave is now the shortest violating a core Elliott wave rule.
This means that we may now have further confidence in this bull market.
I shared this over at EWG so I’ll share it here too so no one misses out 🙂
Some light relief for you all.
My volunteer work is with the charitable trust that built a skate park in my town Mangawhai. We built the biggest skate bowl in the Southern Hemisphere, we’re really proud of this.
Every year our biggest event is the Mangawhai Bowl Jam. Here’s a roundup of this year’s event which was a couple of weeks ago. Best air at the end of the video…
It looks like minute iv may have been over already as a quick shallow zigzag.
Targets remain the same. I’m still holding onto my long position. I nearly closed it yesterday when I saw that bearish divergence with VIX, but decided to hold on as the balance remains bullish for now.
I wonder if that bearish divergence with VIX yesterday was an advance warning of minor wave 4?
Or could we have a little further to go in minute iii (perhaps minuette iii ended where you have minuette v labeledl; I think MACD would confirm this).
If Minor 3 completes at 2338, Minor 4 will be limited to 40 points as Minor 1 is 2298. That is not a whole lot of room. That is why I asked earlier about SPX often extending 5th waves.
Both good and valid points, thanks guys.
Minor 2 was very deep at 0.77 of minor 1. So I’ll be expecting minor 4 to be very shallow.
The bottom line is expect price to keep going up until the pink channel is breached.
When that pink channel is breached I’ll expect minor 3 is over and minor 4 has begun.
Lara,
Do I recall correctly that you have stated the SPX often behaves like a commodity, in that it often exhibits fifth wave extensions?
Yes, it can behave like that.
It would be good for the bulls to fill the gap down to SPX 2316 with this correction started today. At the same time as filling the gap, the daily SPX would come back inside it’s BB area. This could be a pause that refreshes. The target for Minor 3 is still 2338.
Looks like the gap is offering support, so now the last two gaps look like measuring gaps. So far.