
Upwards movement was expected for the main Elliott wave count, but the confirmation point still has not been passed.
Summary: It is increasingly likely that the next wave up has begun. This would be confirmed with a new all time high. The target is 2,338 for the short term and 2,382 for a longer term trade. If price breaks below 2,257.02, then a deeper pullback would be expected to be underway to end at the purple trend line.
New updates to this analysis are in bold.
Last monthly and weekly charts are here. Last historic analysis video is here.
MAIN ELLIOTT WAVE COUNT
WEEKLY CHART
Click chart to enlarge.
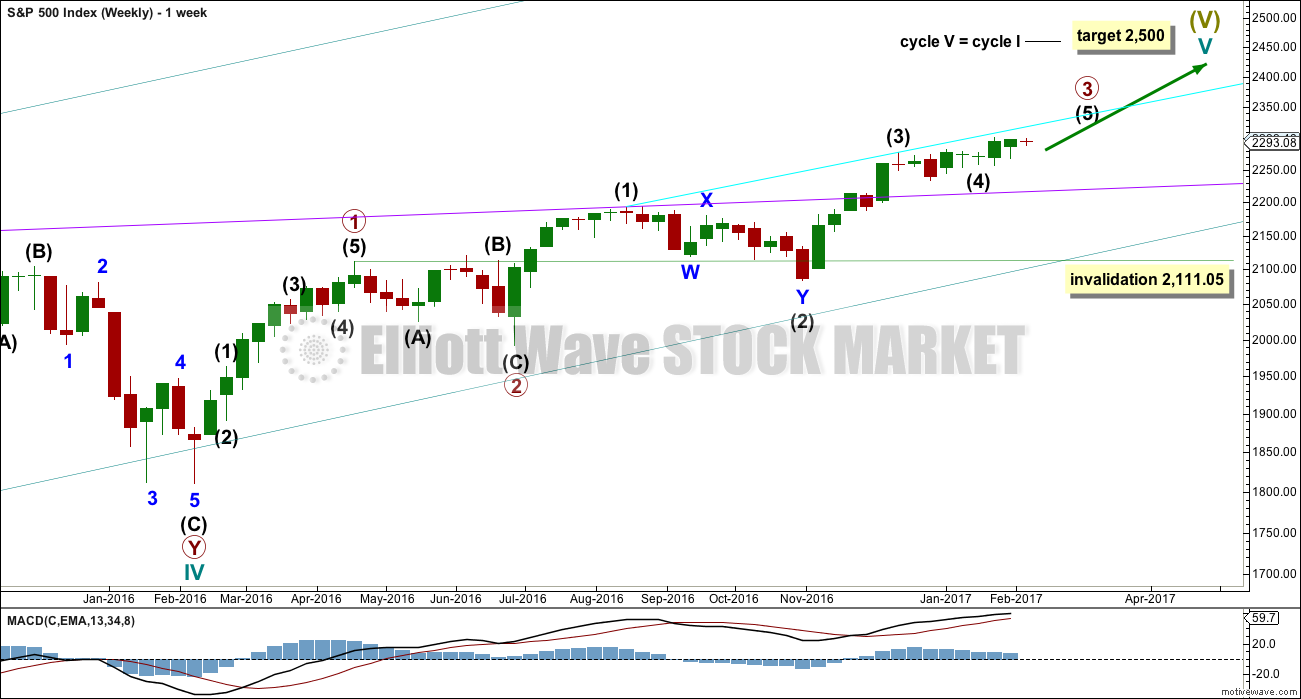
Cycle wave V is an incomplete structure. Within cycle wave V, primary wave 3 may be relatively close to completion.
When primary wave 3 is complete, then the following correction for primary wave 4 may not move into primary wave 1 price territory below 2,111.05.
Primary wave 2 was a flat correction lasting 47 days (not a Fibonacci number). Primary wave 4 may be expected to most likely be a zigzag, but it may also be a triangle if its structure exhibits alternation. If it is a zigzag, it may be more brief than primary wave 2, so a Fibonacci 21 sessions may be the initial expectation. If it is a triangle, then it may be a Fibonacci 34 or 55 sessions.
Primary wave 3 at this stage though is incomplete and may continue to move price higher.
DAILY CHART
Click chart to enlarge.
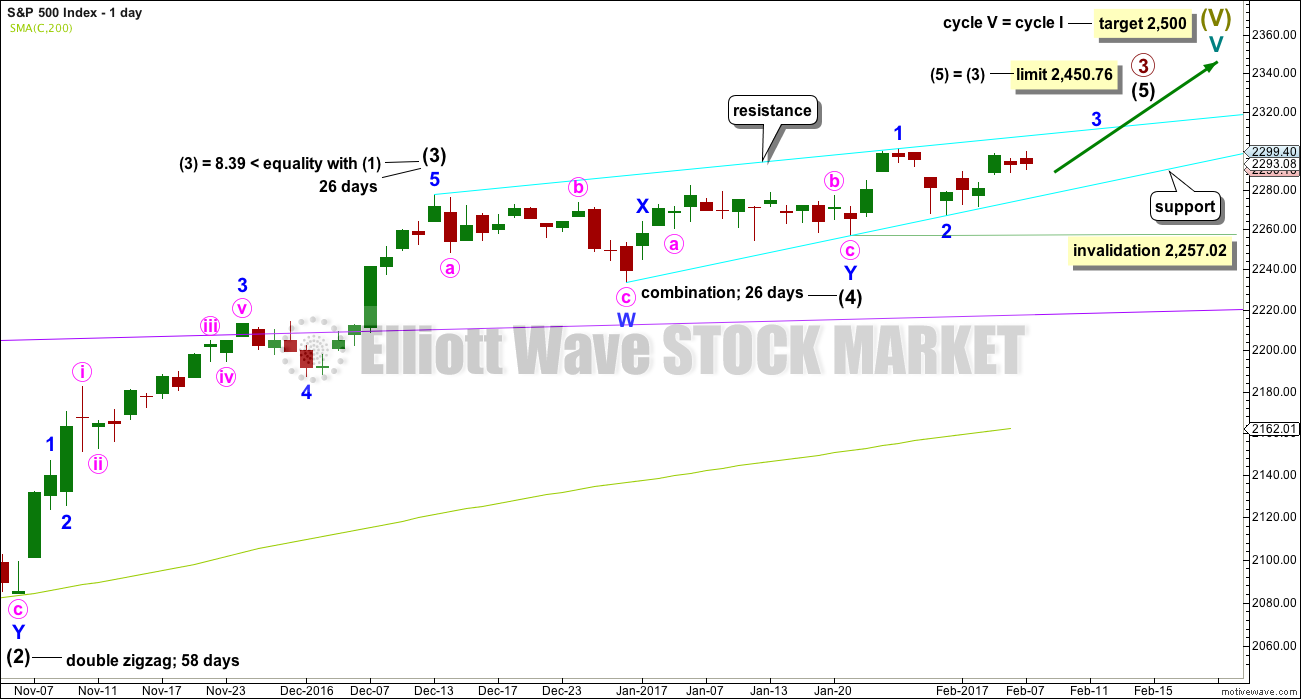
It is possible that intermediate wave (4) is a complete combination: zigzag – X – flat. It would have been even in duration with intermediate wave (3), both lasting 26 days.
Intermediate wave (3) is shorter than intermediate wave (1). One of the core Elliott wave rules states a third wave may never be the shortest wave, so this limits intermediate wave (5) to no longer than equality in length with intermediate wave (3) at 2,450.76.
Within intermediate wave (5), no second wave correction may move beyond its start below 2,257.02. Leaving the invalidation point here allows for the possibility that minor wave 2 may be continuing further as a regular flat correction.
Intermediate wave (5) has so far lasted just eleven days. It may be expected to be shorter both in length and duration compared to intermediate wave (3). At this stage, an expectation of a Fibonacci 21 days total for intermediate wave (5) looks reasonable, so it may now continue for another ten days or sessions.
The proportion here between intermediate waves (2) and (4) is acceptable. There is alternation. Both are labelled W-X-Y, but double zigzags are quite different structures to double combinations.
HOURLY CHART
Click chart to enlarge.
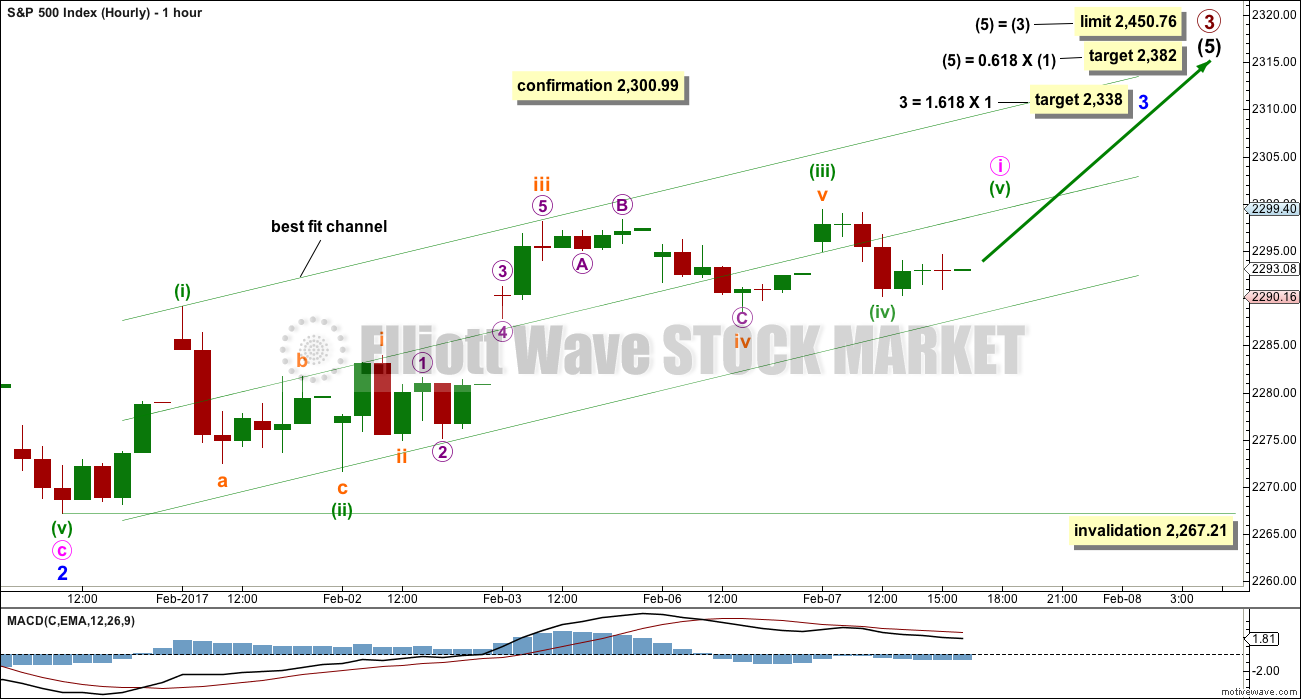
Intermediate wave (5) must subdivide as a five wave structure, either an impulse or an ending diagonal. At this stage, it is not possible to eliminate either option.
Within intermediate wave (5), minor waves 1 and 2 may be complete.
Within minor wave 3, the degree of labelling has today been moved down one degree. Only minute wave i may be close to completion. When it is complete, then another correction for minute wave ii should unfold and that may not move beyond the start of minute wave i below 2,267.21.
A new high above 2,300.99 would confirm this wave count and invalidate any alternate. At that stage, reasonable confidence in targets may be had.
The target for minor wave 3 assumes the most likely Fibonacci ratio for it to minor wave 1.
If price moves below 2,257.02, this main wave count would be invalidated and the alternate below would be confirmed.
ALTERNATE ELLIOTT WAVE COUNT
DAILY CHART
Click chart to enlarge.
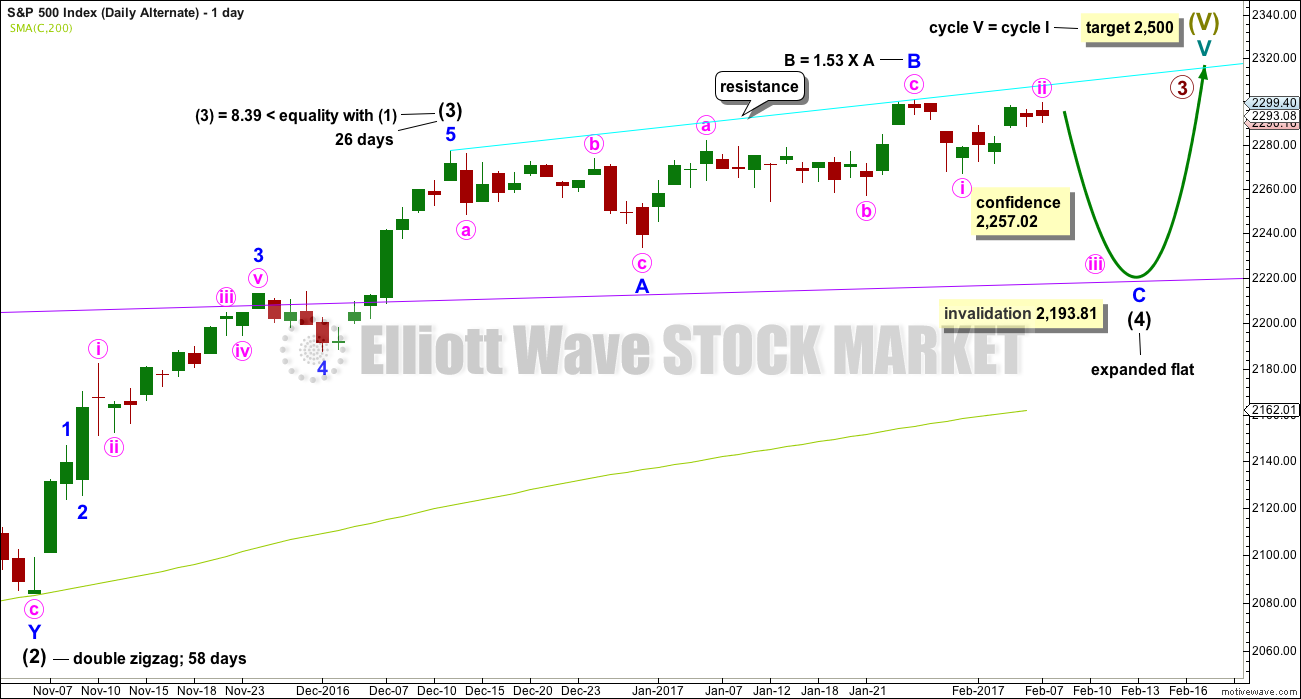
It remains possible that intermediate wave (4) is an incomplete expanded flat correction.
So far intermediate wave (4) may have lasted 37 sessions.
No target is given for minor wave C downwards because a target calculated using the Fibonacci ratio of 1.618 to minor wave A results in price falling short of the purple trend line. Minor wave C may end only when price comes down to touch the trend line again.
Minor wave B is now a 1.53 length to minor wave A. This is longer than the normal length of up to 1.38 but within the allowable convention of 2. The length of minor wave B has reduced the probability of this wave count.
Intermediate wave (4) may not move into intermediate wave (1) price territory below 2,193.81. It should find very strong support at the purple trend line and stop there.
HOURLY CHART
Click chart to enlarge.
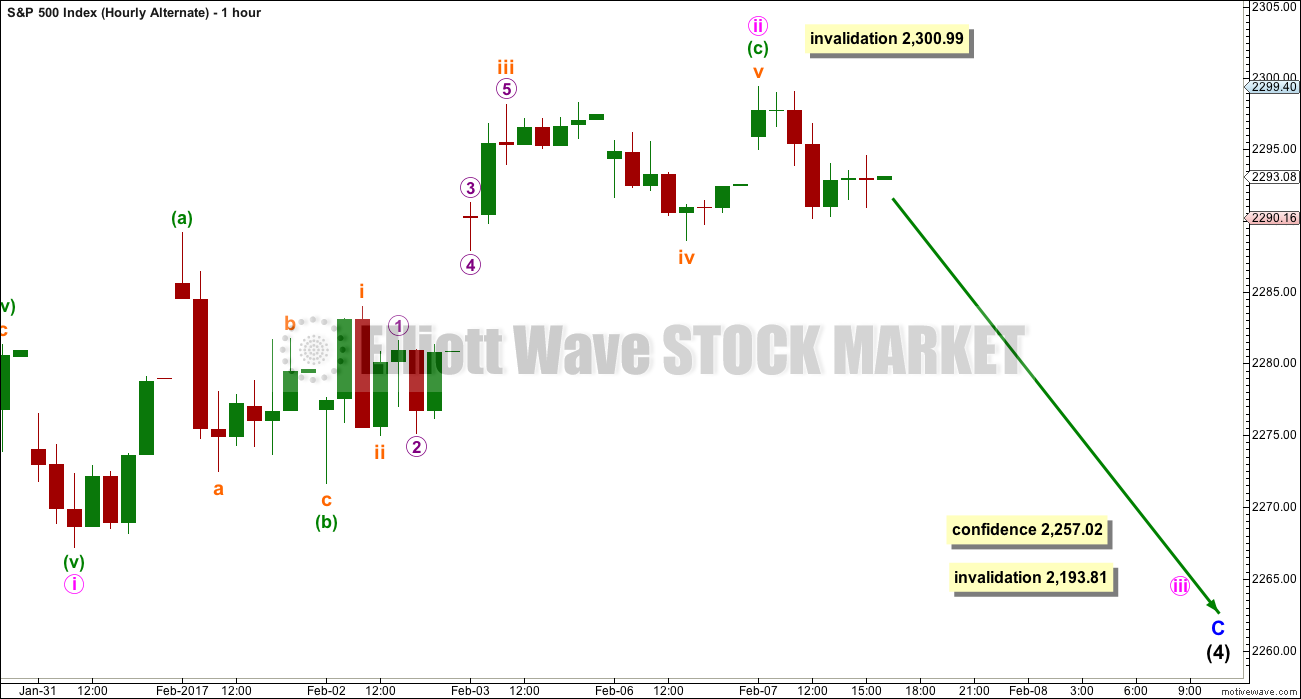
Minor wave C must subdivide as a five wave structure. At this stage, it may be an impulse.
An impulse downwards may have been complete for minute wave i. Upwards movement to follow it may be a complete zigzag for minute wave ii.
If minute wave ii continues higher, it may not move beyond the start of minute wave i above 2,300.99.
The depth of this second wave correction is valid, but it is slightly unusual. This has reduced the probability of this alternate wave count a little at the end of last week.
SECOND ALTERNATE ELLIOTT WAVE COUNT
DAILY CHART – DETAIL
Click chart to enlarge.
I will publish alternate ideas from time to time in response to members queries or concerns. This alternate idea is new.
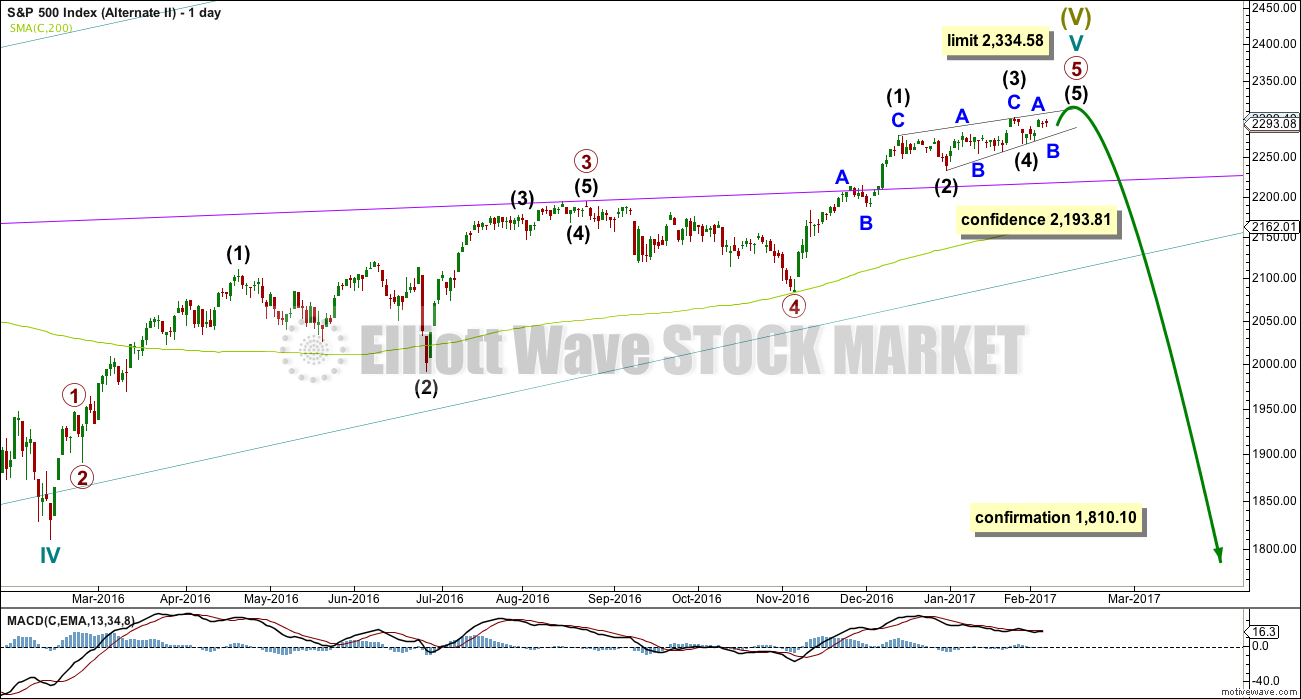
It does look suspiciously like an ending contracting diagonal may be underway and very close to completion.
Current upwards movement (which began on the 4th of November, 2016) must be a fifth wave for it to be an ending diagonal. That means that primary waves 1 through to 4 may be complete.
The only way for this to work and meet all Elliott wave rules is to see primary waves 1 and 2 over very quickly. This makes primary wave 3 longer than primary wave 1, so that the core rule stating a third wave may not be the shortest is met.
The ending diagonal is seen in more detail below.
DAILY CHART – DETAIL
Click chart to enlarge.
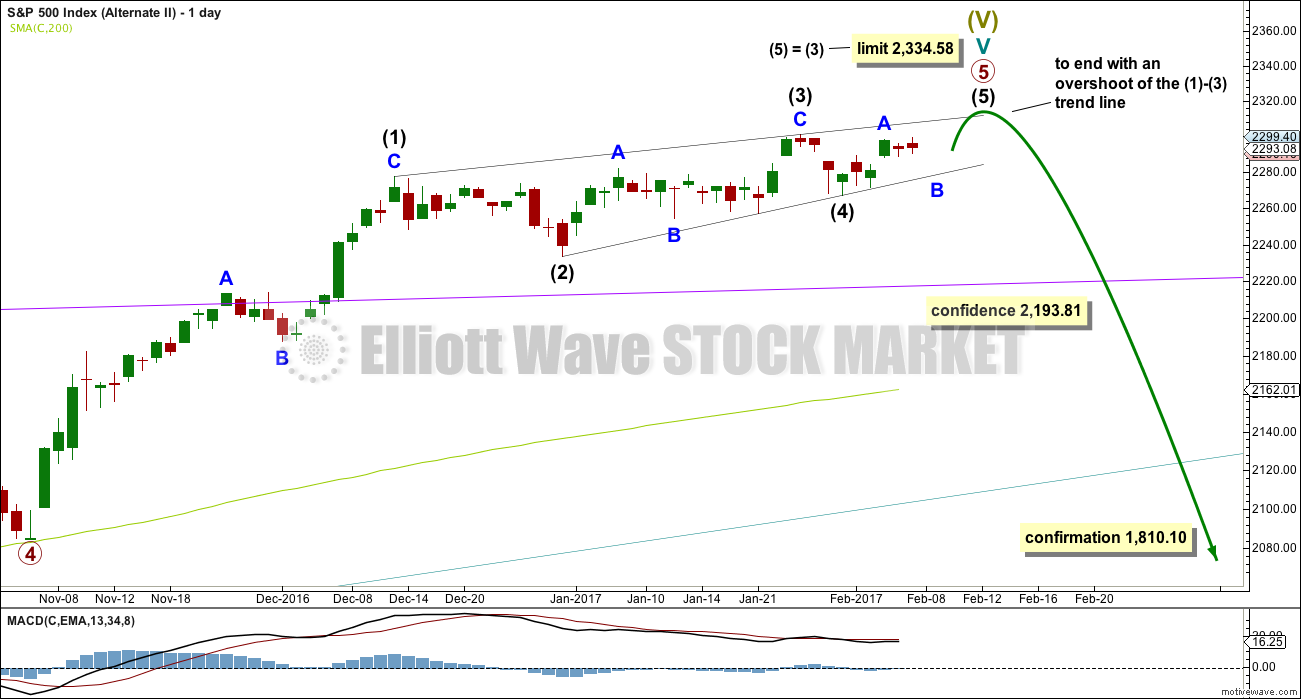
Ending contracting diagonals must have subwaves that all subdivide as zigzags. They normally end with a small overshoot of the 1-3 trend line.
If price makes a new all time high and slightly overshoots this line and then quickly reverses, then this wave count would be possible.
This wave count has some support from long term classic analysis at the monthly chart level, but it is not supported by Lowry’s analysis.
This wave count has a very low probability. It requires confidence below 2,193.81.
TECHNICAL ANALYSIS
WEEKLY CHART
Click chart to enlarge. Chart courtesy of StockCharts.com.
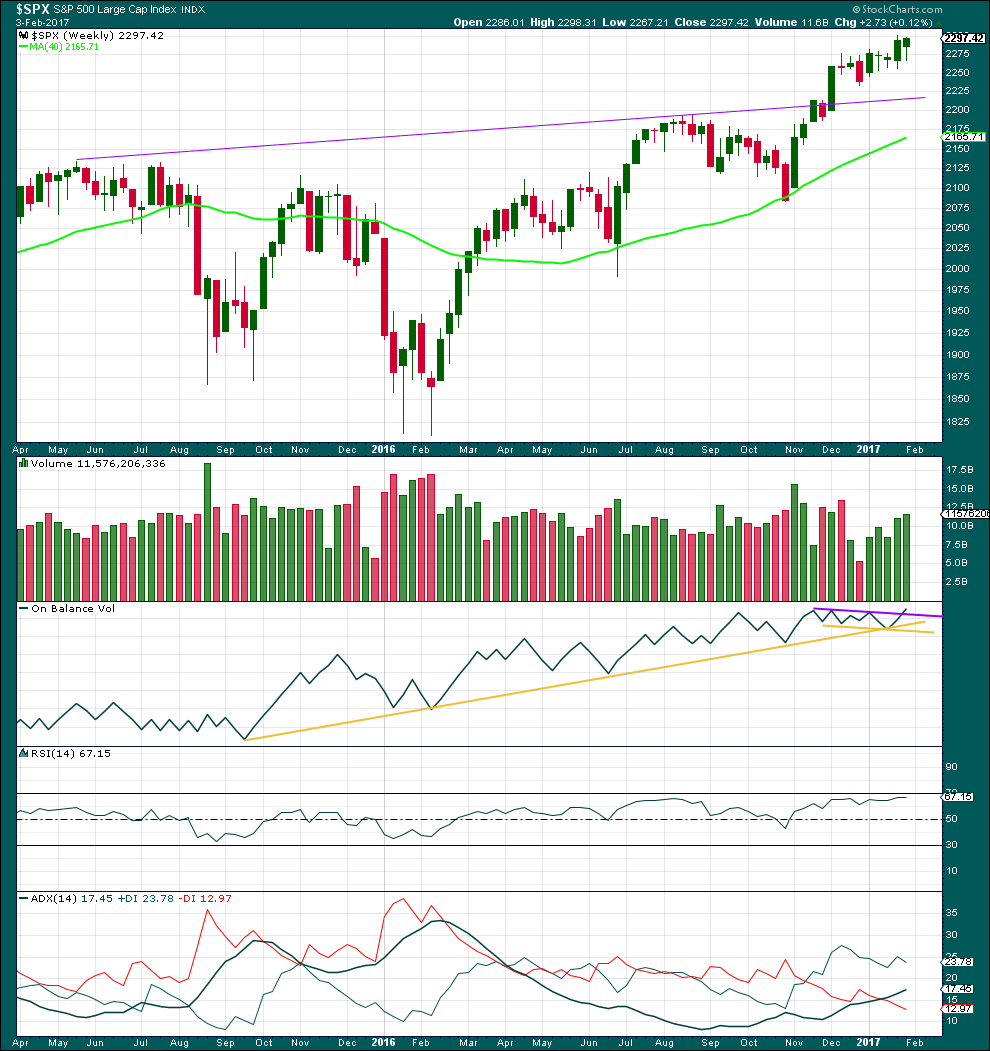
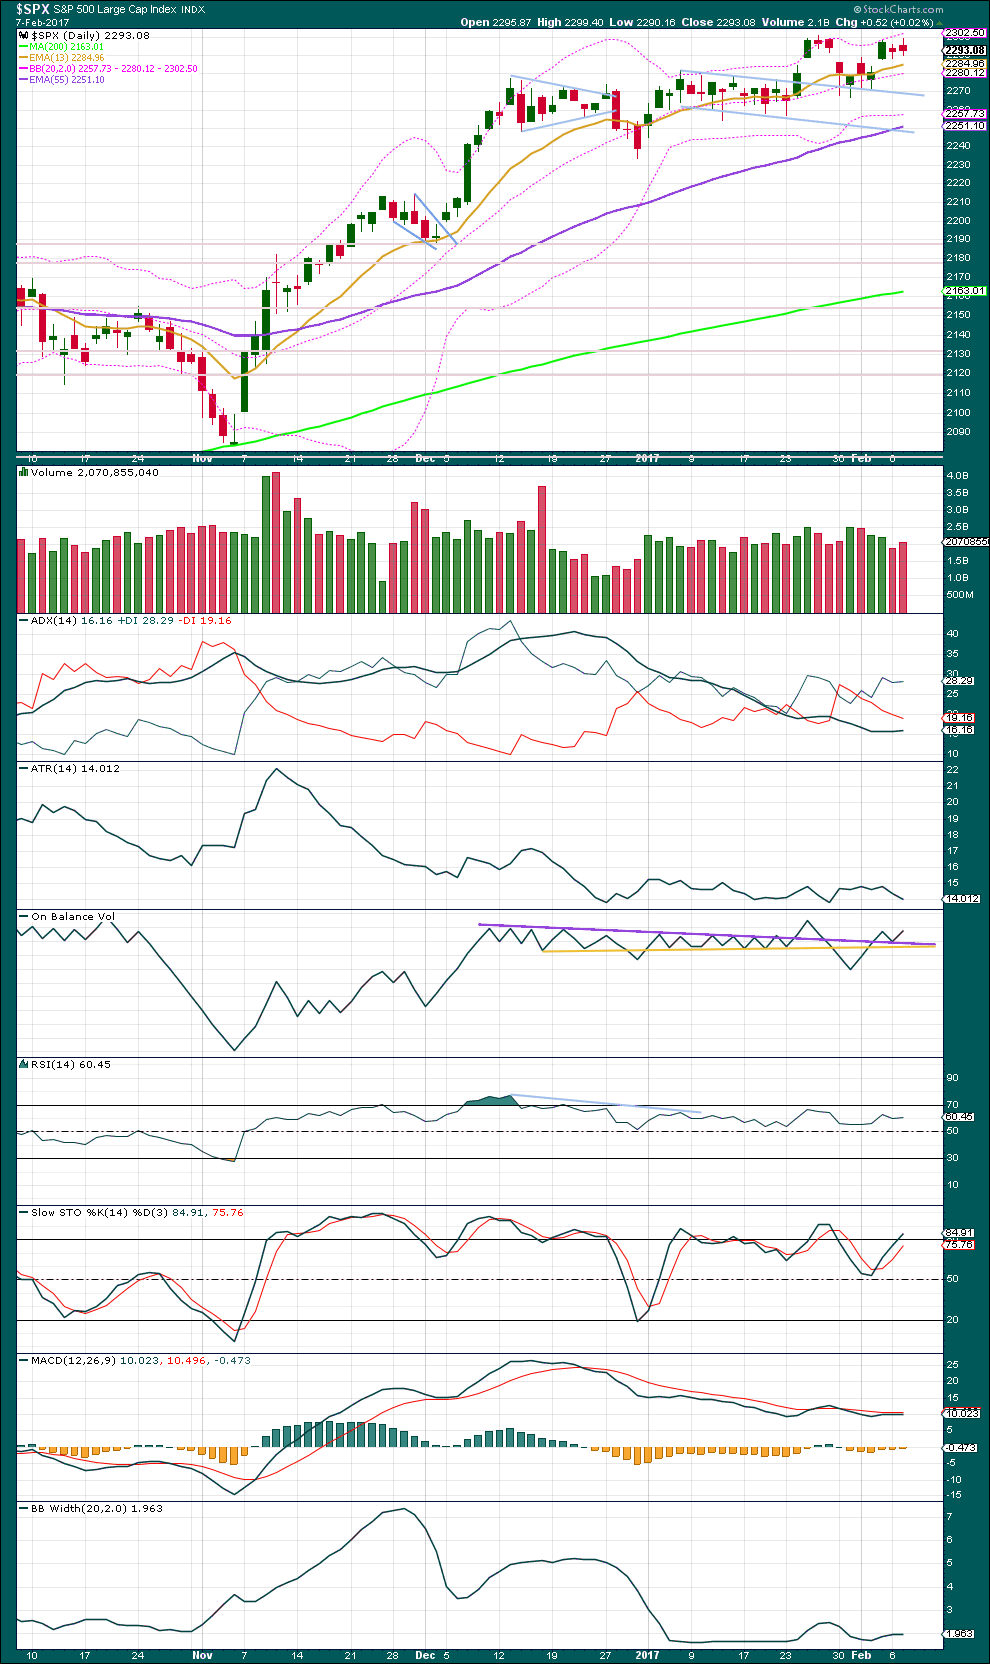
Overall, for five weeks in a row now, price has moved overall higher and volume is still increasing. The longer term picture at this weekly chart level looks like this market is in a reasonably healthy bull trend.
The long lower wick on this weekly candlestick is bullish. This week saw a further increase in volume, also bullish.
On Balance Volume has given an important bullish signal here with a break above the purple line. This line has a shallow slope and has been tested three times prior. This is a reasonable bullish signal.
RSI is not overbought. There is room for price to rise. There is no short or mid term divergence with price and RSI to indicate weakness.
ADX is above 15 and rising indicating a trend. The +DX line is above the -DX line; the trend is up. It is not yet anywhere near extreme. There is plenty of room for this trend to continue.
Overall, the picture on this weekly chart is very bullish. That does not mean the alternate Elliott wave count cannot be correct; it only means the probability of the alternate is lower than the main wave count.
DAILY CHART
Click chart to enlarge. Chart courtesy of StockCharts.com.
Although the session closed red, price moved higher today with a higher high and a higher low and the balance of volume was upwards. An increase in volume for an upwards day today supports the main Elliott wave count.
ADX still indicates an upwards trend in the early stages. ATR disagrees as it is declining.
The purple resistance line on On Balance Volume has again been slightly adjusted today. OBV bounced up from here giving a weak bullish signal today. This supports the main Elliott wave count, but only slightly.
RSI is not overbought and there is no short term divergence between the last two highs and price to indicate near term weakness.
Stochastics is again entering overbought, but this oscillator may remain extreme for reasonable periods of time during a trending market.
MACD remains bearish.
Bollinger Bands remain very tightly contracted. Volatility will return to the market again.
Price has been finding current resistance about 2,300 and support about 2,255. For confidence in the main Elliott wave count, price needs to break above 2,300 on an upwards day with an increase in volume.
VOLATILITY – INVERTED VIX CHART
Click chart to enlarge. Chart courtesy of StockCharts.com.
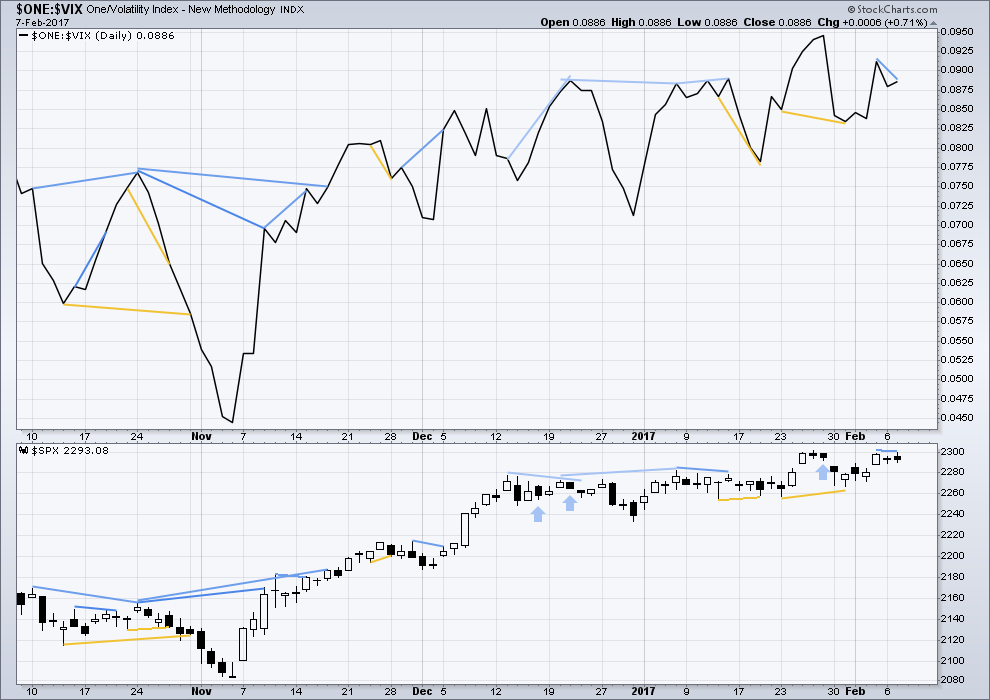
There are a few instances of multi day divergence between price and inverted VIX noted here. Bearish divergence is blue. Bullish divergence is yellow. It appears so far that divergence between inverted VIX and price is mostly working to indicate short term movements spanning one or two days. While this seems to be working more often than not, it is not always working. As with everything in technical analysis, there is nothing that is certain. This is an exercise in probability.
Price made a very slight new high above the prior high two days ago, but inverted VIX has failed to make a corresponding high. This is regular bearish divergence and indicates weakness in upwards movement. The divergence is slight though because the new high for price was by only 1.09 points. This divergence today very slightly supports the first alternate Elliott wave count.
BREADTH – AD LINE
Click chart to enlarge. Chart courtesy of StockCharts.com.
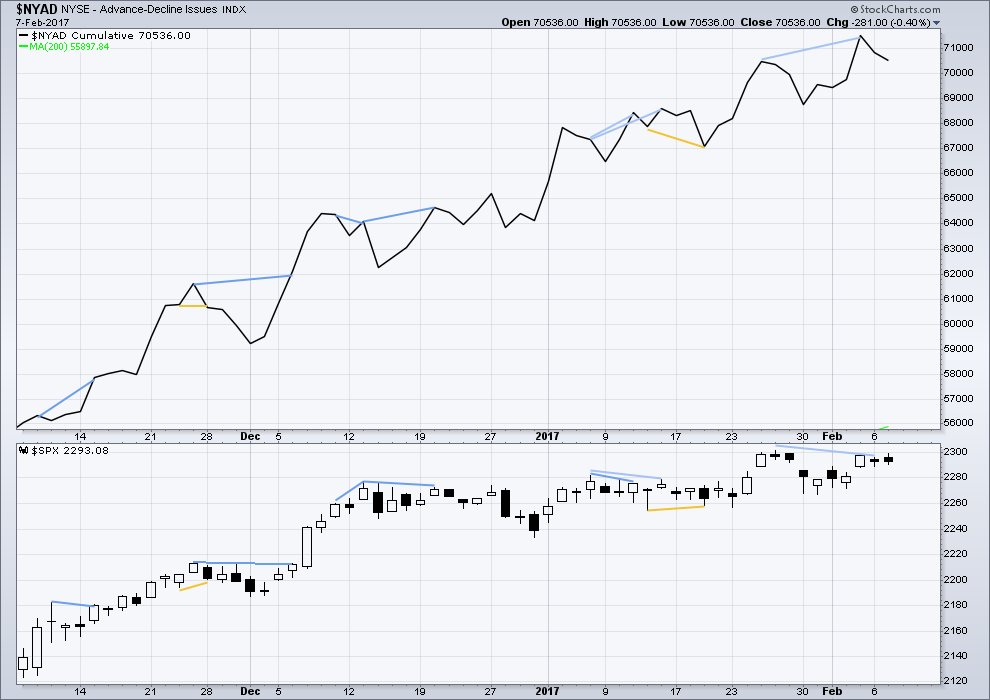
Some bearish divergence noted two days ago between price and the AD line has been followed by one red daily candlestick. It may be resolved here.
DOW THEORY
The DJIA, DJT, S&P500 and Nasdaq have made new all time highs in December of 2016. This confirms a bull market continues.
This analysis is published @ 10:07 p.m. EST.
If anyone here at EWSM missed it, I’ve done the first in a series of Traders Room posts over at Elliott Wave Gold. It’s free and open to the public, and will be for some months.
I’m planning on doing this twice weekly minimum. So go have a look and let me know if you can see any tweaks I can make to make it better.
Let’s all make some money!
Thank you Lara. Where do I go to see that? I tried opening the EWGA but was not permitted. Perhaps I am missing something.
The S&P is a bit of a pain, quite often. I have other words to describe this market, but they’re not appropriate here
The proportions between it’s second and fourth waves just aren’t always very good. It throws off the wave count, it makes fives look like threes.
I think minute i is finished and within it minuette (ii) and minuette (iv) are disproportionate.
This wave count meets all EW rules, there are no truncations and no rare structures. It has a good probability. The last three days may have been an expanded flat for minute wave ii completing.
If this is correct then it has offered a good opportunity to join an upwards trend at a good price at todays low.
I do have a few choice words myself! 🙂
On another not directly related topic, anyone noticing the complete news black-out on what is happening at the Fukushima nuclear plant? The ocean life in the Pacific is already in a death spiral, and now it appears they have discovered new alarmingly high levels of radiation that strongly suggests that there has been another core breach. The levels are so high that even attempts at remediation using robotics only gives them a window of operation of a few hours per unit. This is a terrifying development and hardly anyone is reporting on what is happening. California is going to have a very serious problem if it does not already. It supplies edible stuff to an awful lot of folk….
I saw a headline about Fukushima today, Verne.
Things like this, along with increased political tensions seemingly everywhere and unprecedented market complacency, suggests that we may be nearer to a deep market melt down than many suspect.
Wishful thinking on my part? Possibly. But the ending diagonal alternate wave count would seem to fit (until it doesn’t).
Hi, Lara
Main Hourly chart: That opening candle on Feb1 that reached up to 2289.14 (i) is playing havoc with the subsequent labels after this morning’s overlap of (i). Does this in any lessen the probability of the Main Daily??
Anxiously await tonight’s update.
Nope. Chart to follow…
I realise the ED has a low probability but to my mind offers the best explanation for the price action we have seen the past many months. Most other scenarios have left me completely befuddled, ergo my own ongoing reticence…
I have been watching IWM. It is interesting that it has been in a narrow trading range since mid-December. I’m reluctant to say it is a bull flag. But I am watching to see if it breaks out one way or the other. I think this will be a telling clue, at least short term.
Rodney, thanks for pointing out IWM. I’ve had tunnel vision on SPX/SPY for so long I’ve neglected QQQ and IWM. A pop from IWM would be very welcome regardless of the direction.
Rodney, during this consolidation which day or days have strongest volume? Up or down? That gives a clue as to the likely direction for a breakout.
Thank you. Here is the blown up chart showing volume and on-balance volume.
Thanks for that info, interesting. Looks like heavy vol on down days. Also IWM has broken down below its 50 day moving avg. qqq still well above its 50 day mavg. Stoch, macd already going down for a while, unlike qqq. The q’s are holding up better than any other market and in my opinion have the most to fall. The Russell, if it breaks down out of this pattern may be an early signal to short the qs. Lara’s Lowry observation has me hesitant here. If Iwm breaks out to the upside, it may have more room to roam since it would have worked off some of its overbought situation. we could hit an air pocket at any time with these markets. The catalyst could be anything, so I think being nimble is the key, and patient. Stalk your market.
To be fair, Lowry’s do see a short term increase in bearishness and they do allow for a deeper pullback here.
What their analysis does not support is the second alternate Elliott wave count.
My first alternate still fits well within what Lowry’s have to say.
I’m using their service mostly as assistance in finding the eventual end to this bull market, not for short or even mid term volatility.
In Chris Ciovacco’s words; “volatility to be ignored” would be the description given to a pullback here. The trend would still be up.
I agree Verne, and to your point, very wealthy investors have been continually easing out of the markets; many of them able to see the manipulation and nationalization of the markets on a global scale. All the gaps up and down and chop near highs have historically represented distribution not accumulation, so you have that as well. Being in the mix everyday though has made me loose faith in the capital markets in general and no amount of positive price action could ever reverse that.
Interesting you mention that Chris. I recently saw a graph of the “dumb” vs “smart” money position profiles and it is indeed exactly as you describe – ever a cautionary note. Rodney’s observation about IWM is also something I have been watching and it does look like a bull flag to be honest. Considering the level of investor bullishness that we are currently seeing, I am of the opinion that even if it breaks to the upside we could still be looking at a terminal move. It is clear to even the most casual observer that central banksters have taken the position that “The market shall not decline!”. Not even by a few percentage points, and they seem hell-bent on flooding the market with cash at every sign of weakness. At some point this is going to end folk. I have the nagging feeling that considering the banksters long-standing posture, how are we supposed to know if the next substantial move down is just another correction, or they have finally lost control? I have been patiently waiting for a long entry with what I feel should have been at a minimal, a retest of the break-out area, but I am still waiting. I could be missing something….
I don’t think you’re missing anything Verne, the whole thing is FUBAR. To add insult to injury, after pulling in record taxes the gov’t still managed to loose over $1trillion last year. Talk about having no ammo left…..
I’m rooting for the ED if only to put an end to this tired market.
As we all know too well by now, low probability doesn’t mean no probability.
Lowry’s are pretty bullish though, so that is one reason I judge that count to have a low probability. They see a rising trend in buying power, and a falling trend in selling pressure, normal for a healthy bull market.
Their Operating Companies Only AD line has one single divergence with price now. This is nowhere near enough to call a high, normally before a significant high in a bull market the OCO AD line shows a series of divergences spanning about a year.
There is no intense selling in small caps, that’s normal approaching a market top.
So the usual signs of a market top are not there, yet.
That wave count has a really low probability.
Looks like the Main Hourly needs some re-labeling. If this morning’s dip was a continuation of wave (iv), it has now overlapped wave (i). Any ideas?
Hourly Alternates I and II still in play.
woo hoo,, first!! whew that was a close one…
ROTFL Doc 🙂
Careful with that rolling on the floor Lara…you may end up needing Doc’s ministrations!
I think the huge amount of surfing I’ve been doing these last 2 weeks may make that pretty likely actually.
It’s an onshore mess today, and I’m so physically exhausted I need a break.
I’ve had so many waves (minimum 20 per session over 2-3 hours) my legs are actually sore, not just my arms!
So stoked for you Lara! I got a nice barrel on my last wave this past Sunday, but most sessions have been 10-12 waves, with one or two turns. Loads of windswell here in Fla, not the typical winter. Europe and Hawaii have had some giant swells!
Awesome 🙂 I’ve never had a barrel yet. I’m getting close… I have the stance and draw the line well, but I’ve not managed to find it yet. To be fair, the waves here rarely get bigger than 3ft so it’s not easy.
I’d love to go and surf Hawaii! Warm water… nice waves
gnarly