
Upwards movement was expected to begin the week, but this is not what happened.
Price remains above the invalidation point on the main Elliott wave count.
Summary: It is increasingly likely that the next wave up has begun. This would be confirmed with a new all time high. The target is 2,338 for the short term and 2,382 for a longer term trade. If price breaks below 2,257.02, then a deeper pullback would be expected to be underway to end at the purple trend line.
New updates to this analysis are in bold.
Last monthly and weekly charts are here. Last historic analysis video is here.
MAIN ELLIOTT WAVE COUNT
WEEKLY CHART
Click chart to enlarge.
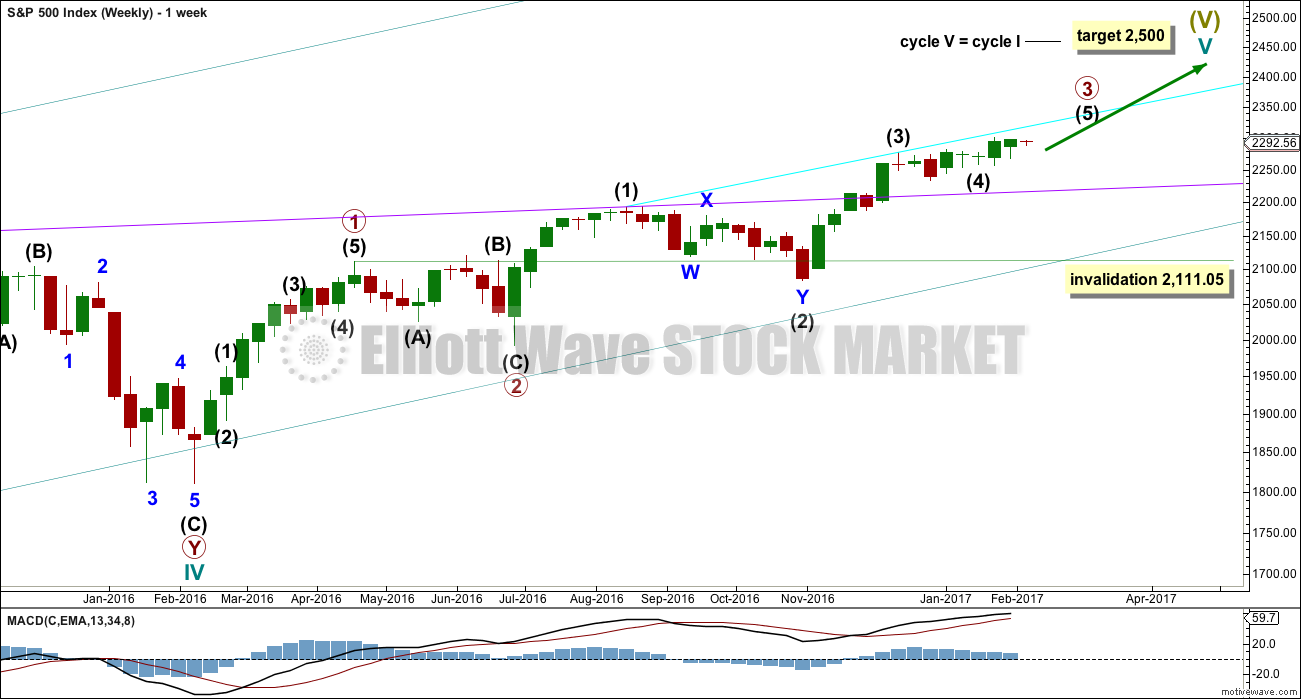
Cycle wave V is an incomplete structure. Within cycle wave V, primary wave 3 may be relatively close to completion.
When primary wave 3 is complete, then the following correction for primary wave 4 may not move into primary wave 1 price territory below 2,111.05.
Primary wave 2 was a flat correction lasting 47 days (not a Fibonacci number). Primary wave 4 may be expected to most likely be a zigzag, but it may also be a triangle if its structure exhibits alternation. If it is a zigzag, it may be more brief than primary wave 2, so a Fibonacci 21 sessions may be the initial expectation. If it is a triangle, then it may be a Fibonacci 34 or 55 sessions.
Primary wave 3 at this stage though is incomplete and may continue to move price higher.
DAILY CHART
Click chart to enlarge.
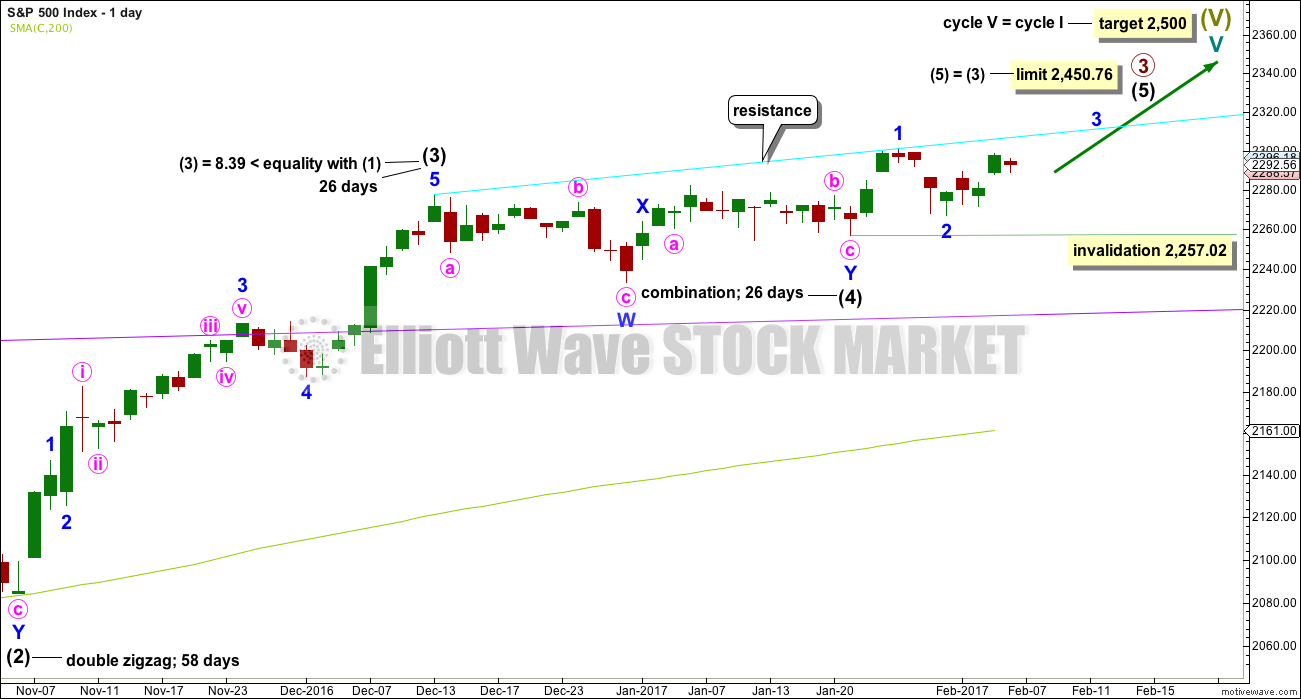
It is possible that intermediate wave (4) is a complete combination: zigzag – X – flat. It would have been even in duration with intermediate wave (3), both lasting 26 days.
Intermediate wave (3) is shorter than intermediate wave (1). One of the core Elliott wave rules states a third wave may never be the shortest wave, so this limits intermediate wave (5) to no longer than equality in length with intermediate wave (3) at 2,450.76.
Within intermediate wave (5), no second wave correction may move beyond its start below 2,257.02.
Intermediate wave (5) has so far lasted just ten days. It may be expected to be shorter both in length and duration compared to intermediate wave (3). At this stage, an expectation of a Fibonacci 21 days total for intermediate wave (5) looks reasonable, so it may now continue for another eleven days or sessions.
The proportion here between intermediate waves (2) and (4) is acceptable. There is alternation. Both are labelled W-X-Y, but double zigzags are quite different structures to double combinations.
HOURLY CHART
Click chart to enlarge.
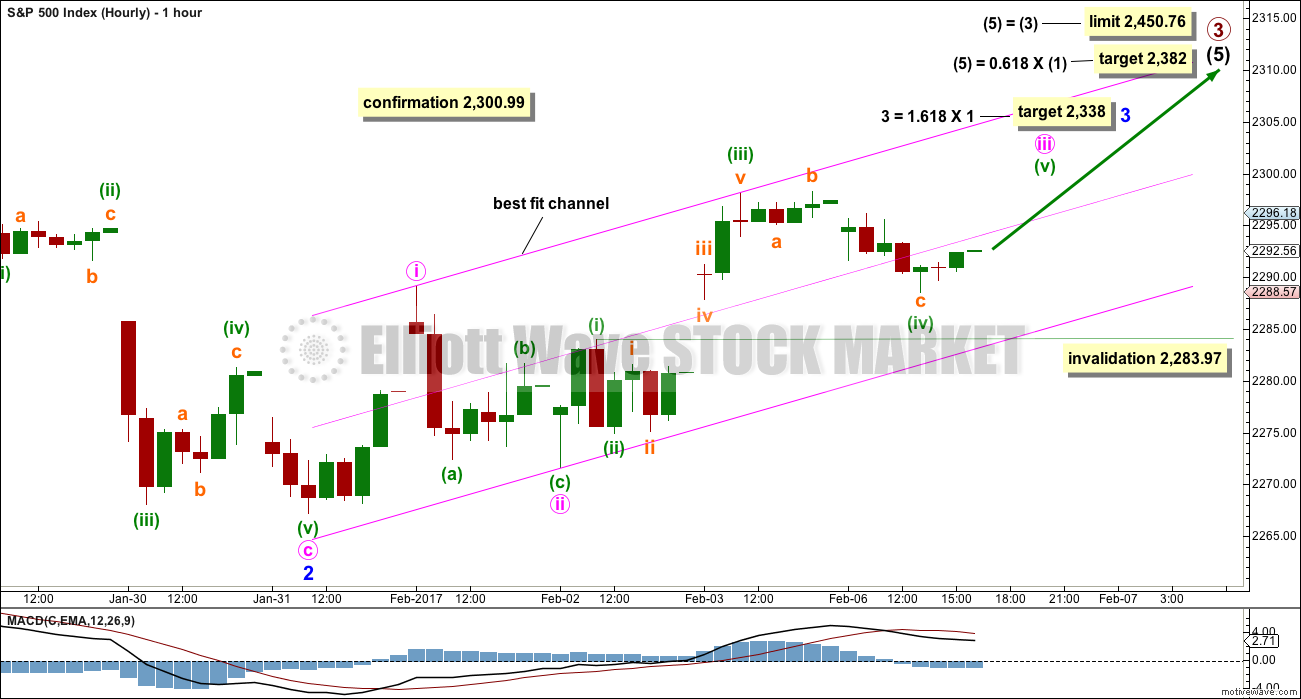
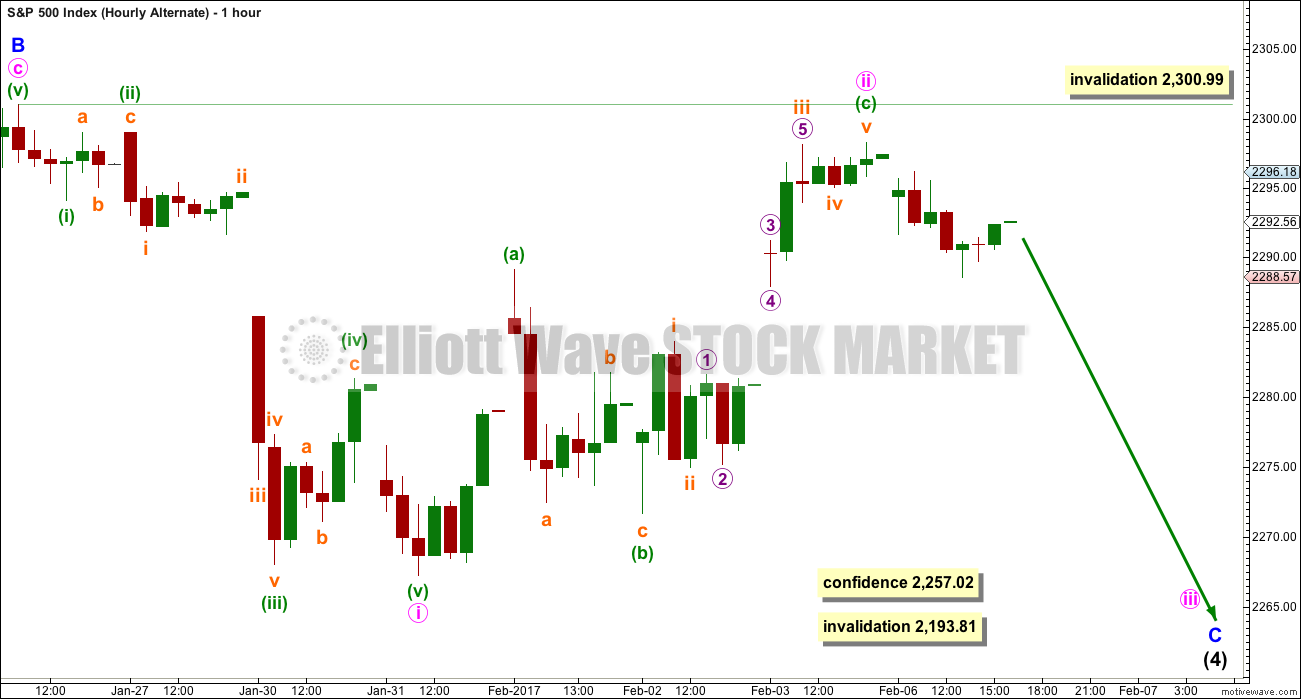
Intermediate wave (5) must subdivide as a five wave structure, either an impulse or an ending diagonal. At this stage, it is not possible to eliminate either option.
Within intermediate wave (5), minor waves 1 and 2 may be complete.
Within minor wave 3, minute waves i and ii may be complete. Minute wave iii may only subdivide as an impulse. It is not possible that it is over. Downwards movement for this session, which is labelled minuette wave (iv), may not be minute wave iv because it has slightly overlapped into minute wave i price territory.
Downwards movement for this session may be minuette wave (iv). If it continues lower tomorrow, it may not move into minuette wave (i) price territory below 2,283.97.
The channel today is adjusted slightly to fit upwards movement better. There is some resistance and support also about the mid line. Minor wave 3 may have the power to break above the upper edge of this channel.
A new high above 2,300.99 would confirm this wave count and invalidate any alternate. At that stage, reasonable confidence in targets may be had.
The target for minor wave 3 assumes the most likely Fibonacci ratio for it to minor wave 1. Minor wave 3 may last about a Fibonacci five days.
If price moves below 2,257.02, this main wave count would be invalidated and the alternate below would be confirmed.
ALTERNATE ELLIOTT WAVE COUNT
DAILY CHART
Click chart to enlarge.
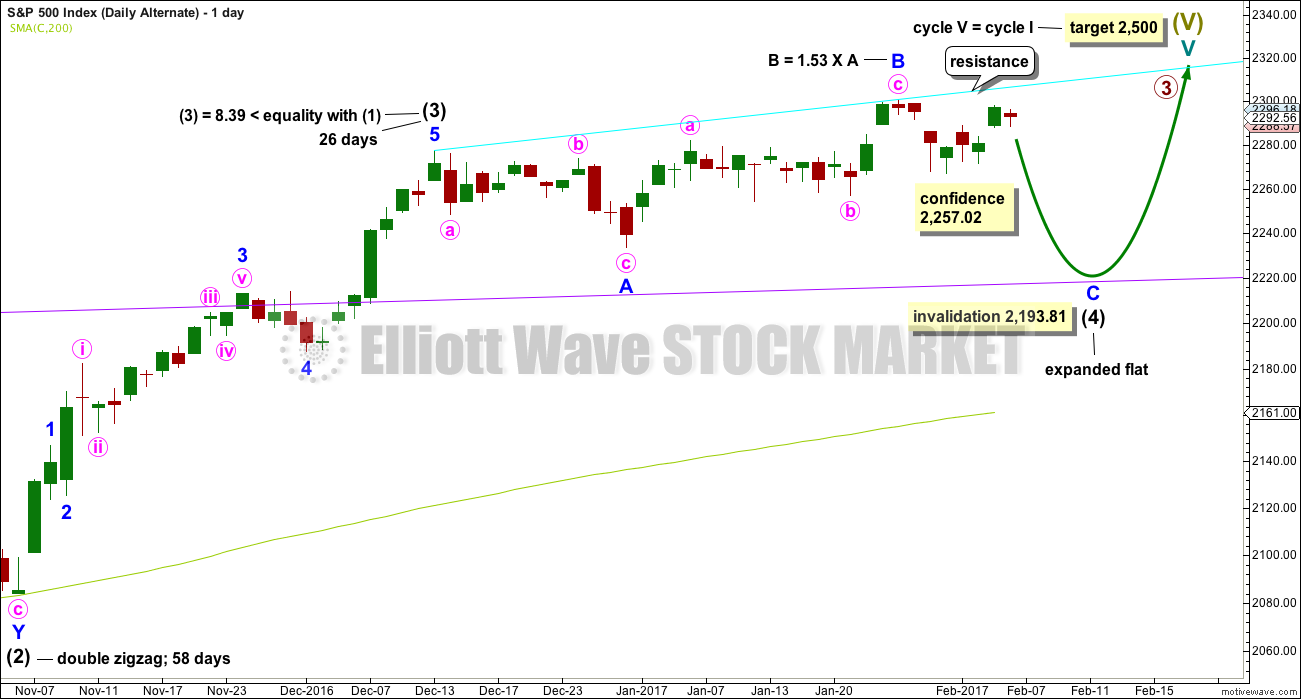
It remains possible that intermediate wave (4) is an incomplete expanded flat correction.
So far intermediate wave (4) may have lasted 36 sessions.
No target is given for minor wave C downwards because a target calculated using the Fibonacci ratio of 1.618 to minor wave A results in price falling short of the purple trend line. Minor wave C may end only when price comes down to touch the trend line again.
Minor wave B is now a 1.53 length to minor wave A. This is longer than the normal length of up to 1.38 but within the allowable convention of 2. The length of minor wave B has reduced the probability of this wave count.
Intermediate wave (4) may not move into intermediate wave (1) price territory below 2,193.81. It should find very strong support at the purple trend line and stop there.
HOURLY CHART
Click chart to enlarge.
Minor wave C must subdivide as a five wave structure. At this stage, it may be an impulse.
An impulse downwards may have been complete for minute wave i. Upwards movement to follow it may be a complete zigzag for minute wave ii.
If minute wave ii continues higher, it may not move beyond the start of minute wave i above 2,300.99.
The depth of this second wave correction is valid, but it is slightly unusual. This has reduced the probability of this alternate wave count a little at the end of last week.
TECHNICAL ANALYSIS
WEEKLY CHART
Click chart to enlarge. Chart courtesy of StockCharts.com.
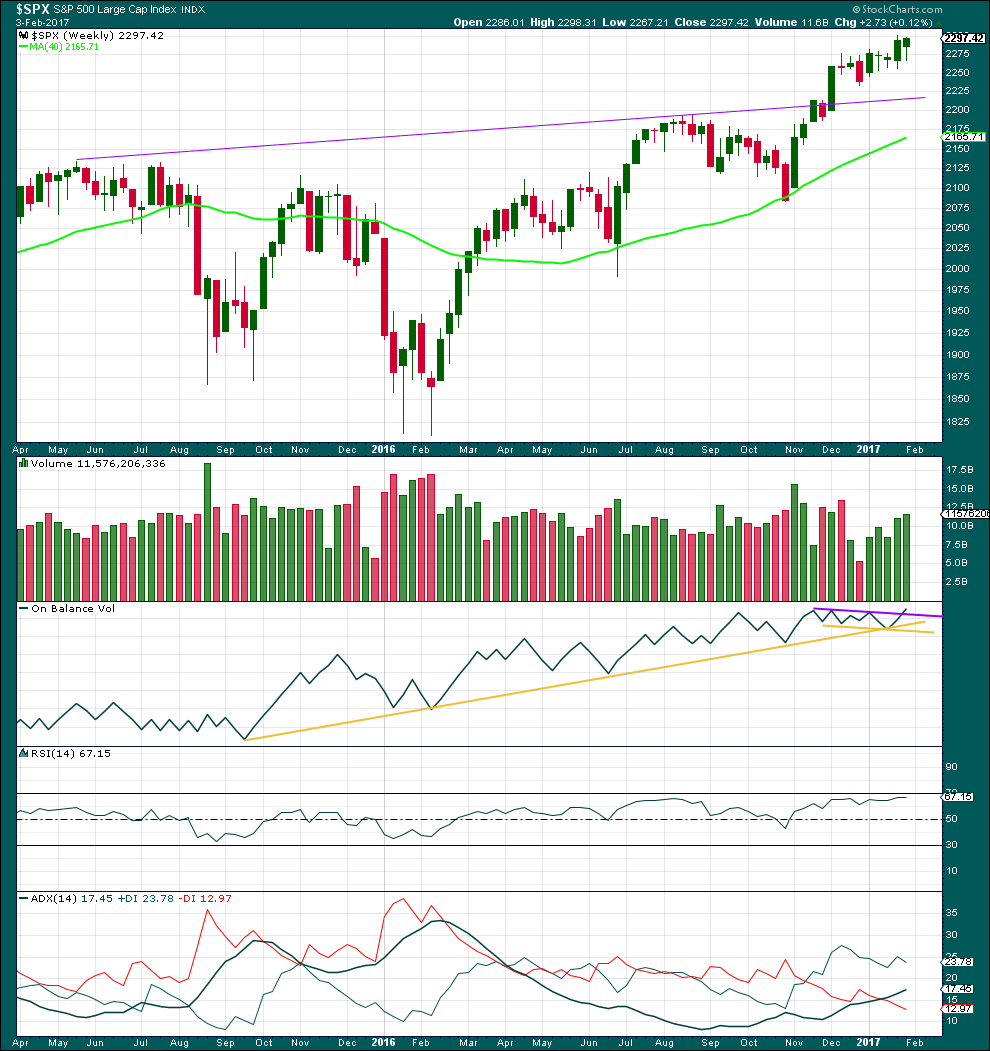
Overall, for five weeks in a row now, price has moved overall higher and volume is still increasing. The longer term picture at this weekly chart level looks like this market is in a reasonably healthy bull trend.
The long lower wick on this weekly candlestick is bullish. This week saw a further increase in volume, also bullish.
On Balance Volume has given an important bullish signal here with a break above the purple line. This line has a shallow slope and has been tested three times prior. This is a reasonable bullish signal.
RSI is not overbought. There is room for price to rise. There is no short or mid term divergence with price and RSI to indicate weakness.
ADX is above 15 and rising indicating a trend. The +DX line is above the -DX line; the trend is up. It is not yet anywhere near extreme. There is plenty of room for this trend to continue.
Overall, the picture on this weekly chart is very bullish. That does not mean the alternate Elliott wave count cannot be correct; it only means the probability of the alternate is lower than the main wave count.
DAILY CHART
Click chart to enlarge. Chart courtesy of StockCharts.com.
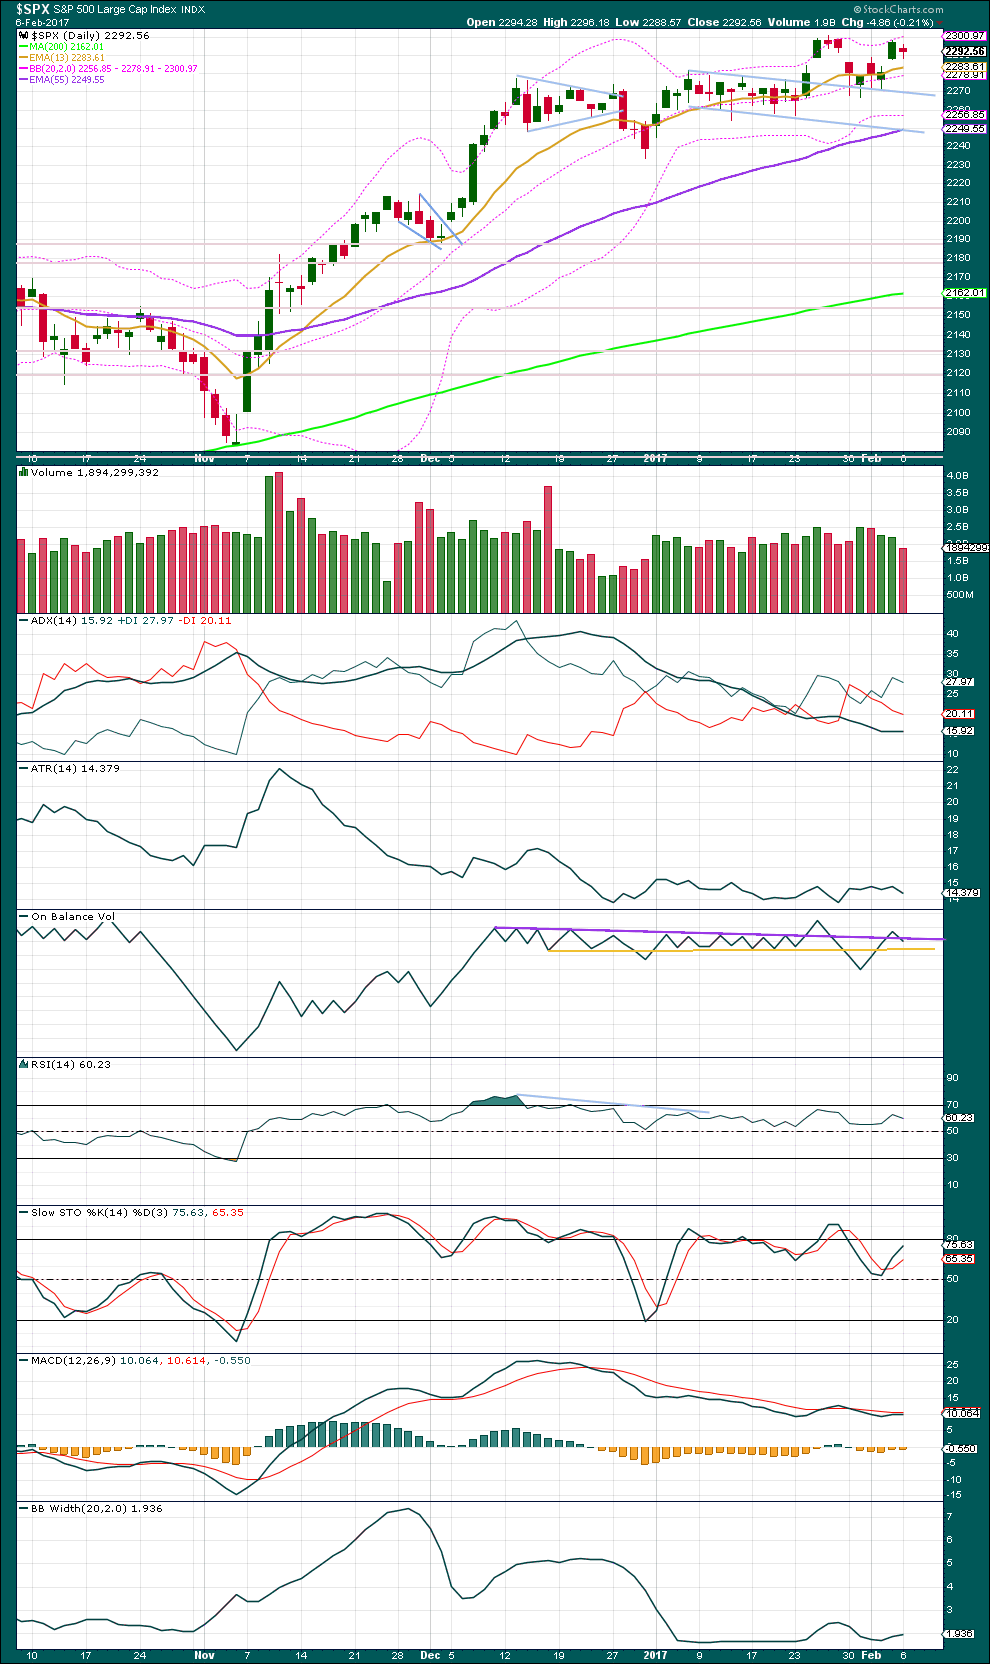
A small inside day moved price lower during the session and the balance of volume was downwards. Volume for downwards movement today is lighter than prior upwards days. This is bullish.
ADX is still above 15 and showing a further slight increase today. This indicates a potential early stage of the next trend. The trend is indicated as upwards and it would have a long way to go before it reaches extreme.
ATR today shows a slight decline as price corrected. Overall, ATR has not yet shown an increase and remains flat.
On Balance Volume has slightly breached the purple line again. This line is weakened and no longer holds strong technical significance. The yellow line may provide some support.
RSI is not extreme. There is room for price to rise. Stochastics also is not extreme.
MACD is bearish.
Bollinger Bands showed a slight widening for the last two sessions, so some volatility may be about to return to this market. Lately, when the S&P trends, it can remain at the extreme edge of Bollinger Bands for several sessions. It is close to but not there today.
VOLATILITY – INVERTED VIX CHART
Click chart to enlarge. Chart courtesy of StockCharts.com.
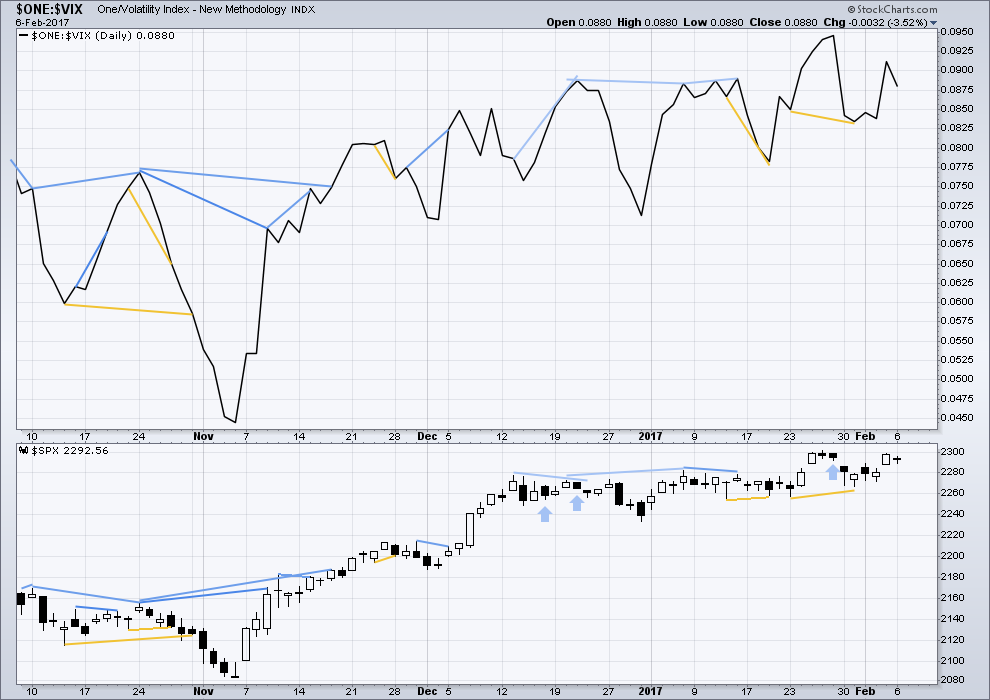
There are a few instances of multi day divergence between price and inverted VIX noted here. Bearish divergence is blue. Bullish divergence is yellow. It appears so far that divergence between inverted VIX and price is mostly working to indicate short term movements spanning one or two days. While this seems to be working more often than not, it is not always working. As with everything in technical analysis, there is nothing that is certain. This is an exercise in probability.
No new divergence is noted between price and inverted VIX today.
BREADTH – AD LINE
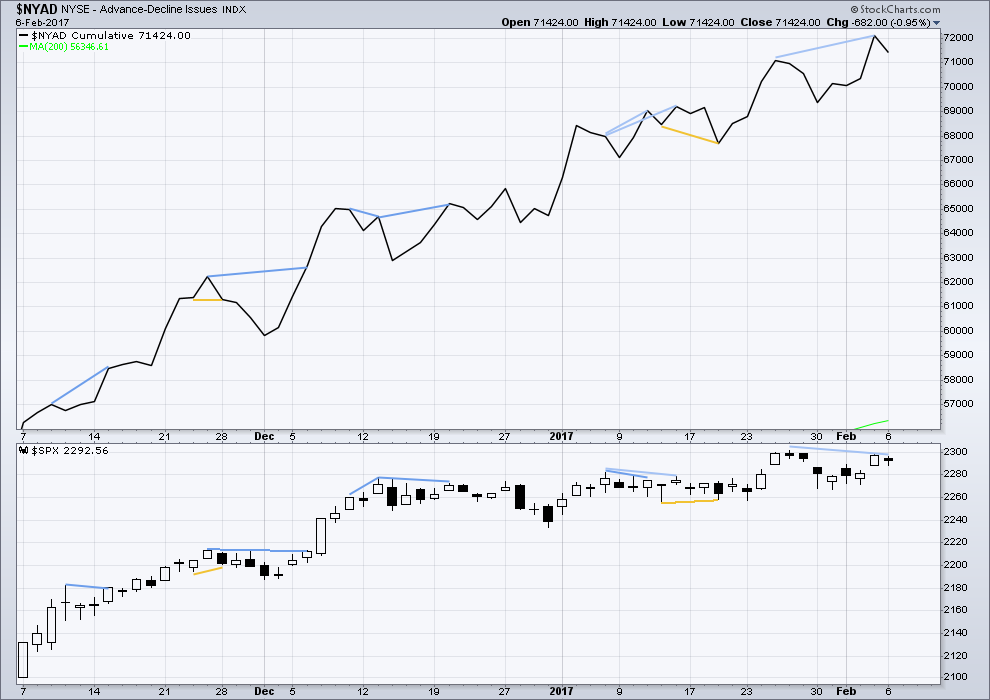
Click chart to enlarge. Chart courtesy of StockCharts.com.
Some bearish divergence noted in last analysis between price and the AD line has now been followed by one red daily candlestick. It may be resolved here or it may yet be followed by one more red daily candlestick.
DOW THEORY
The DJIA, DJT, S&P500 and Nasdaq have made new all time highs in December of 2016. This confirms a bull market continues.
This analysis is published @ 09:27 p.m. EST.
Good morning all.
The rejection of SPX 2300 this morning and the closing of the opening gap up is concerning. The more we mess around with SPX 2300 and DJIA 20,000 without decisively breaking through, the more I question if the breakout will materialize. The whole pattern from mid- Dec of last year is beginning to look like an upward pointing wedge. The daily and hourly MACD are pointing downwards. The 4-hour MACD looks like it wants to roll over as well. The market is not looking strong to me especially if we are in a third wave. Just some of my observations.
Have a great day.
Agreed Rodney, most of this wave has been a product of manipulation and a by-product of passive/index/etf investing, which has skewed the interpretation of market breadth. The jig will be up soon. Also, Gartman just covered his short, so likely a low risk short entry here for us 🙂
Good observation Rodney. Agree with your sentiment. Prudent to have stops or hedges in place. Very complacent environment as well.
Your comment made me think, and it was right after I’d drawn a new resistance line on my main daily chart.
A rising wedge = an Elliott wave contracting diagonal. It may be an ending diagonal.
So that primary 3 is not the shortest wave primary 1 and 2 need to be over quickly. The proportions of intermediate wave (2) to primary 2 now look wrong, but apart from that this idea meets all EW rules. It’s valid.
A small overshoot of the (1)-(3) trend line and it would be all over.