
Upwards movement was expected for the main Elliott wave count and this is what happened.
The alternate Elliott wave count is just hanging on by a couple of points.
Summary: It is increasingly likely that the next wave up has begun. This would be confirmed with a new all time high. The target is 2,338 for the short term and 2,382 for a longer term trade. If price breaks below 2,257.02, then a deeper pullback would be expected to be underway to end at the purple trend line.
New updates to this analysis are in bold.
Last monthly and weekly charts are here. Last historic analysis video is here.
MAIN ELLIOTT WAVE COUNT
WEEKLY CHART
Click chart to enlarge.
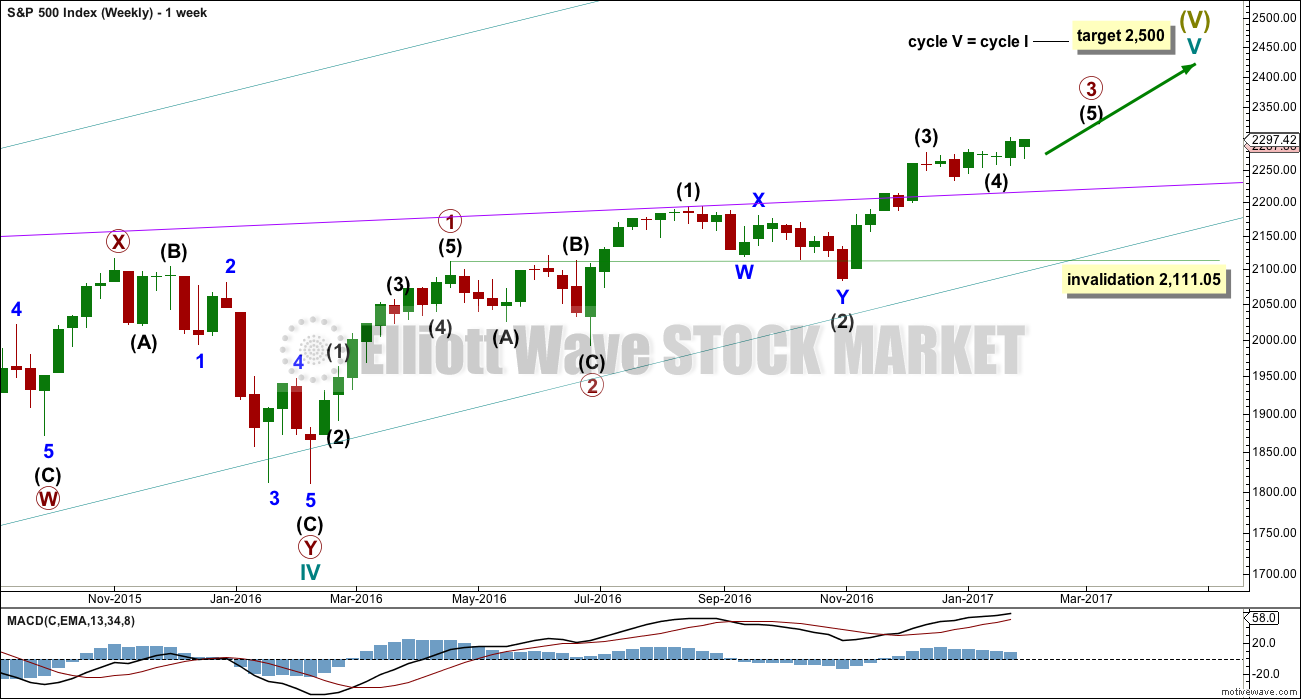
Cycle wave V is an incomplete structure. Within cycle wave V, primary wave 3 may be relatively close to completion.
When primary wave 3 is complete, then the following correction for primary wave 4 may not move into primary wave 1 price territory below 2,111.05.
Primary wave 2 was a flat correction lasting 47 days (not a Fibonacci number). Primary wave 4 may be expected to most likely be a zigzag, but it may also be a triangle if its structure exhibits alternation. If it is a zigzag, it may be more brief than primary wave 2, so a Fibonacci 21 sessions may be the initial expectation. If it is a triangle, then it may be a Fibonacci 34 or 55 sessions.
Primary wave 3 at this stage though is incomplete and may continue to move price higher.
DAILY CHART
Click chart to enlarge.
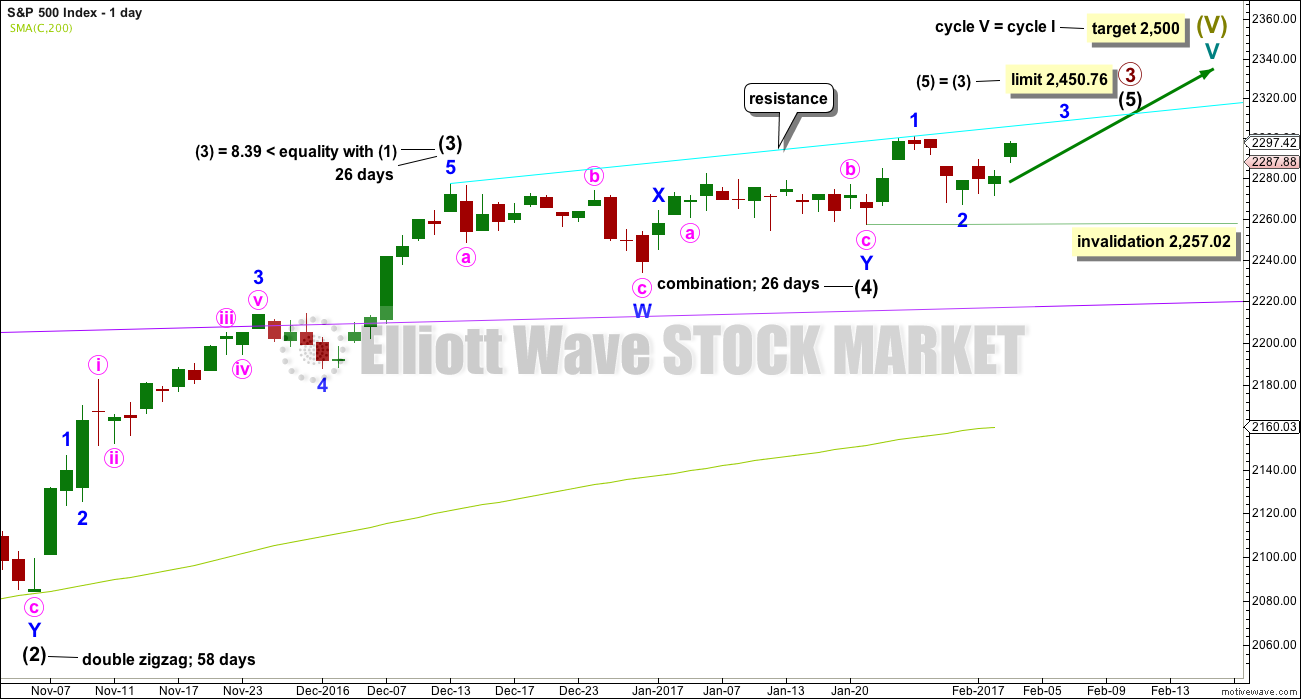
It is possible that intermediate wave (4) is a complete combination: zigzag – X – flat. It would have been even in duration with intermediate wave (3), both lasting 26 days.
Intermediate wave (3) is shorter than intermediate wave (1). One of the core Elliott wave rules states a third wave may never be the shortest wave, so this limits intermediate wave (5) to no longer than equality in length with intermediate wave (3) at 2,450.76.
Within intermediate wave (5), no second wave correction may move beyond its start below 2,257.02.
Intermediate wave (5) has so far lasted just nine days. It may be expected to be shorter both in length and duration compared to intermediate wave (3). At this stage, an expectation of a Fibonacci 21 days total for intermediate wave (5) looks reasonable, so it may now continue for another twelve days or sessions.
The proportion here between intermediate waves (2) and (4) is acceptable. There is alternation. Both are labelled W-X-Y, but double zigzags are quite different structures to double combinations.
HOURLY CHART
Click chart to enlarge.
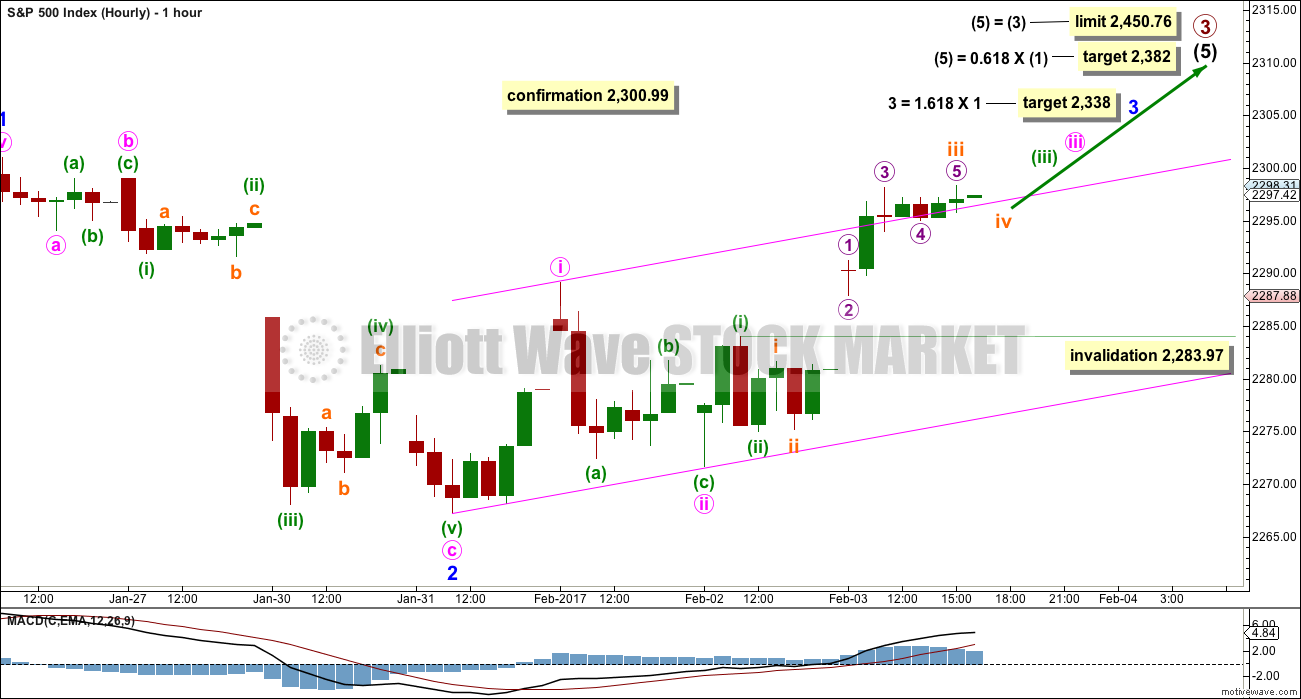
Intermediate wave (5) must subdivide as a five wave structure, either an impulse or an ending diagonal. At this stage, it is not possible to eliminate either option.
Within intermediate wave (5), minor waves 1 and 2 may be complete.
Within minor wave 3, minute waves i and ii may be complete. Minute wave iii may only subdivide as an impulse. If my labelling of it here is wrong, it may be in labelling the middle of it over already. This may have to be moved down one degree. Within the impulse up underway, no matter what degree it is labelled, the fourth wave may not move into first wave price territory below 2,283.97.
A base channel is drawn about minute waves i and ii. If minute wave ii is complete, then lower degree corrections along the way up should find support at the lower edge of the base channel. Price has at the end of Friday’s session just managed to break above the upper edge of the base channel and this now seems to be offering some support. It is fairly likely (not certain) that this trend line may continue to offer support.
A new high above 2,289.14 has added some confidence to this wave count. A new high above 2,300.99 would confirm it and invalidate any alternate. At that stage, reasonable confidence in targets may be had.
The target for minor wave 3 assumes the most likely Fibonacci ratio for it to minor wave 1. Minor wave 3 may last about a Fibonacci five days.
If price moves below 2,257.02, this main wave count would be invalidated and the alternate below would be confirmed.
ALTERNATE ELLIOTT WAVE COUNT
DAILY CHART
Click chart to enlarge.
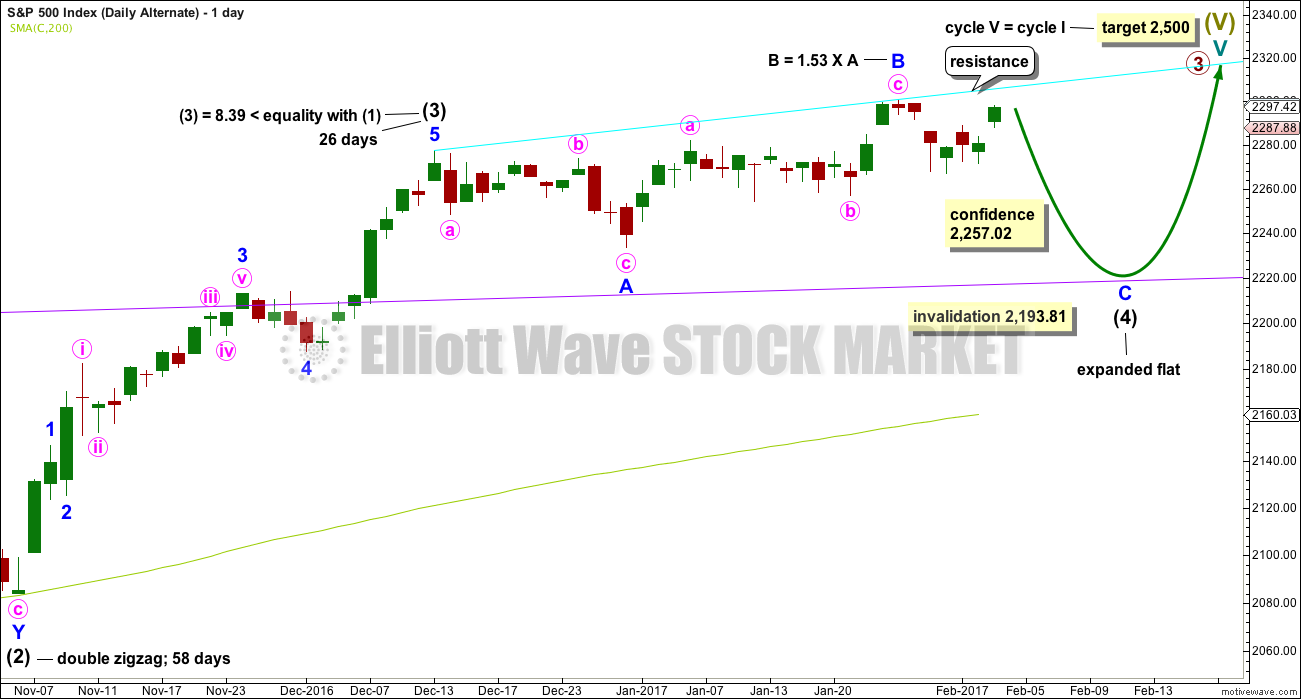
It remains possible that intermediate wave (4) is an incomplete expanded flat correction.
So far intermediate wave (4) may have lasted 35 sessions.
No target is given for minor wave C downwards because a target calculated using the Fibonacci ratio of 1.618 to minor wave A results in price falling short of the purple trend line. Minor wave C may end only when price comes down to touch the trend line again.
Minor wave B is now a 1.53 length to minor wave A. This is longer than the normal length of up to 1.38 but within the allowable convention of 2. The length of minor wave B has reduced the probability of this wave count.
Intermediate wave (4) may not move into intermediate wave (1) price territory below 2,193.81. It should find very strong support at the purple trend line and stop there.
HOURLY CHART
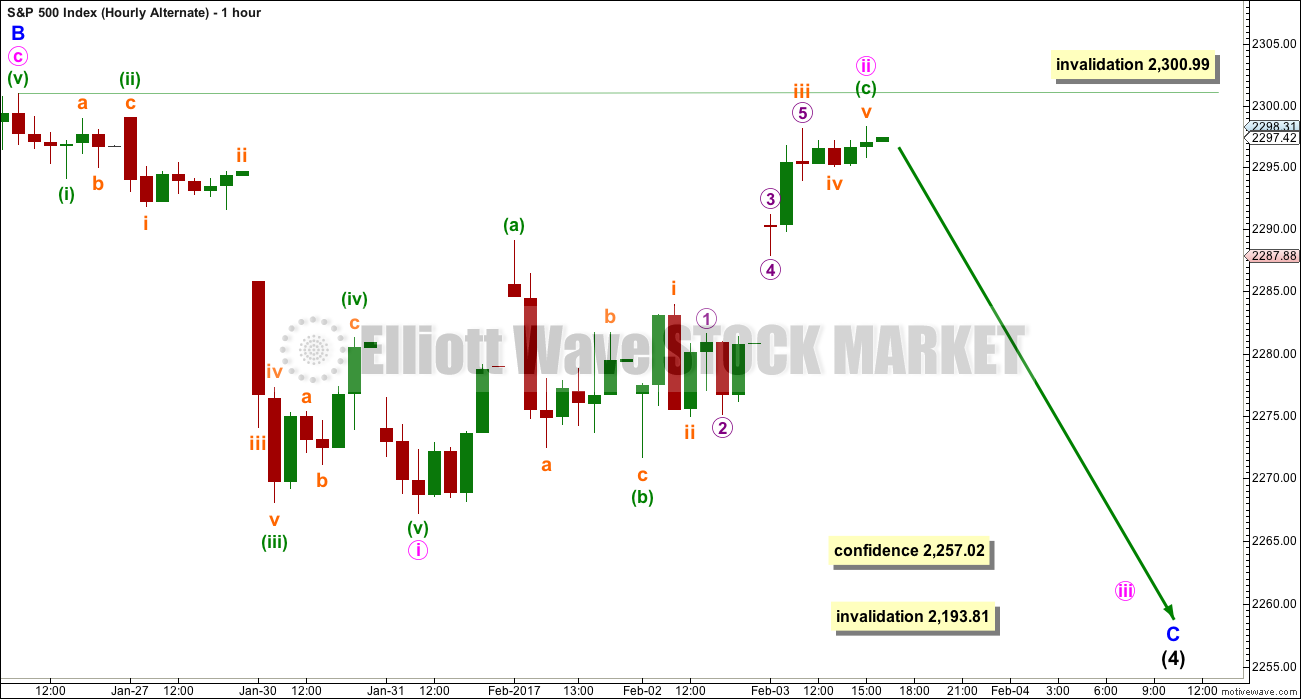
Click chart to enlarge.
Minor wave C must subdivide as a five wave structure. At this stage, it may be an impulse.
Labelling within downwards movement is adjusted. An impulse downwards may have been complete for minute wave i. Upwards movement to follow it may be a complete zigzag for minute wave ii.
If minute wave ii continues higher, it may not move beyond the start of minute wave i above 2,300.99.
The depth of this second wave correction is valid, but it is slightly unusual. This has reduced the probability of this alternate wave count a little at the end of this week.
TECHNICAL ANALYSIS
WEEKLY CHART
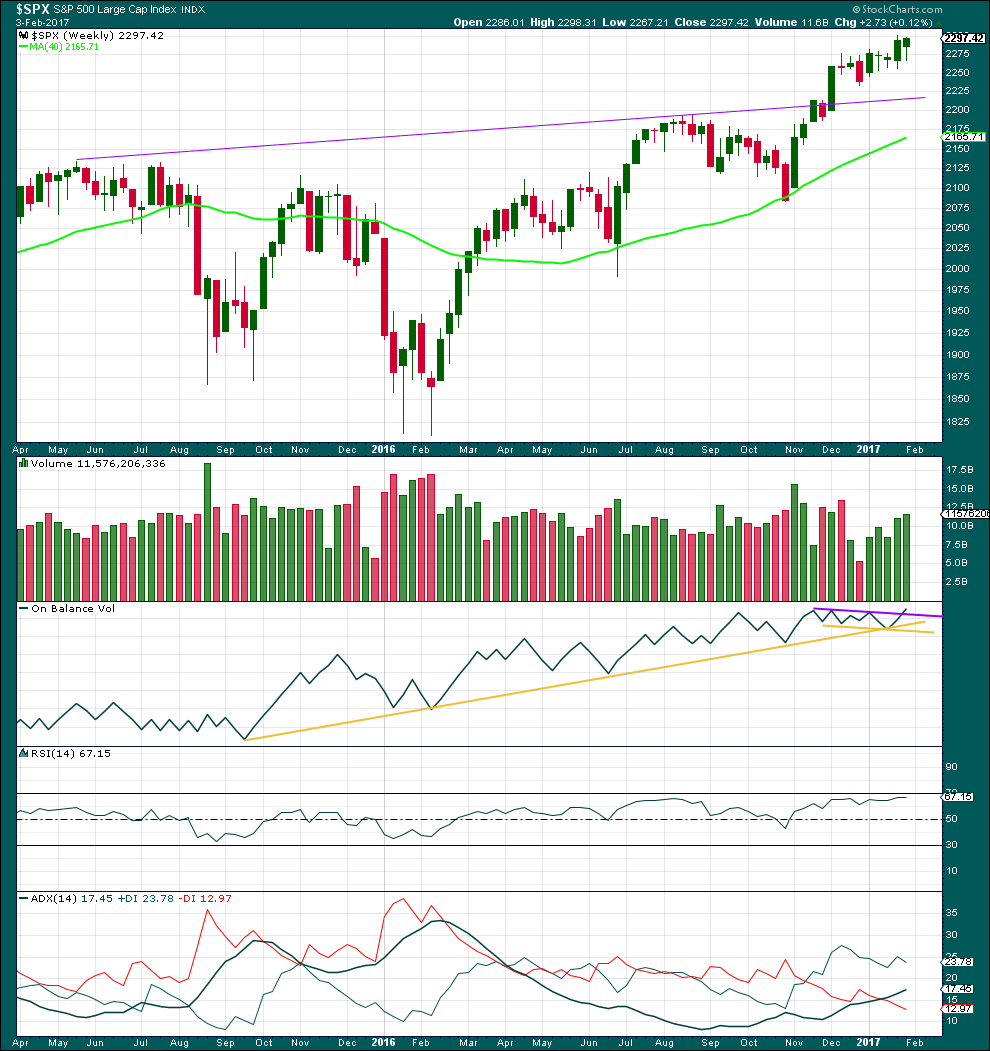
Click chart to enlarge. Chart courtesy of StockCharts.com.
Overall, for five weeks in a row now, price has moved overall higher and volume is still increasing. The longer term picture at this weekly chart level looks like this market is in a reasonably healthy bull trend.
The long lower wick on this weekly candlestick is bullish. This week saw a further increase in volume, also bullish.
On Balance Volume has given an important bullish signal here with a break above the purple line. This line has a shallow slope and has been tested three times prior. This is a reasonable bullish signal.
RSI is not overbought. There is room for price to rise. There is no short or mid term divergence with price and RSI to indicate weakness.
ADX is above 15 and rising indicating a trend. The +DX line is above the -DX line; the trend is up. It is not yet anywhere near extreme. There is plenty of room for this trend to continue.
Overall, the picture on this weekly chart is very bullish. That does not mean the alternate Elliott wave count cannot be correct; it only means the probability of the alternate is lower than the main wave count.
DAILY CHART
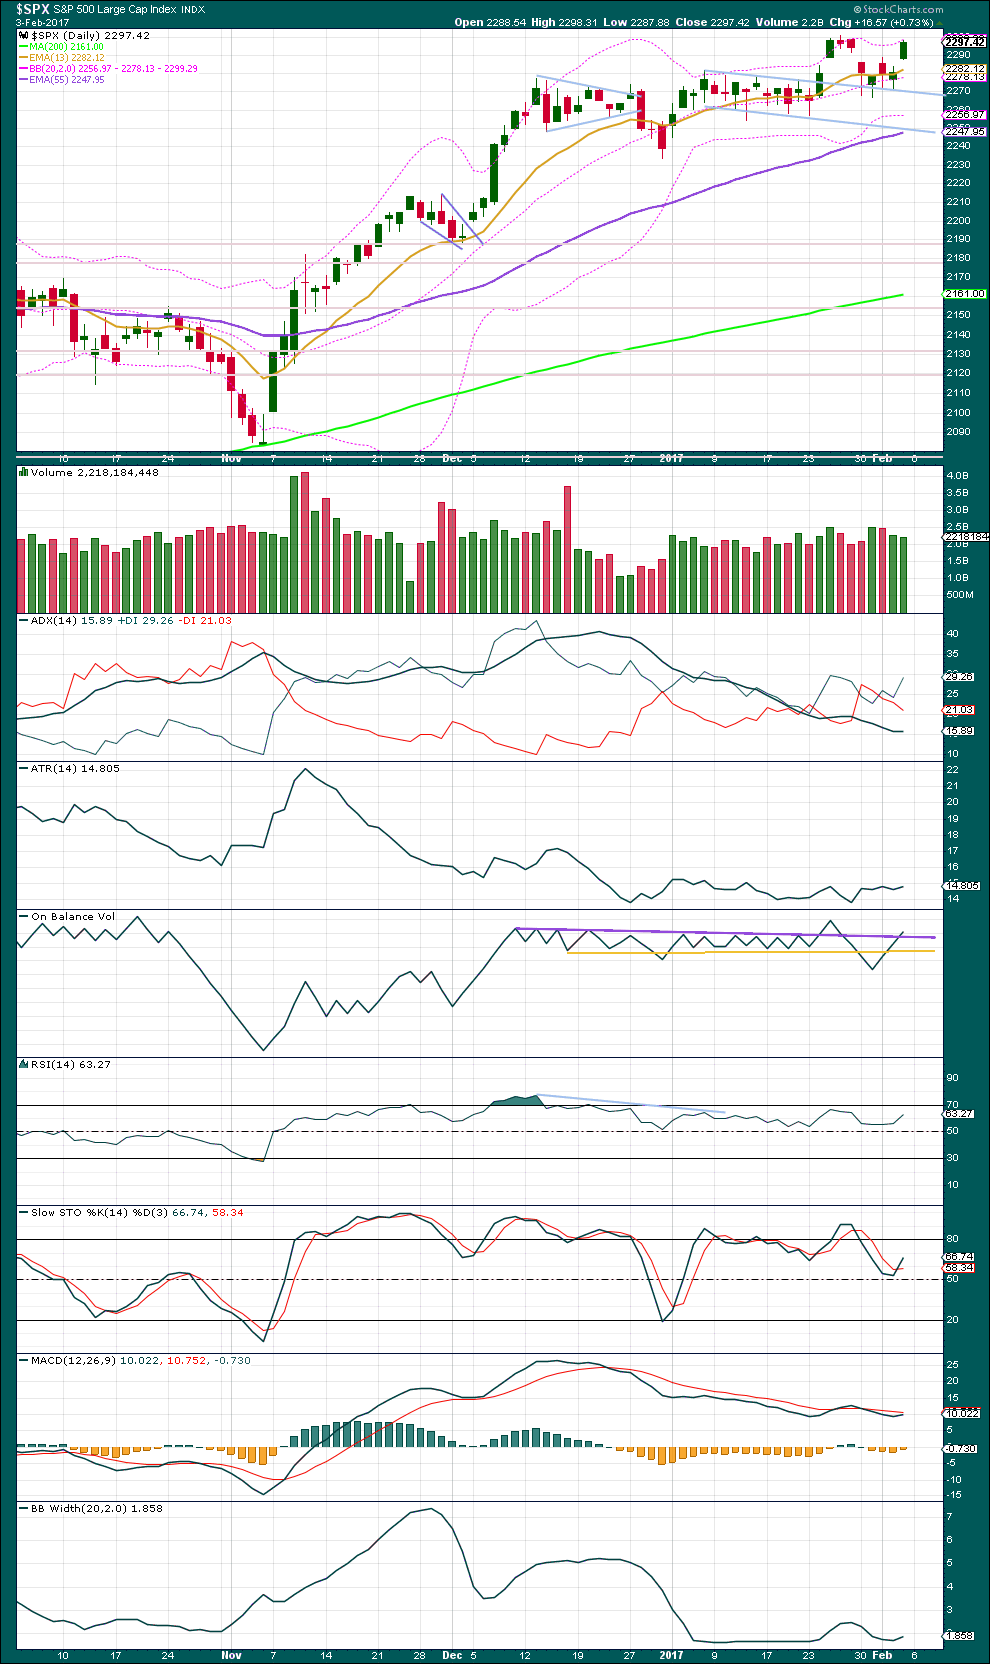
Click chart to enlarge. Chart courtesy of StockCharts.com.
An upwards day for Friday shows lighter volume than the prior day. The rise in price for Friday did not have support from volume. This gives some small cause for concern over the main Elliott wave count. However, sometimes trends can start off slowly. Notice the first three upwards days off the low on the 4th of November also came with declining volume, yet that was the start of a strong bull run.
This small piece of information will be balanced with other information.
ADX is today showing a slight increase and it is just above 15. This may be the early stages of the next upwards trend. The black ADX line is below both directional lines, so there is plenty of room for a trend to develop and continue for some time.
ATR this week remains overall flat. This is common during a consolidation and also at the start of trends.
On Balance Volume gives a bullish signal with a break above the purple resistance line. This line has been broken before only for OBV to return, so this signal is weak.
RSI is not extreme and for recent movement short term shows no divergence with price at highs. There is room for more upwards movement.
MACD is bearish, but it may be ready to give another crossover. That has not happened yet though.
Bollinger Bands showed a slight expansion on Friday, so some volatility may be about to return to this market. Price is at the upper edge of Bollinger Bands, but recently it has been able to stay there for several days while price trends. This alone does not mean a pullback has to happen here.
Overall, this daily analysis is also bullish in support of the main Elliott wave count.
VOLATILITY – INVERTED VIX CHART
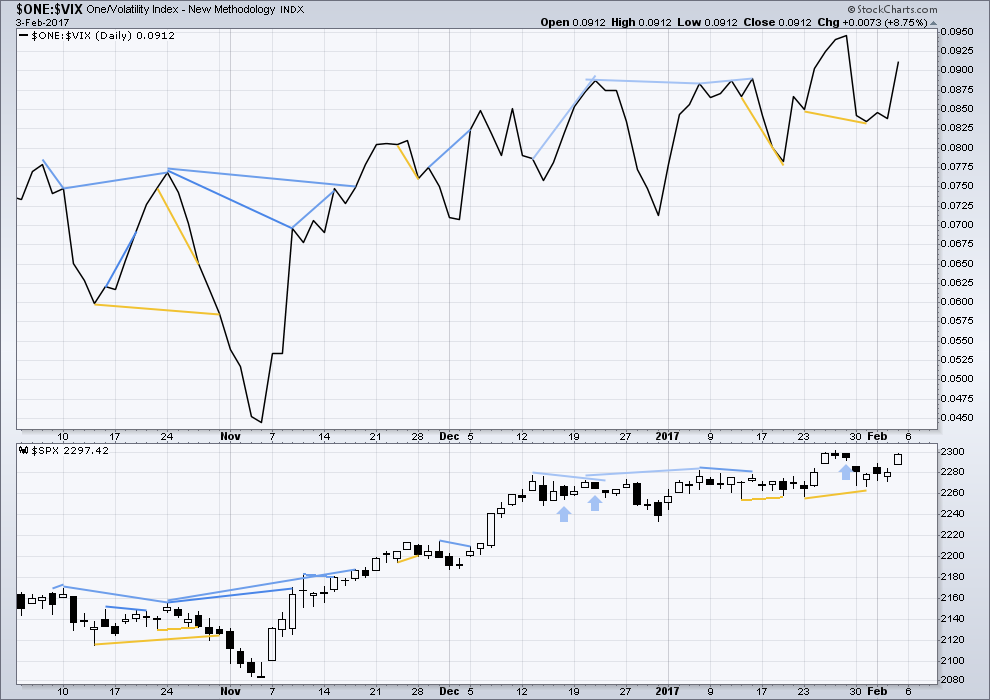
Click chart to enlarge. Chart courtesy of StockCharts.com.
There are a few instances of multi day divergence between price and inverted VIX noted here. Bearish divergence is blue. Bullish divergence is yellow. It appears so far that divergence between inverted VIX and price is mostly working to indicate short term movements spanning one or two days. While this seems to be working more often than not, it is not always working. As with everything in technical analysis, there is nothing that is certain. This is an exercise in probability.
No new divergence is noted between price and inverted VIX today.
BREADTH – AD LINE
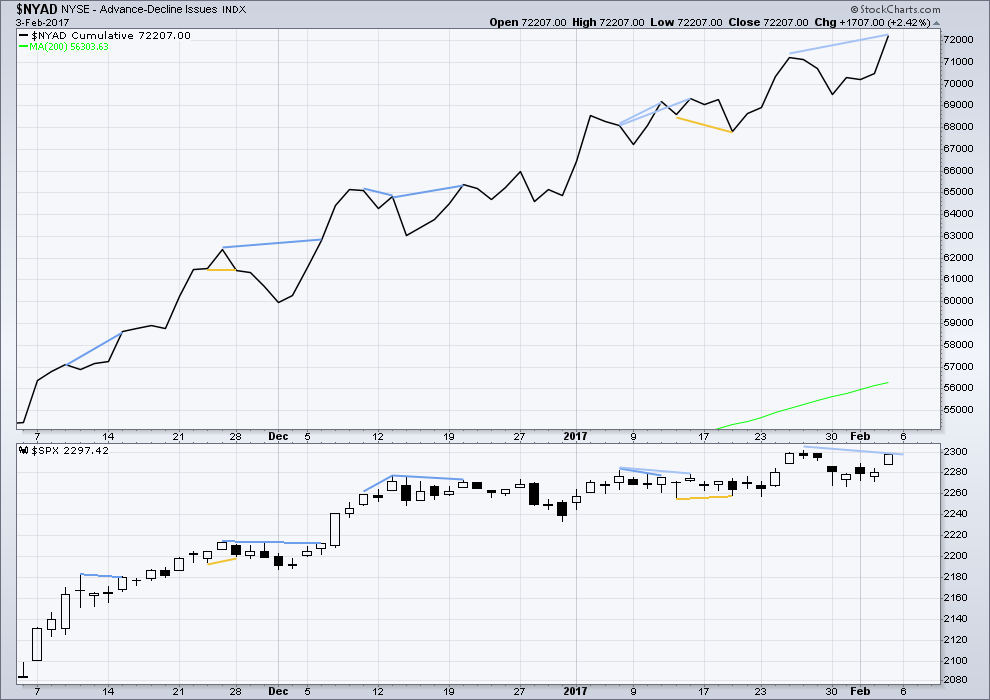
Click chart to enlarge. Chart courtesy of StockCharts.com.
Some bearish divergence is noted between price and the AD line. Price has not made a new high, but on Friday the AD line did make a new high. This is hidden bearish divergence. This does not always work (it didn’t on the 15th of November or the 6th of December, 2016) but it sometimes works. This supports the alternate Elliott wave count.
DOW THEORY
The DJIA, DJT, S&P500 and Nasdaq have made new all time highs in December of 2016. This confirms a bull market continues.
This analysis is published @ 09:05 p.m. EST.
Rumors abound that Soros is massively shorting the US equity markets in an attempt to embarrass President Trump. I seriously doubt it. He is not that stupid. Central banksters consider him a marked man and have never forgiven or forgotten what he did to the bank of England in 1992. It was not widely reported but Soros got his A _ _ handed to him on election night last year when central bankers joined to buy US markets out of deep in the red after a massive bear raid by Soros and a few others of his cohorts. He lost tens of millions in that futures show down. It is not as if he has not been trying all along to drive down US equities. Evidence of this tug of war has been evident in the markets for months now. I suspect with the resolve of central banksters and their determination to watch each other’s backs, the next epic market event will be ushered in by some exogenous shock that not even they can anticipate or overcome. Till then, I suspect it will be smooth sailin’….
https://www.youtube.com/watch?v=7khQNR7s1Ho
I love that song 🙂 cheers Verne!
Oh! Memories of crystal clear blue Island waters! 🙂
This is what I have so far this morning. I may move this correction up one more degree, but that would see the middle of minor 3 over too quickly.
This could be a fourth wave counter to minute ii, and the whole thing could be moved down to minute degree, to see only minute i coming to an end after the next five up.
Either way, this downwards movement looks like a fourth wave, and it should be followed by a fifth wave up which should make a new high and give us final price confirmation of this wave count.
This morning’s downward chop looks like the wave iv of (iii) on the main count.
Let’s see if it ends at 2289 (C=A) or 2285 ( C=1.618 x A)
or maybe even a short C at 2292 (C=0.618 x A)
Just thinking out loud – I’m still a greenhorn.
I’m going to move it up one degree… it could even be moved up to minute wave iv, two degrees higher.
I’m doing that because of the size of it. The “right look” is due to proportion between corrections of the same degree; between a second and fourth wave.
The closer to even in duration the second and fourth wave are, the more text book perfect the wave looks. If one of them, second or fourth waves, is much longer in duration than the other, then it gives what should be a five a three wave look. The wrong look.
Hi Lara,
In your main daily chart is it possible for blue Y within Intermediate 4 to finish higher than blue W?
Yes.
It’s a double combination; zigzag – X – flat.
The second structure moves the correction sideways. Y normally ends about the same level as W. In this instance it is higher by 18.4 points, but overall the movement is still sideways. It meets all rules and also meets the guideline of an overall sideways movement.
70 point DJIA gap down to positive in the first hour, that makes sense…..