
Upwards movement was expected for the second hourly Elliott wave count.
Summary: Another small pennant pattern may be over, the target would be about 2,350 (measured rule) or 2,473 (Elliott wave). However, indicators are sounding strong notes of caution here: ADX is unusually extreme, volume today is light, and there is divergence with inverted VIX and the AD line. If members use this opportunity to join the upwards trend, it is advised that risk should be managed by reducing position size to about 1-2% of equity, and it is essential that stops are used.
Last monthly chart is here.
Last weekly chart is here.
New updates to this analysis are in bold.
DAILY CHART
Click chart to enlarge.
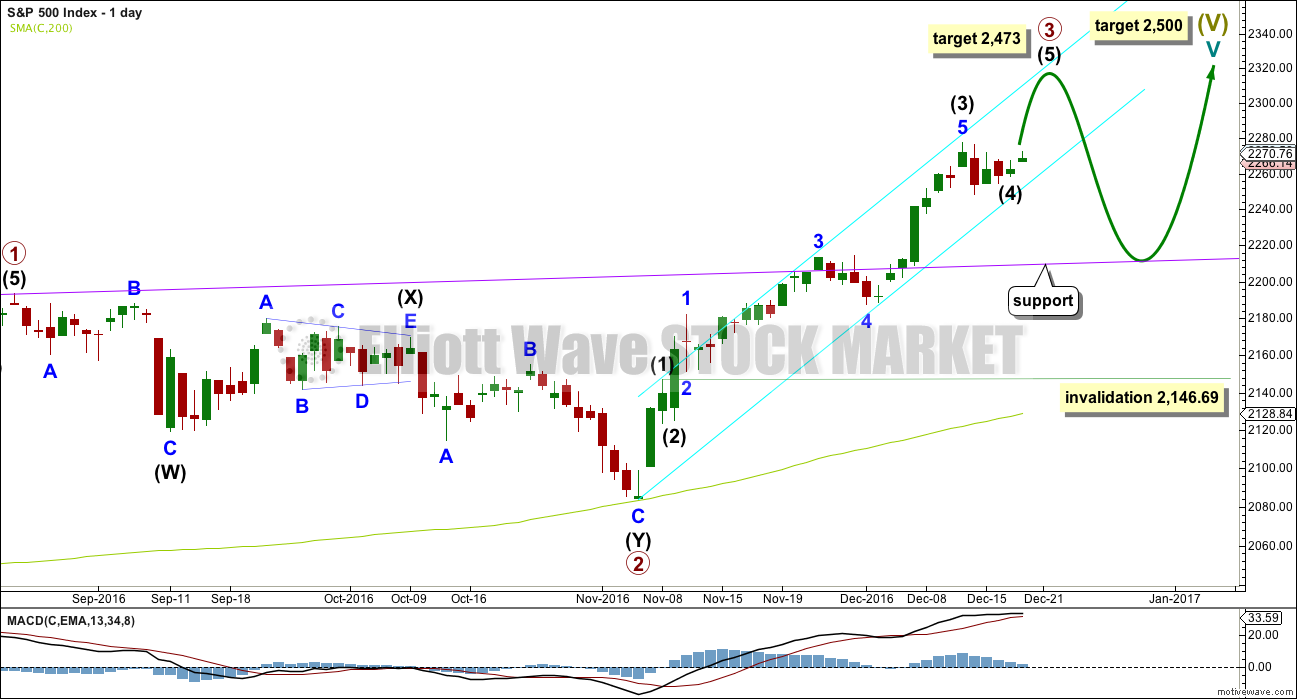
Cycle wave V must subdivide as a five wave structure. At 2,500 it would reach equality in length with cycle wave I. This is the most common Fibonacci ratio for a fifth wave for this market, so this target should have a reasonable probability.
Cycle wave V within Super Cycle wave (V) should exhibit internal weakness. At its end, it should exhibit strong multiple divergence at highs.
Within cycle wave V, primary waves 1 and 2 are complete. Primary wave 3 may be over halfway through and is now exhibiting stronger momentum than primary wave 1. It is possible primary wave 3 may fall short of the target and not reach equality in length with primary wave 1.
Within primary wave 3, the correction for intermediate wave (4) looks like it is relatively brief and shallow. Intermediate wave (2) was over very quickly within one day. Intermediate wave (4) may last a little longer and may not move into intermediate wave (1) price territory below 2,146.69. When any and all alternates that allow for intermediate wave (4) to continue have been invalidated, then the invalidation point may be moved up to the start of intermediate wave (5).
At 2,473 primary wave 3 would reach equality in length with primary wave 1. This Fibonacci ratio is chosen for this target calculation because it fits with the higher target at 2,500.
There is already a Fibonacci ratio within primary wave 3. Intermediate wave (3) is 12.49 points short of 2.618 the length of intermediate wave (1). This is a reasonable difference, but as it is less than 10% the length of intermediate wave (3) I will consider it close enough to say there is a Fibonacci ratio here. This means that intermediate wave (5) should not be expected to exhibit a Fibonacci ratio to either of intermediate waves (1) or (3), as the S&P often exhibits Fibonacci ratios between two of its three actionary waves and rarely between all three.
When primary wave 3 is complete, then the following correction for primary wave 4 may last about one to three months and should be a very shallow correction remaining above primary wave 1 price territory. Although primary wave 3 has now moved above the end of primary wave 1, it looks like primary wave 3 needs to move higher to allow enough room for primary wave 4 to unfold.
HOURLY CHART
Click chart to enlarge.
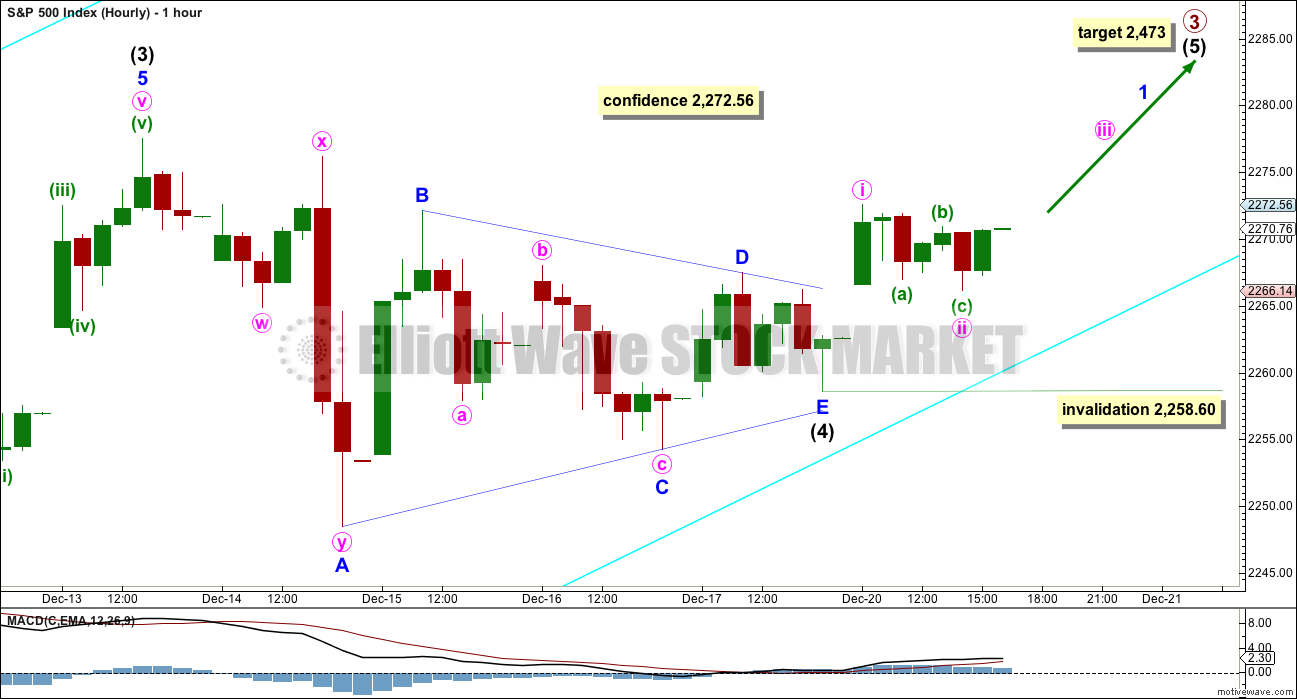
It is possible now that the triangle for intermediate wave (4) is complete as a regular contracting triangle. Upwards movement for Tuesday’s session may have been the start of intermediate wave (5).
A new high above 2,272.56 would add some confidence now to this wave count. At that stage, the alternate below would be invalidated.
Within intermediate wave (5), no second wave correction may move beyond the start of its first wave below 2,258.60.
ALTERNATE HOURLY CHART
Click chart to enlarge.
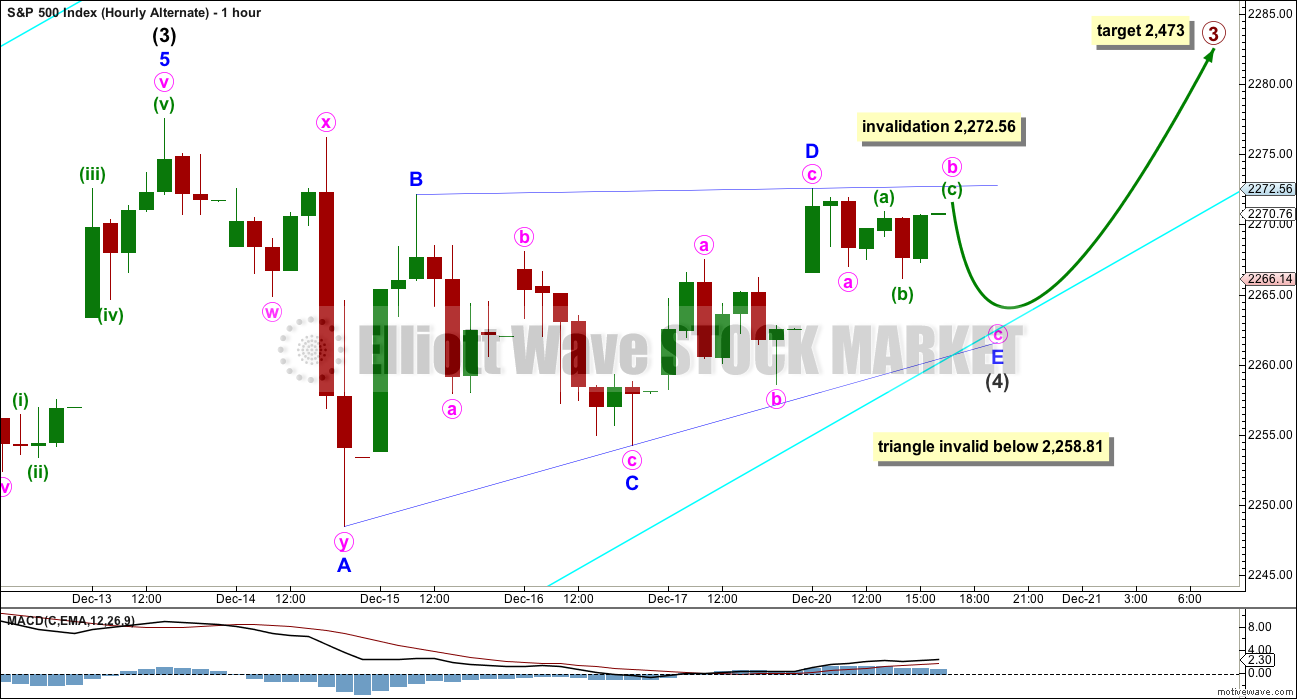
It is possible that the triangle is an incomplete barrier triangle.
Within a barrier triangle, wave D may in practice end very slightly beyond the end of wave B; as long as the B-D trend line remains essentially flat, then the rule is met. This wave count at this stage remains valid.
This is the only Elliott wave rule which is not black and white.
Within the zigzag for minor wave E, the correction of minute wave b may not move beyond the start of minute wave a above 2,272.56.
A note about other possible alternate structures for intermediate wave (4):
Intermediate wave (4) may not be unfolding as a combination. The first three down is a multiple, the double zigzag labelled minor wave A. Because the maximum number of corrections within a multiple is three this downwards wave may not be relabelled minor wave W, the first structure of a multiple. Labelling multiples within multiples increases the maximum beyond three violating the rule.
I will at this stage discard the possibility of a flat correction continuing for intermediate wave (4). Upwards movement now has an overlap between the high labelled here minute wave a within minor wave D and the low for today labelled minuette wave (b) within minute wave b within minor wave E. This overlap cannot be a fourth wave within an impulse completing higher, and this movement does not fit the rules regarding wave lengths for an ending diagonal. At this stage, I cannot see how a flat correction will fit and be incomplete.
By a process of elimination the conclusion is that a triangle is either complete or very close to complete, if this analysis is correct and has considered all possibilities.
TECHNICAL ANALYSIS
WEEKLY CHART
Click chart to enlarge. Chart courtesy of StockCharts.com.
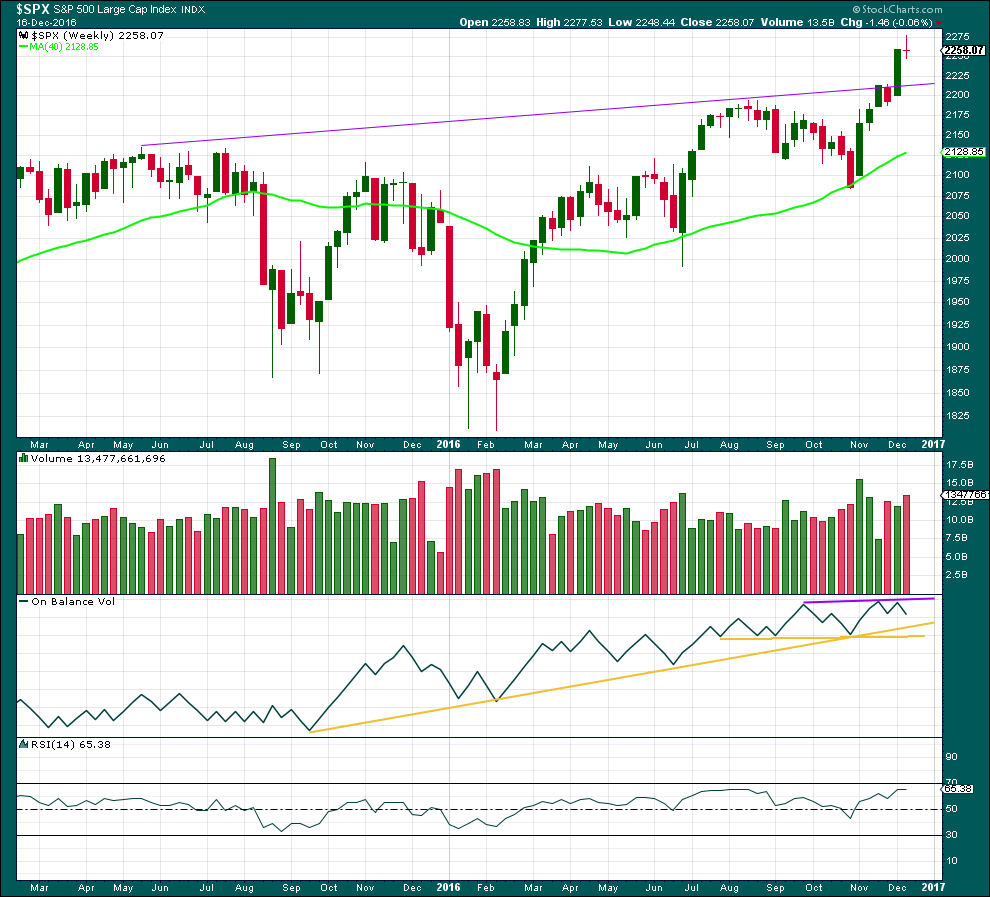
Last week completes a small red doji candlestick. This indicates a pause in the trend, and a change from up to neutral.
Last week closes red and comes with an increase of volume, the balance of which was downwards. There was some support for a fall in price at the end of the week. This in conjunction with the doji is slightly bearish, or at least indicating a consolidation here.
On Balance Volume has found resistance again at the purple trend line. It may find support at the first yellow line, which is very long held and offers good technical significance. This may assist to halt a fall in price forcing a consolidation to be shallow.
RSI is still not extreme. There is room for price to continue higher.
The purple trend line on price may also provide support.
DAILY CHART
Click chart to enlarge. Chart courtesy of StockCharts.com.
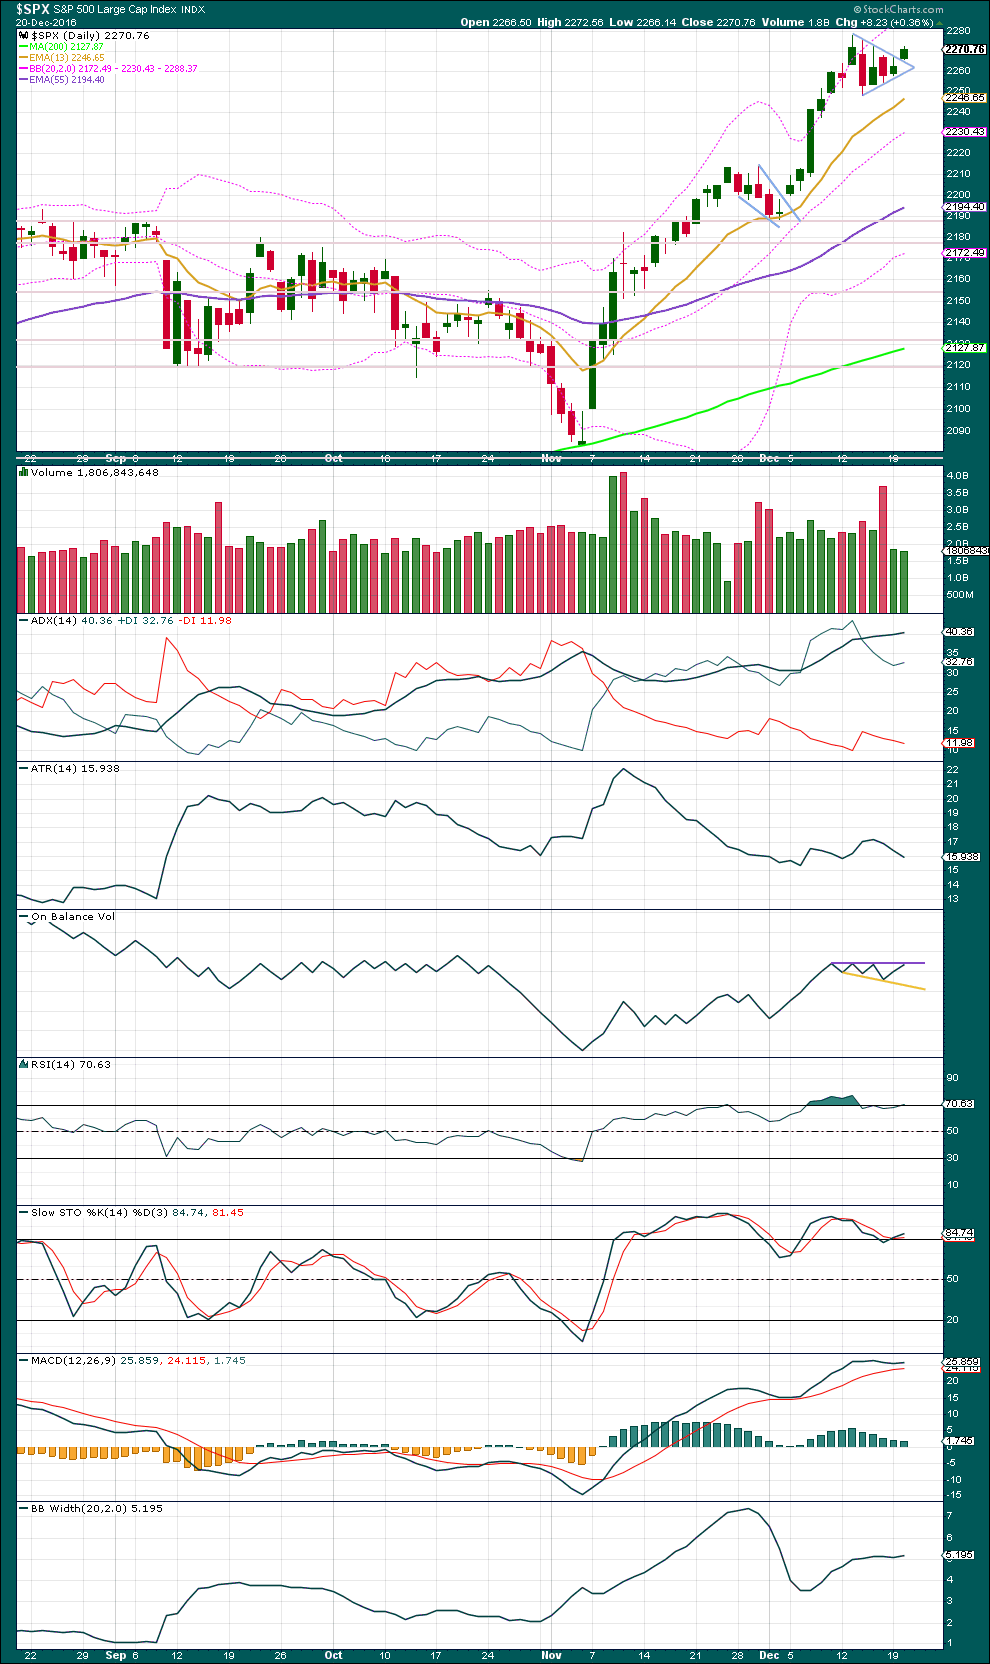
Another small pennant pattern may be now complete, and it looks like the opening gap for this session is another breakaway gap out of the pattern. Just like last time this gap should now provide support, if this analysis is correct.
However, a note of caution is sounded by the slight decline in volume for this session. For confidence in a breakout, particularly an upwards breakout, it should come with an increase in volume.
ADX is comfortably extreme above 35. This trend is extreme; an end should come soon. The small pennant pattern was unable to bring ADX down.
I have spent some time today going back over the bull market on the daily chart to March 2009. During this time ADX has reached above 35 nine times;
– In May 2010 during a downwards wave.
– In January 2011 (just above 35). This was followed by a drop of 1.9% over two days.
– In August 2011 during a downwards wave.
– In February 2012: on 8th February ADX reached above 35 then slightly above 40 on 21st February, but price did not find a high until the 29th of February. Price then dropped 2.8% over four days.
– In June 2012 at the end of a downwards wave.
– In August 2012. This was followed by a drop of 3.9% over two days.
– In February 2013: on the 5th of February ADX reached above 35 and continued higher with price to find a high on 19th February when ADX reached almost to 39. Price then dropped 3% over five days.
– In May 2013: on the 22nd of May ADX was almost 40. Price then dropped 7.5% over 23 days.
– In January 2016 during a downwards wave.
Conclusion: A reading of over 35 for ADX is extreme, and a reading over 40 is unusually extreme. However, this is not necessarily useful in pinpointing a trend change nor does it provide useful information on how far price may drop. In other words, it cannot tell us when price will turn nor how far it may fall.
ADX is sounding a strong note of caution here.
ATR is declining as price has consolidated for the last four sessions. Bollinger Bands are steady.
Stochastics and RSI are still overbought, but these may remain extreme for reasonable periods of time during a trending market.
On Balance Volume should be watched closely tomorrow. It has come up to find resistance at the purple trend line. If OBV breaks above this line tomorrow, then some confidence in an upwards breakout may be had.
The target for the next move upwards using the measured rule would be about 2,350.
VOLATILITY – INVERTED VIX CHART
Click chart to enlarge. Chart courtesy of StockCharts.com.
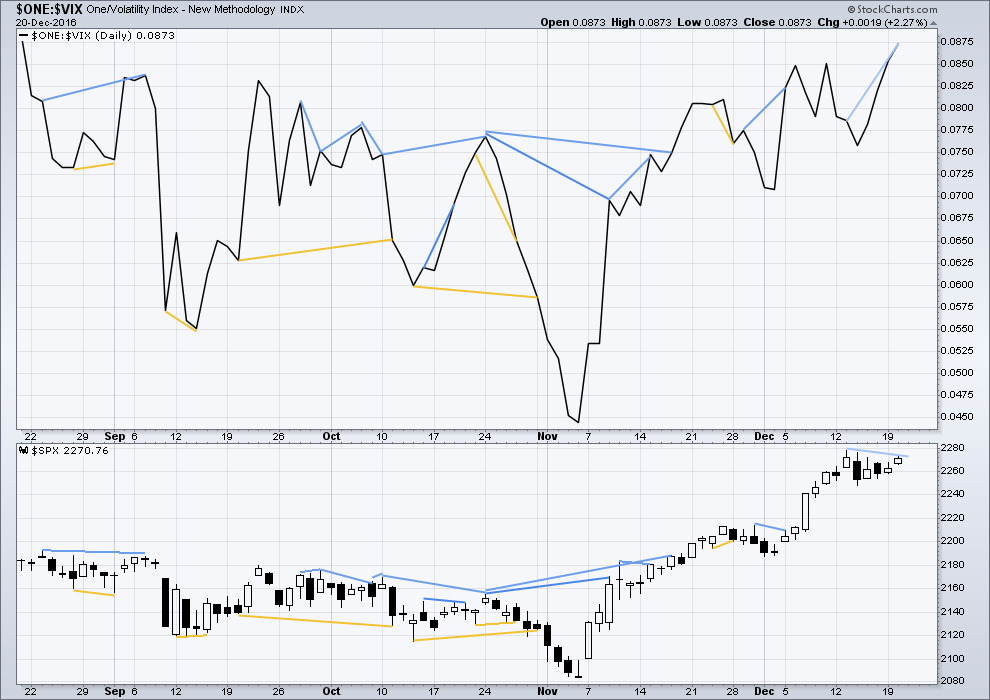
There are a few instances of multi day divergence between price and inverted VIX noted here. Bearish divergence is blue. Bullish divergence is yellow. It appears so far that divergence between inverted VIX and price is mostly working to indicate short term movements spanning one or two days. While this seems to be working more often than not, it is not always working. As with everything in technical analysis, there is nothing that is certain. This is an exercise in probability.
Short term bearish divergence is noted today between price and inverted VIX: inverted VIX has made a higher high, but price has made a lower high. This indicates weakness in price and may be followed by one or two days of downwards movement. This would favour the alternate hourly Elliott wave count.
BREADTH – AD LINE
Click chart to enlarge. Chart courtesy of StockCharts.com.
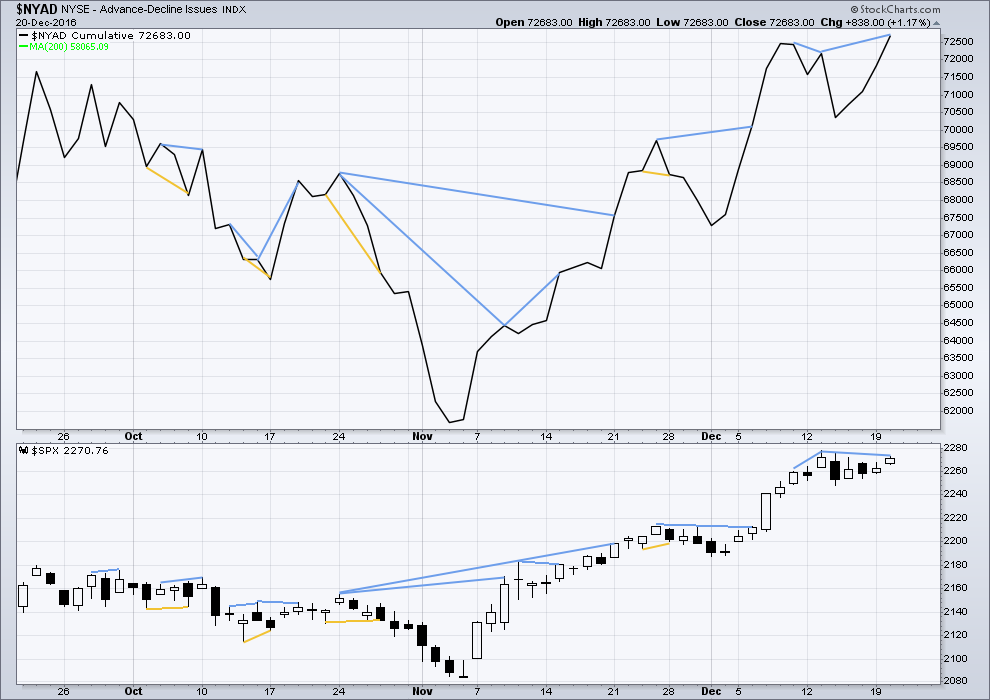
Short term bullish and bearish divergence is again working between price and the AD line to show the direction for the following one or two days.
There is longer term divergence between price and the AD line, but like inverted VIX this has proven reasonably recently to be unreliable. It will be given no weight here.
There is hidden bearish divergence today between price and the AD line, between the high for today and the prior high of the 13th of December. The AD line today made a higher high, but price has made a lower high. This may be followed by one or two days of downwards movement, and this favours the alternate hourly Elliott wave count.
DOW THEORY
Major lows within the old bull market:
DJIA: 15,855.12 (15th October, 2014) – closed below on 25th August, 2015.
DJT: 7,700.49 (12th October, 2014) – closed below on 24th August, 2015.
S&P500: 1,821.61 (15th October, 2014) – has not closed below this point yet.
Nasdaq: 4,117.84 (15th October, 2014) – has not closed below this point yet.
Major highs within the bear market from November 2014:
DJIA: 17,977.85 (4th November, 2015) – closed above on 18th April, 2016.
DJT: 8,358.20 (20th November, 2015) – closed above this point on the 9th of November, 2016.
S&P500: 2,116.48 (3rd November, 2015) – closed above this point on 8th June, 2016.
Nasdaq: 5,176.77 (2nd December, 2015) – closed above this point on 1st August, 2016.
Dow Theory Conclusion: The transportations indicate an end to the prior bear market. The transportation index confirms a bull market.
This analysis is published @ 11:22 p.m. EST.
New 52 week low today in VIX.
Optimistic sentiment is as extreme as I have ever seen it. While the upcoming move down will probably be brief, I suspect it will be deeper than most folk are expecting. Remarkable divergence with VIX and market price persists.
I noticed that too Verne and I wondered if you would comment on it.
I just don’t know quite what to make of this very abnormal behaviour from VIX. Price moved lower today, but inverted VIX climbed; price moved lower but volatility declined.
I think I should be interpreting this as bullish; the fall in price was not accompanied by a corresponding increase in volatility, volatility has declined. The fall in price is not… normal.
Anyway, we’ve seen this happen before most recently, and so far it hasn’t resulted in a big drop / deeper correction. Price just keeps rising.
I too am inclined to interpret it as bullish considering price action and the state of the moving averages. I really have no idea what to make of the strange VIX situation as it is something I have not seen in the past so trying to reasonably interpret what it means is not remotely a possibility. It really is a puzzle and we could be about to learn something new.
When triangles are complete price tends to move out of them fairly quickly. The first wave out of a triangle is usually swift and has some strength.
That has not happened today. So the alternate hourly chart is favoured, this might be my only hourly chart today, we shall see how the session ends.
This means that intermediate (4) is looking like a barrier triangle.
This gives us some more important information. Fifth waves following barrier triangles are either very short and brief, or very long extensions.
With a triangle unfolding we can also eliminate a longer combination continuing. Triangles may be X waves or the last structure in a multiple, but not the first.
At the daily chart level it doesn’t look like primary 3 has moved far enough above primary 1 yet to allow primary 4 room to move and remain above primary 1 price territory. So that look would favour a long extended fifth wave to come.
But classic TA sees ADX extreme and above both red and green (at the daily chart level). RSI is not extreme but is close and Stochastics is overbought.
Now both RSI and especially Stochastics may remain extreme for reasonable periods of time during a trending market, particularly during a bullish market. So on it’s own those two extremes will not tell us when a correction will come. RSI exhibits no divergence at this stage to warn of weakness. Stochastics has a little, but this can continue to develop into multiple divergence before a turn so I’d rather use RSI for that.
While the larger trend is up and shows signs of health and strength (see Chris Ciovacco’s video, and here I’m also referring to Lowry’s measures of internal strength and breadth) I am still a little concerned that price may need to correct here either longer or deeper before it is ready to continue up.
How extreme can ADX get at the daily chart level before a deeper correction?
Lara,
Below video talks about ADX, but thinks a bull market just starting. How do you think about his analysis?
https://www.youtube.com/watch?v=ppLoAxyj6vY&feature=youtu.be&t=1
I rate Chris Ciovacco’s analysis very highly. It is clear, accurate and solid technical analysis. His videos are the only videos I have ever watched all the way through (I don’t like video, I’d rather read text and see charts) and I learn something new each time.
Well… that’s very bullish isn’t it.
He does look at weekly and monthly charts though, it’s a long term view for investors. It’s not necessarily going to help us with timing our entry, nor for short term day traders.
So Rodney, have some confidence that this market is still looking strong. Chris Ciovacco is fairly bullish, Lowry’s keep telling me each week this trend looks strong and healthy and the Elliott wave count still needs primary 3 to move higher.
In Chris Ciovacco’s words: “the probability of good things happening is high”.
And this does not mean that bad things cannot happen, only that it is less likely. Which is why risk management is always important.
Once again you give us excellent analysis and commentary. You comments on triangles and ADX is especially helpful today. Thanks.
I took a ‘chill pill’ and mustered my confidence to go long on this pennant breakout to the upside. I am looking for a 70 point move up in the SPX for my exit in early January.
Have a great day all.
Excellent.
I would recommend watching Chris Chiovacco’s video that David Gao has kindly linked to above.
Thanks. I already listened to it Saturday morning as I do most weeks. He is a good technical analyst.
Nice Lara, love the comments on ADX!