
A small inside day continues a small consolidation, which was what both the daily and two hourly Elliott wave counts expected.
The alternate hourly Elliott wave count will be discarded today.
Summary: It is possible that the consolidation is over today. If yes, the target remains at 2,473. But it is also possible that the consolidation may continue sideways in a larger range for a few more days before the upwards trend resumes.
Last monthly chart is here.
Last weekly chart is here.
New updates to this analysis are in bold.
DAILY CHART
Click chart to enlarge.
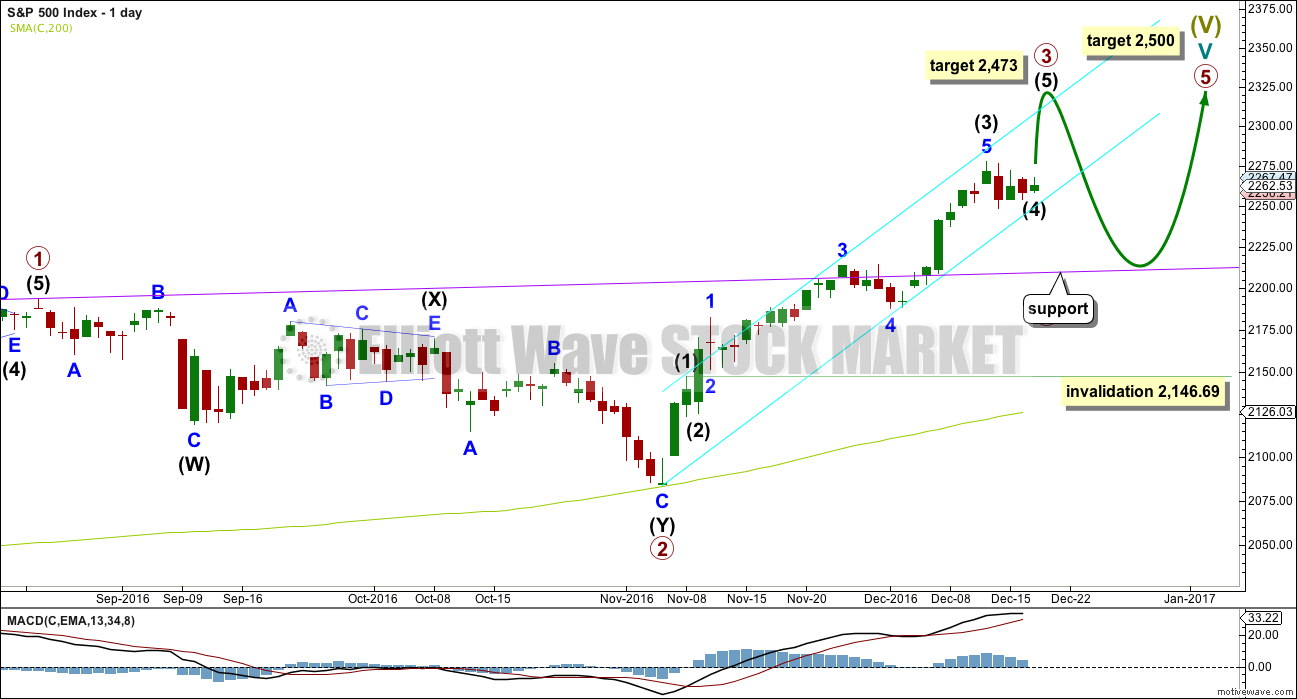
Cycle wave V must subdivide as a five wave structure. At 2,500 it would reach equality in length with cycle wave I. This is the most common Fibonacci ratio for a fifth wave for this market, so this target should have a reasonable probability.
Cycle wave V within Super Cycle wave (V) should exhibit internal weakness. At its end, it should exhibit strong multiple divergence at highs.
Within cycle wave V, primary waves 1 and 2 are complete. Primary wave 3 may be over halfway through and is now exhibiting stronger momentum than primary wave 1. It is possible primary wave 3 may fall short of the target and not reach equality in length with primary wave 1.
Within primary wave 3, the correction for intermediate wave (4) should be relatively brief and shallow. Intermediate wave (2) was over very quickly within one day. Intermediate wave (4) may last a little longer and may not move into intermediate wave (1) price territory below 2,146.69. If it is a triangle, then it may have ended today. If not, it may also continue for a few more days as a flat correction. Both possibilities are charted below.
At 2,473 primary wave 3 would reach equality in length with primary wave 1. This Fibonacci ratio is chosen for this target calculation because it fits with the higher target at 2,500.
There is already a Fibonacci ratio within primary wave 3. Intermediate wave (3) is 12.49 points short of 2.618 the length of intermediate wave (1). This is a reasonable difference, but as it is less than 10% the length of intermediate wave (3) I will consider it close enough to say there is a Fibonacci ratio here. This means that intermediate wave (5) should not be expected to exhibit a Fibonacci ratio to either of intermediate waves (1) or (3), as the S&P often exhibits Fibonacci ratios between two of its three actionary waves and rarely between all three.
When primary wave 3 is complete, then the following correction for primary wave 4 may last about one to three months and should be a very shallow correction remaining above primary wave 1 price territory. Although primary wave 3 has now moved above the end of primary wave 1, it looks like primary wave 3 needs to move higher to allow enough room for primary wave 4 to unfold. For this reason, if a pullback begins here, I would not yet expect it to be primary wave 4.
HOURLY CHART – FLAT
Click chart to enlarge.
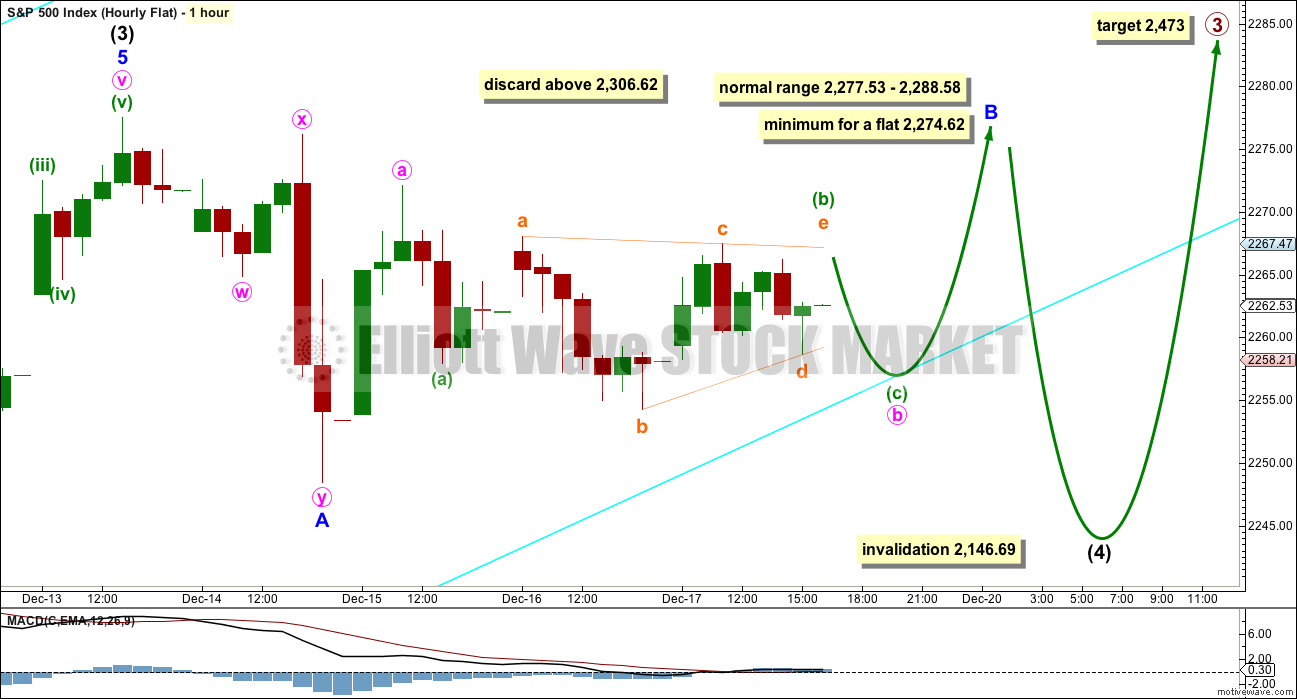
If intermediate wave (4) is a flat correction, then within it minor wave B must retrace a minimum 0.9 length of minor wave A at 2,274.62. The normal range for minor wave B within a flat correction would be 1 to 1.38 the length of minor wave A at 2,277.53 to 2,288.58.
Minor wave B may subdivide as any corrective structure. It may still be a zigzag at this stage.
Within minor wave B, there may be a triangle for minuette wave (b) within minute wave b.
This wave count now requires a reasonable breach of the best fit cyan channel. This may slightly reduce the probability of this idea over the second hourly chart below.
When minor wave B is complete, then a target may be calculated for minor wave C downwards. That cannot be done yet.
There is no rule stating a maximum limit for B waves within flats. There is a convention within Elliott wave that states when the potential B wave is longer than twice the length of the A wave that the idea of a flat correction should be discarded based upon a very low probability. This idea would be discarded above 2,306.62.
HOURLY CHART – TRIANGLE
Click chart to enlarge.
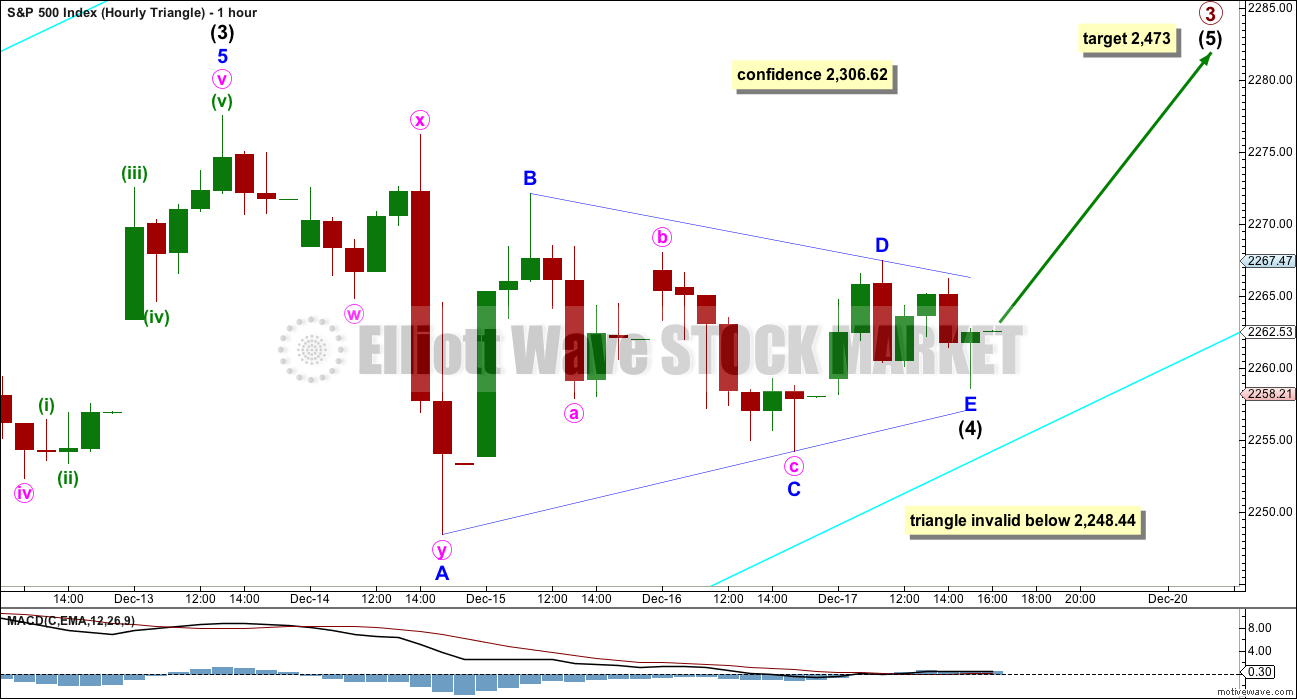
It is possible now that the triangle for intermediate wave (4) is complete as a regular contracting triangle. The next movement out of triangles when they complete usually begins with a swift strong movement. This wave count now expects tomorrow to begin with strong upwards movement.
It is also possible that the triangle may not be complete and may continue sideways for a few days yet. Minor wave B may move higher, and it may make a new high above 2,277.53 as in a running triangle. For this reason there can be no upper invalidation point for a triangle.
Because the triangle may now be considered complete, a new high above 2,248.44 should see the idea of the triangle or a flat continuing discarded, and the next wave up underway.
TECHNICAL ANALYSIS
WEEKLY CHART
Click chart to enlarge. Chart courtesy of StockCharts.com.
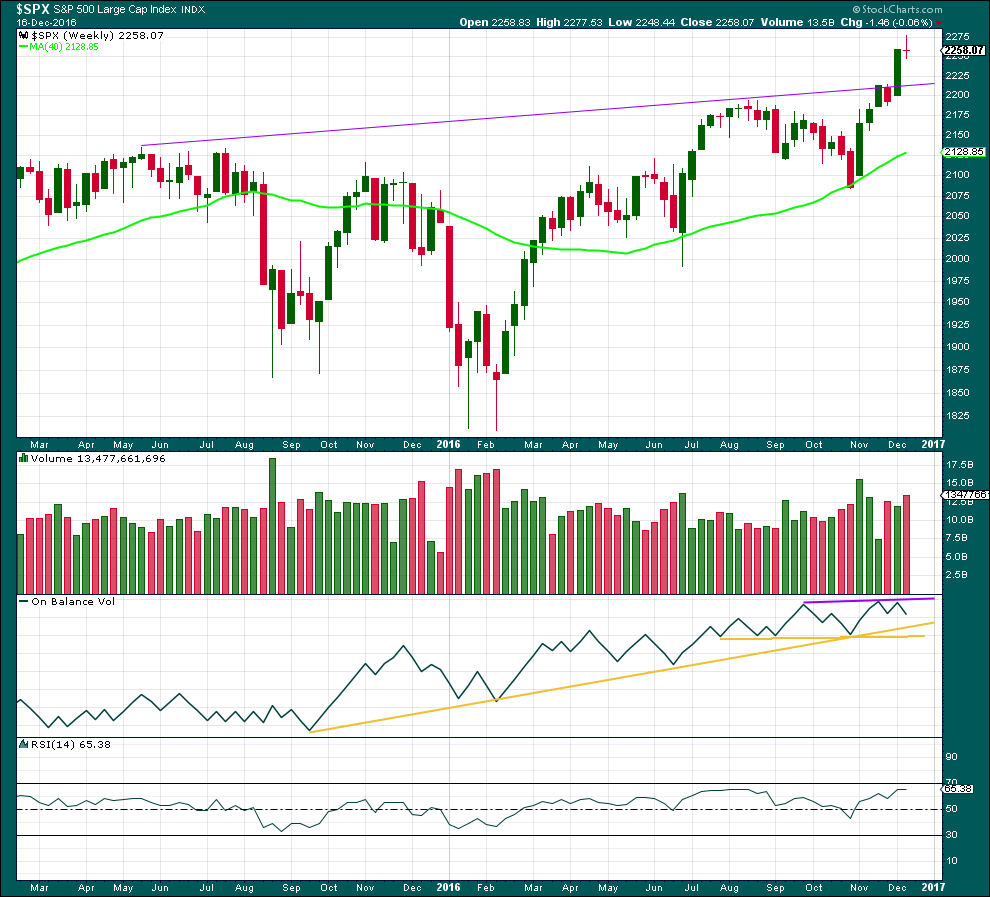
Last week completes a small red doji candlestick. This indicates a pause in the trend, and a change from up to neutral.
Last week closes red and comes with an increase of volume, the balance of which was downwards. There was some support for a fall in price at the end of the week. This in conjunction with the doji is slightly bearish, or at least indicating a consolidation here.
On Balance Volume has found resistance again at the purple trend line. It may find support at the first yellow line, which is very long held and offers good technical significance. This may assist to halt a fall in price forcing a consolidation to be shallow.
RSI is still not extreme. There is room for price to continue higher.
The purple trend line on price may also provide support.
DAILY CHART
Click chart to enlarge. Chart courtesy of StockCharts.com.
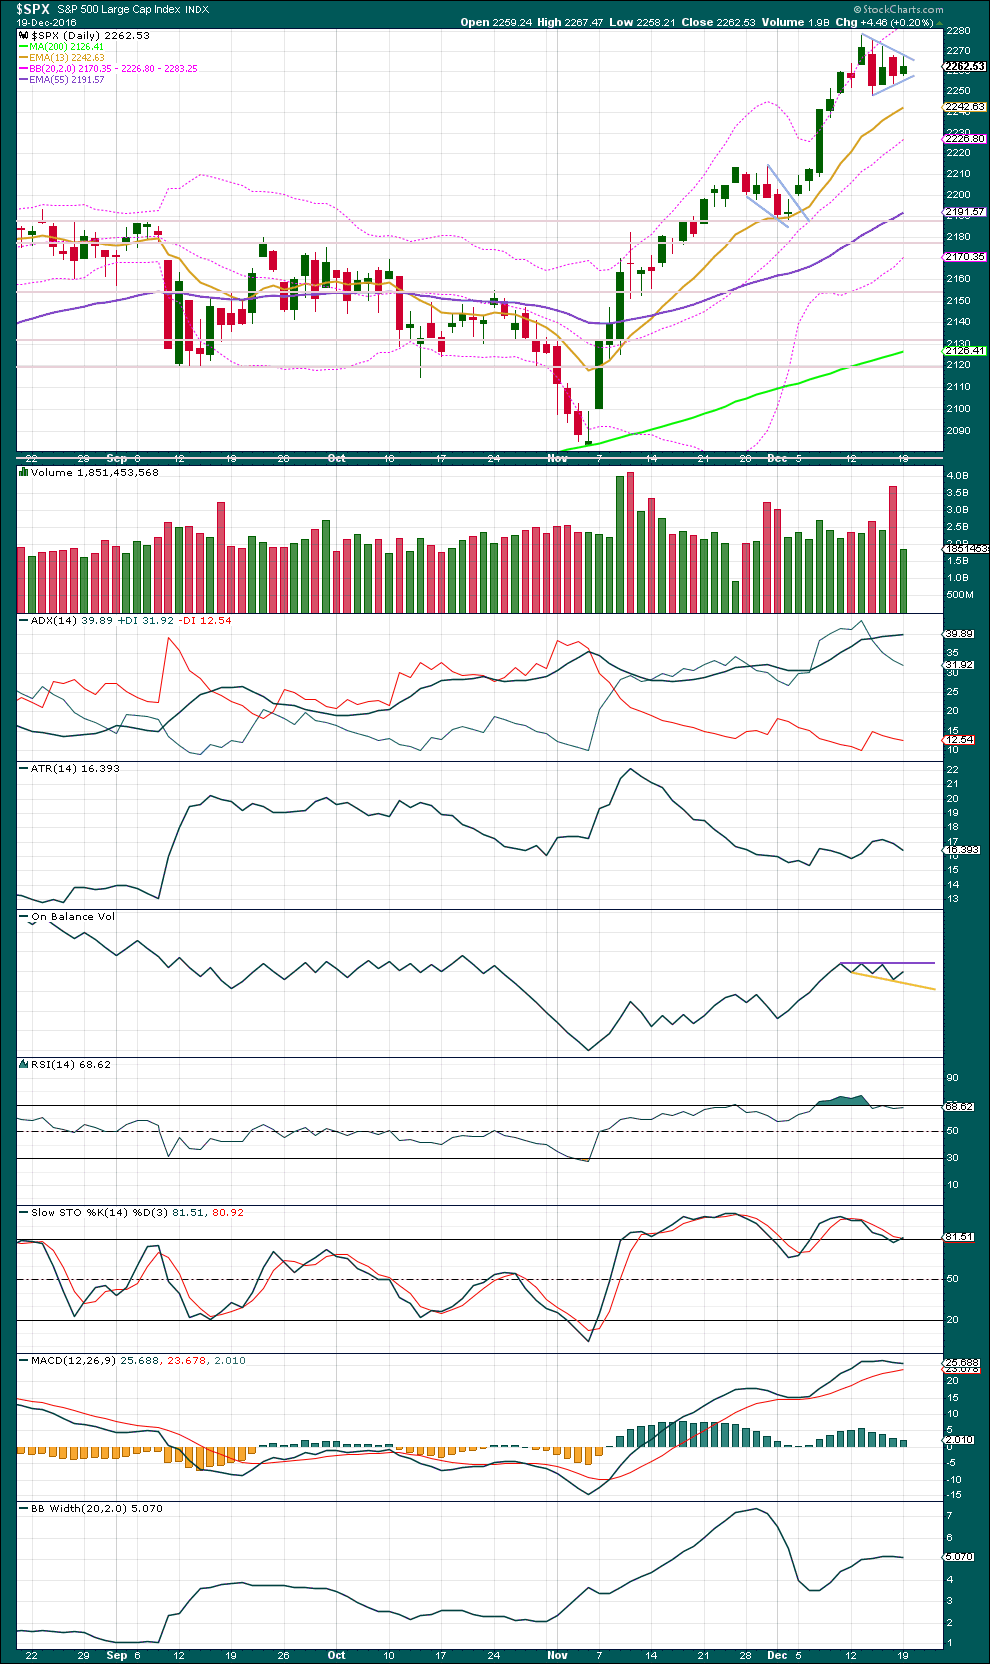
Another small pennant pattern may be unfolding sideways, delineated by blue trend lines. A new target for the next wave up will be calculated using the measure rule, and the first target will be discarded. If the breakout comes early this week, then the target may be about 2,356.
ADX still indicates an upwards trend is in place, but it is still extreme. The consolidation may need to continue a little further to bring this down.
ATR is flat to declining, and Bollinger Bands have ceased to widen. It looks like a small consolidation is unfolding.
RSI and Stochastics are only just coming down from extreme. The consolidation may need to continue further to bring them further into neutral, allowing the market again room to rise.
Overall, this analysis agrees with the Elliott wave analysis and specifically the idea of a flat correction continuing, or possibly also the triangle continuing. The correction looks like it should be incomplete and should continue for a few days.
VOLATILITY – INVERTED VIX CHART
Click chart to enlarge. Chart courtesy of StockCharts.com.
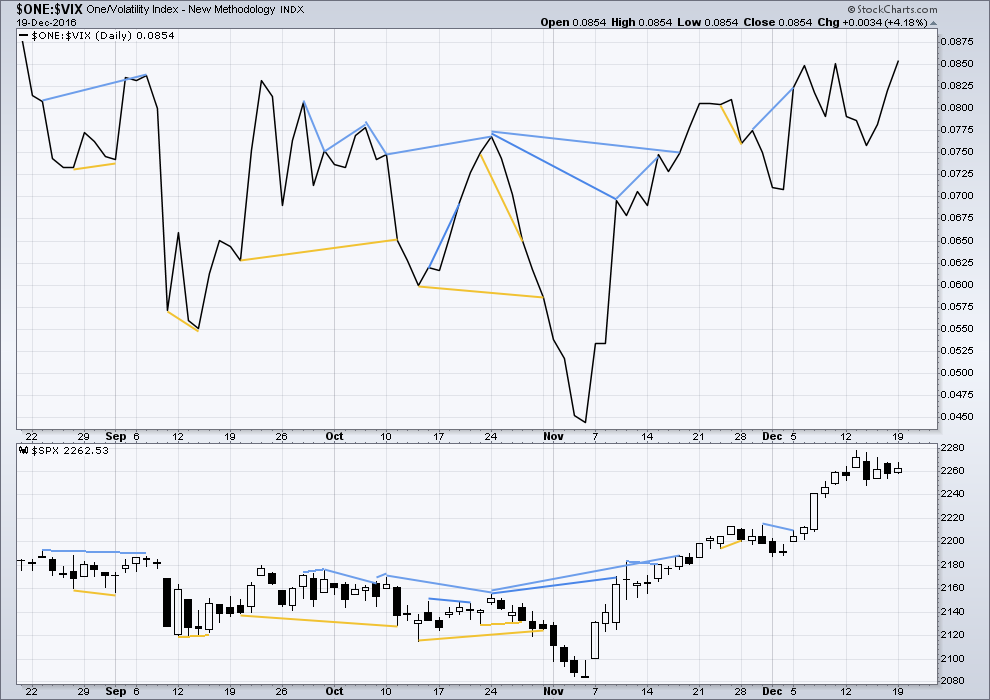
There are a few instances of multi day divergence between price and inverted VIX noted here. Bearish divergence is blue. Bullish divergence is yellow. It appears so far that divergence between inverted VIX and price is mostly working to indicate short term movements spanning one or two days. While this seems to be working more often than not, it is not always working. As with everything in technical analysis, there is nothing that is certain. This is an exercise in probability.
No new short term divergence is noted today between price and VIX. The divergence noted in last analysis, which was interpreted as bullish, may now be resolved by a green daily candlestick.
BREADTH – AD LINE
Click chart to enlarge. Chart courtesy of StockCharts.com.
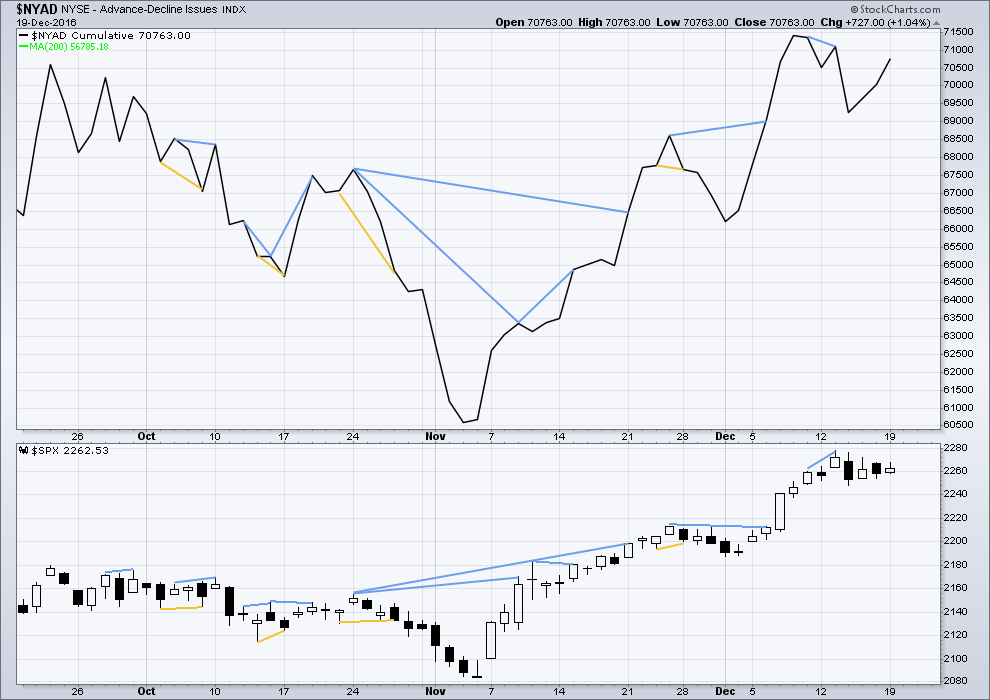
Short term bullish and bearish divergence is again working between price and the AD line to show the direction for the following one or two days.
There is longer term divergence between price and the AD line, but like inverted VIX this has proven reasonably recently to be unreliable. It will be given no weight here.
Bullish divergence noted in last analysis may now be resolved by one green daily candlestick. No new divergence is noted today.
DOW THEORY
Major lows within the old bull market:
DJIA: 15,855.12 (15th October, 2014) – closed below on 25th August, 2015.
DJT: 7,700.49 (12th October, 2014) – closed below on 24th August, 2015.
S&P500: 1,821.61 (15th October, 2014) – has not closed below this point yet.
Nasdaq: 4,117.84 (15th October, 2014) – has not closed below this point yet.
Major highs within the bear market from November 2014:
DJIA: 17,977.85 (4th November, 2015) – closed above on 18th April, 2016.
DJT: 8,358.20 (20th November, 2015) – closed above this point on the 9th of November, 2016.
S&P500: 2,116.48 (3rd November, 2015) – closed above this point on 8th June, 2016.
Nasdaq: 5,176.77 (2nd December, 2015) – closed above this point on 1st August, 2016.
Dow Theory Conclusion: The transportations indicate an end to the prior bear market. The transportation index confirms a bull market.
This analysis is published @ 10:06 p.m. EST.
Thanks Lara for the mid day updates. I am still looking to go long. But I can’t quite pull the trigger. I notice I am still hesitant and having some fear in going long here. Interesting how the emotions can impact a trader even in what might be considered a time of insignificant action by the markets. Perhaps I will take only a small position just to break the ice. We shall see.
SPX is at the top of its weekly BB. That and a few other indicators are creating the hesitancy in me.
I too agree with your hesitation Rodney, I’ve been mostly selling into it and building into the annoying yet useful “Unicorn.” 2 things I can’t get past; intense and active insider selling (at a 5-1 ratio) and the Baltic Dry Index creating a sell signal on both daily and weekly charts. Notwithstanding all of the other known known’s and known unknowns which have yet to produce any doubt in this market. Looks like sheep being led to slaughter.
Oh yeah, it was about midday EST today wasn’t it.
It’s summer here and the birds are waking me up early. Real early.
Regarding weekly BB’s: look back at May 2014, towards the end of the last big bull market before it was interrupted. Price remained about the upper range of BB’s for six weeks then. It could behave like that again, especially as this is a third wave and is showing some strength.
If you’re cautious then reduce risk to 1% of equity. As you say, make a small trade to test the water.
And here is the idea of a regular contracting triangle now complete.
If the opening gap today is a breakaway gap above the triangle trend line then don’t expect it to be filled. It may offer support.
OR – the opening gap today may be a pattern gap which would be filled.
If today continues higher and shows an increase in volume then I’d lean towards it being a breakaway gap.
The death in comments here I’m going to read as a bullish sign.
I’ve said before that when this market is bullish the membership falls. When it’s bearish the membership rises and becomes increasingly active.
Intermediate (4) is not fitting well at all as a flat correction. It does fit nicely if it is a triangle though, so I think today I’ll have two options for a triangle; the first with it complete, and the second with it incomplete.
If it is incomplete then it has to be a barrier triangle. The B-D trend line is essentially flat, and D ends slightly above B. This is possible, but I think it has a slightly lower probability than if the triangle is complete.
Here is the idea of a barrier triangle, incomplete.
Good place to start taking some Yen long especially if you are short Euro.
I’ve been using the green trend line; each time touches it is an opportunity to join the trend. If price breaks below it then a deeper pullback, maybe to the cyan line, has likely begun.
If my wave counting here is correct then two more fifth waves up should complete intermediate (3). Then intermediate (4) may find support at the cyan line, at that stage I’d also have an Elliott channel for support. Intermediate (4) may not move into intermediate (1) territory below 103.29.
I think USDJPY moves somewhat like a commodity, it seems to have swift strong fifth waves. So it could have blowoff tops for minuette (v) and minute v upwards.
If this wave count is right that is.
Thanks Lara for your insights on currencies. I trade /DX, USDJPY, /6E (Euro) quite a bit.