
Friday was expected to begin with some upwards movement, which is how the session began, but price did not move as high as was expected.
Overall, sideways movement was expected for a consolidation, which is what is happening.
Summary: A consolidation has begun and is likely to continue for a few more days with choppy overlapping sideways movement. Monday may see some upwards movement to end within a range of 2,277.53 to 2,288.58. Thereafter, downwards movement should unfold again. In the first instance, the lower edge of the cyan channel on daily and hourly charts will be expected to provide support.
Last monthly chart is here.
Last weekly chart is here.
New updates to this analysis are in bold.
DAILY CHART
Click chart to enlarge.
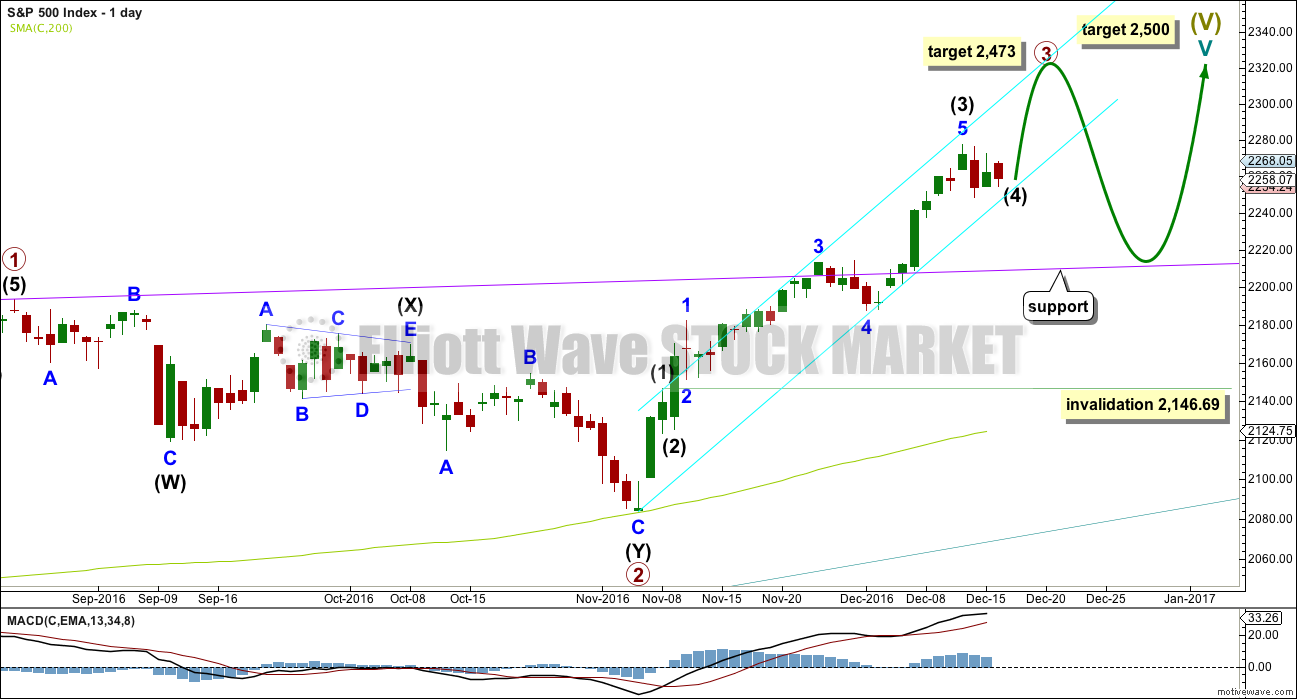
Cycle wave V must subdivide as a five wave structure. At 2,500 it would reach equality in length with cycle wave I. This is the most common Fibonacci ratio for a fifth wave for this market, so this target should have a reasonable probability.
Cycle wave V within Super Cycle wave (V) should exhibit internal weakness. At its end, it should exhibit strong multiple divergence at highs.
Within cycle wave V, primary waves 1 and 2 are complete. Primary wave 3 may be over halfway through and is now exhibiting stronger momentum than primary wave 1. It is possible primary wave 3 may fall short of the target and not reach equality in length with primary wave 1.
Within primary wave 3, the correction for intermediate wave (4) should be relatively brief and shallow. Intermediate wave (2) was over very quickly within one day. Intermediate wave (4) may last a little longer and may not move into intermediate wave (1) price territory below 2,146.69. So far it has lasted three days and the structure is incomplete, so two more to total a Fibonacci five will be the expectation.
At 2,473 primary wave 3 would reach equality in length with primary wave 1. This Fibonacci ratio is chosen for this target calculation because it fits with the higher target at 2,500.
When primary wave 3 is complete, then the following correction for primary wave 4 may last about one to three months and should be a very shallow correction remaining above primary wave 1 price territory. Although primary wave 3 has now moved above the end of primary wave 1, it looks like primary wave 3 needs to move higher to allow enough room for primary wave 4 to unfold. For this reason, if a pullback begins here, I would not yet expect it to be primary wave 4.
HOURLY CHART – FLAT
Click chart to enlarge.
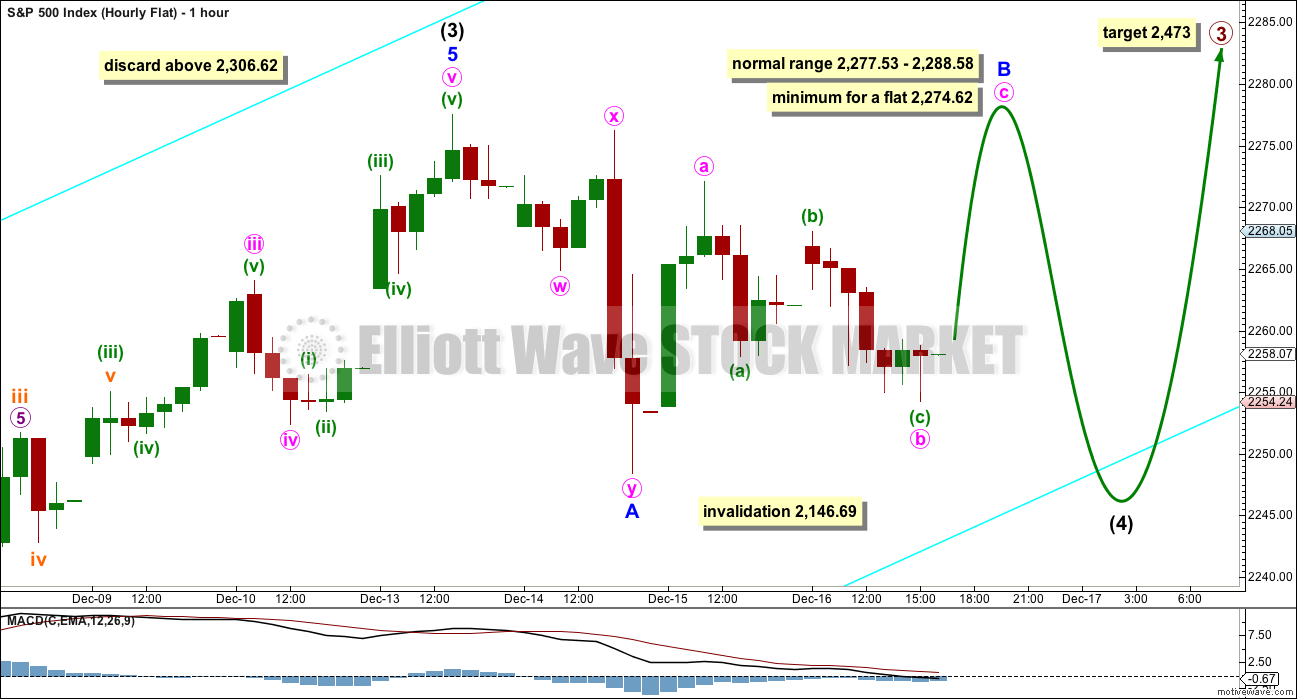
If intermediate wave (4) is a flat correction, then within it minor wave B must retrace a minimum 0.9 length of minor wave A at 2,274.62. The normal range for minor wave B within a flat correction would be 1 to 1.38 the length of minor wave A at 2,277.53 to 2,288.58.
Minor wave B may subdivide as any corrective structure. It may be a zigzag at this stage.
When minor wave B is complete, then a target may be calculated for minor wave C downwards. That cannot be done yet. At this stage, it is expected that minor wave C may find support at the lower edge of the best fit cyan trend channel copied over here from the daily chart.
There is no rule stating a maximum limit for B waves within flats. There is a convention within Elliott wave that states when the potential B wave is longer than twice the length of the A wave that the idea of a flat correction should be discarded based upon a very low probability. This idea would be discarded above 2,306.62.
HOURLY CHART – TRIANGLE
Click chart to enlarge.
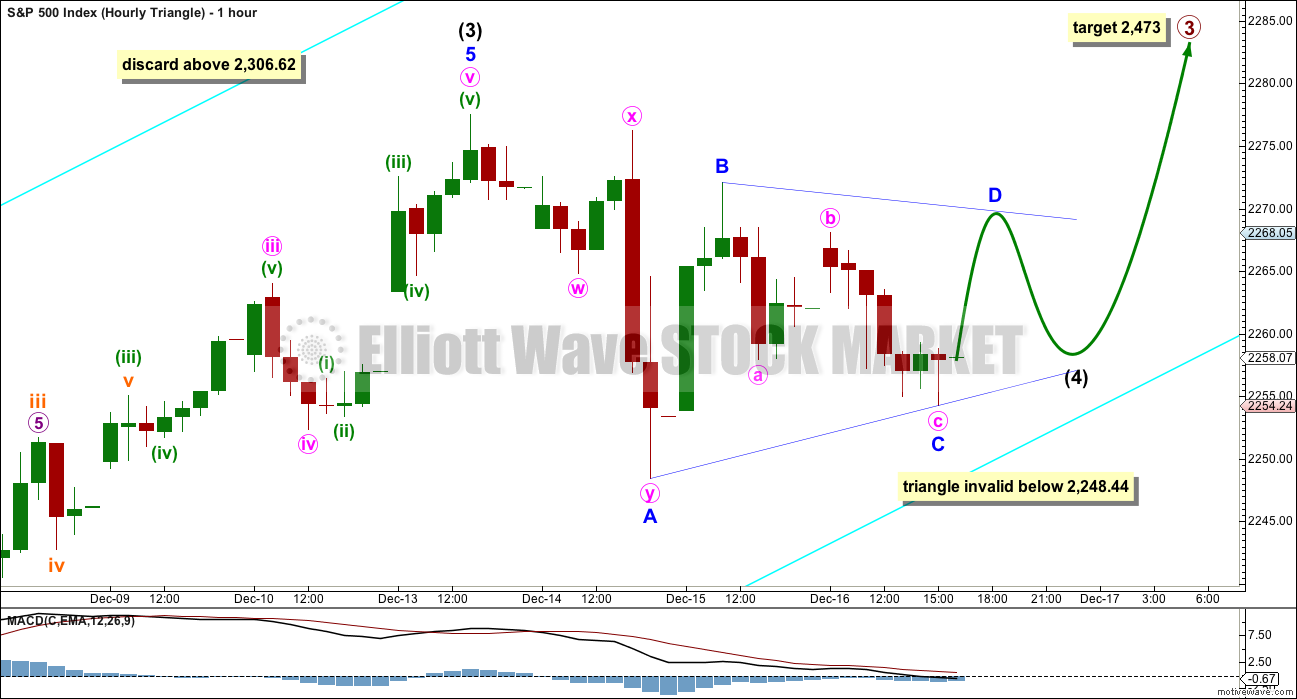
If intermediate wave (4) is a triangle, then minor wave B may be complete. It is also possible that minor wave B may move higher, and it may make a new high above 2,277.53 as in a running triangle. For this reason there can be no upper invalidation point for a triangle.
The same convention for minor wave B will be applied here. If it continues higher, then when it reaches twice the length of minor wave A above 2,306.62 the idea of a triangle will be discarded based upon a very low probability.
If minor wave C continues further, then it may not move beyond the end of minor wave A below 2,248.44.
ALTERNATE HOURLY CHART
Click chart to enlarge.
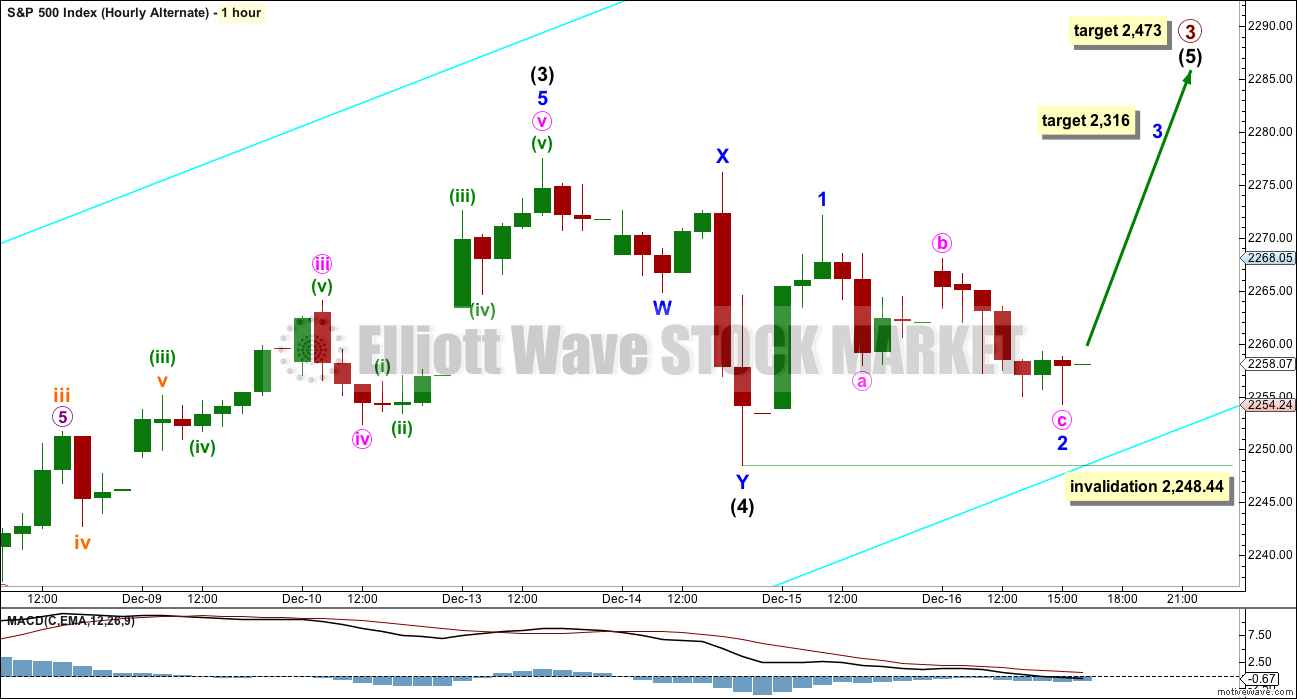
Intermediate wave (4) will fit neatly as a double zigzag on the one minute chart. It may be over here. There is a very little alternation between the single shallow 0.34 zigzag of intermediate wave (2), which lasted 5 hours, and the more shallow 0.19 double zigzag of intermediate wave (4). Alternation is a guideline and not a rule, and the S&P does not always exhibit it perfectly.
Intermediate wave (5) would have to be a long extension, longer than equality with intermediate wave (3) to reach the target at 2,473. If this target is wrong, it may be too high.
Within intermediate wave (5), minor wave 2 may not move beyond the start of minor wave 1 below 2,248.44.
At 2,316 minor wave 3 would reach 2.618 the length of minor wave 1.
TECHNICAL ANALYSIS
WEEKLY CHART
Click chart to enlarge. Chart courtesy of StockCharts.com.
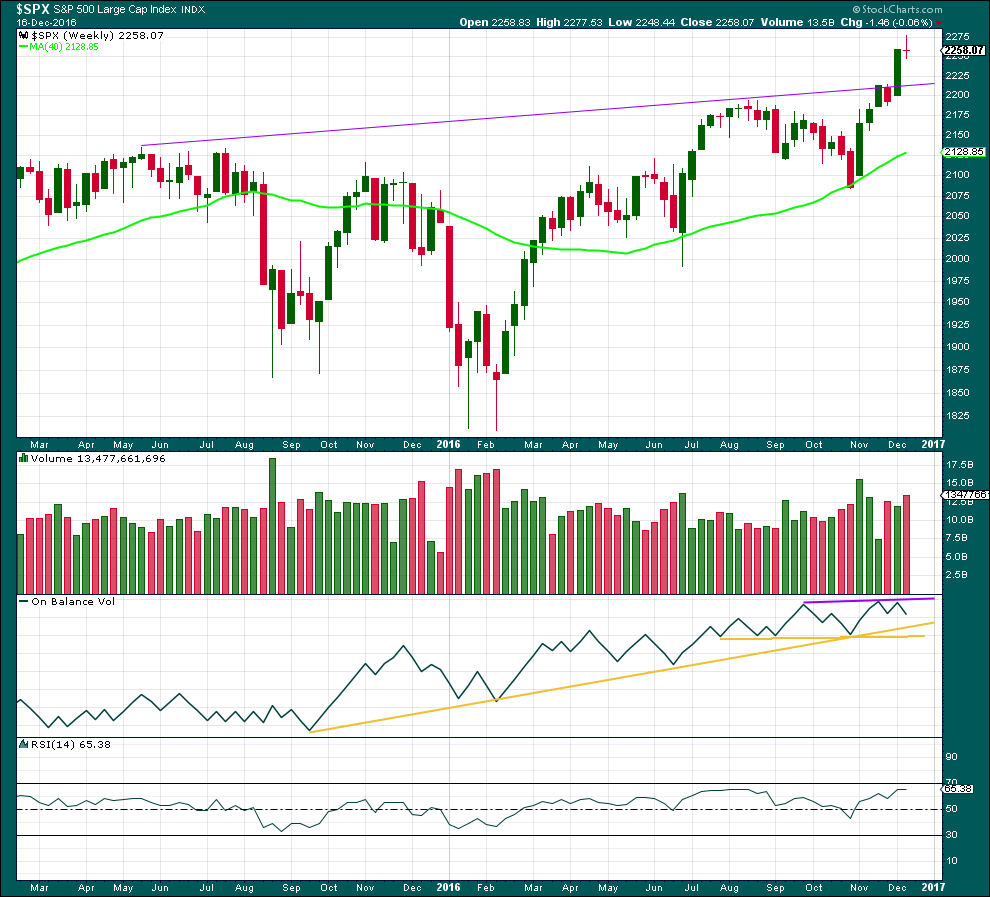
This week completes a small red doji candlestick. This indicates a pause in the trend, and a change from up to neutral.
This week closes red and comes with an increase of volume, the balance of which was downwards. There was some support for a fall in price at the end of the week. This in conjunction with the doji is slightly bearish, or at least indicating a consolidation here.
On Balance Volume has found resistance again at the purple trend line. It may find support at the first yellow line, which is very long held and offers good technical significance. This may assist to halt a fall in price forcing a consolidation to be shallow.
RSI is still not extreme. There is room for price to continue higher.
The purple trend line on price may also provide support.
DAILY CHART
Click chart to enlarge. Chart courtesy of StockCharts.com.
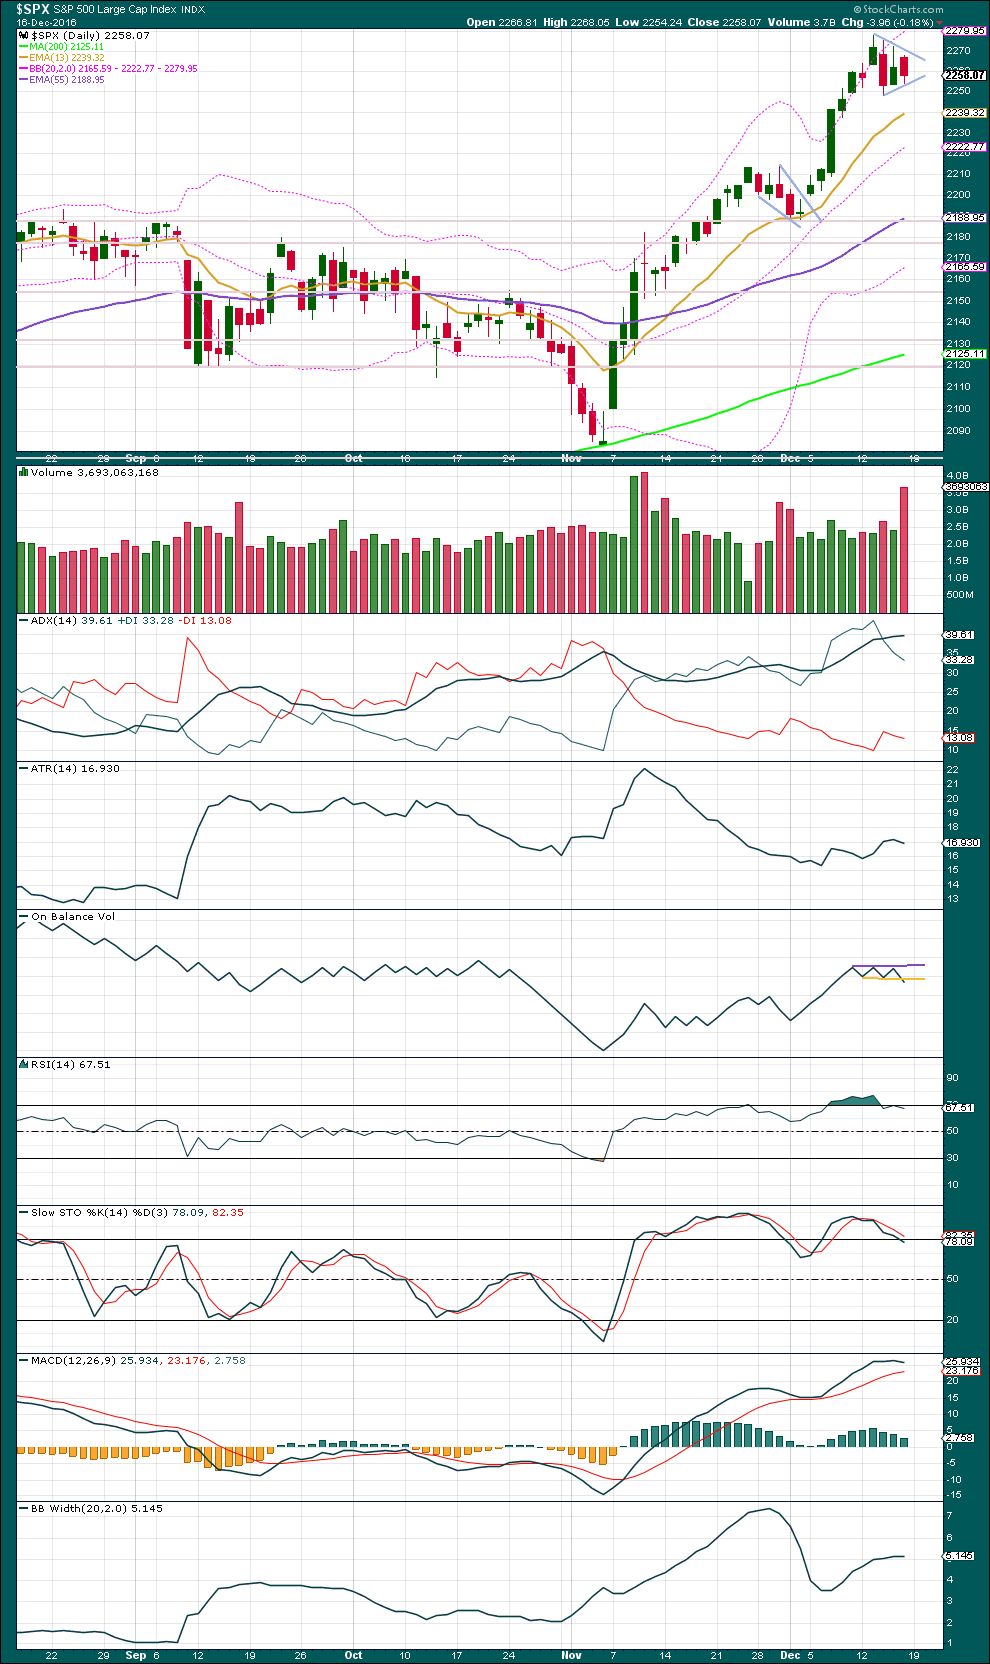
The strong increase in volume for Friday’s session may be due to the last day for options to trade, and so not too much should be read into this. It is slightly bearish.
Another small pennant pattern may be unfolding sideways, delineated by blue trend lines. A new target for the next wave up will be calculated using the measure rule, and the first target will be discarded. If the breakout comes early next week, then the target may be about 2,356.
ADX still indicates an upwards trend is in place, but it is still extreme. The consolidation may need to continue a little further to bring this down.
ATR may be beginning to flatten off at the end of the week, and Bollinger Bands may have ceased to widen. It looks like a small consolidation is unfolding.
RSI and Stochastics are only just coming down from extreme. The consolidation may need to continue further to bring them further into neutral, allowing the market again room to rise.
Overall, this analysis agrees neatly with the Elliott wave analysis that sees a correction incomplete.
VOLATILITY – INVERTED VIX CHART
Click chart to enlarge. Chart courtesy of StockCharts.com.
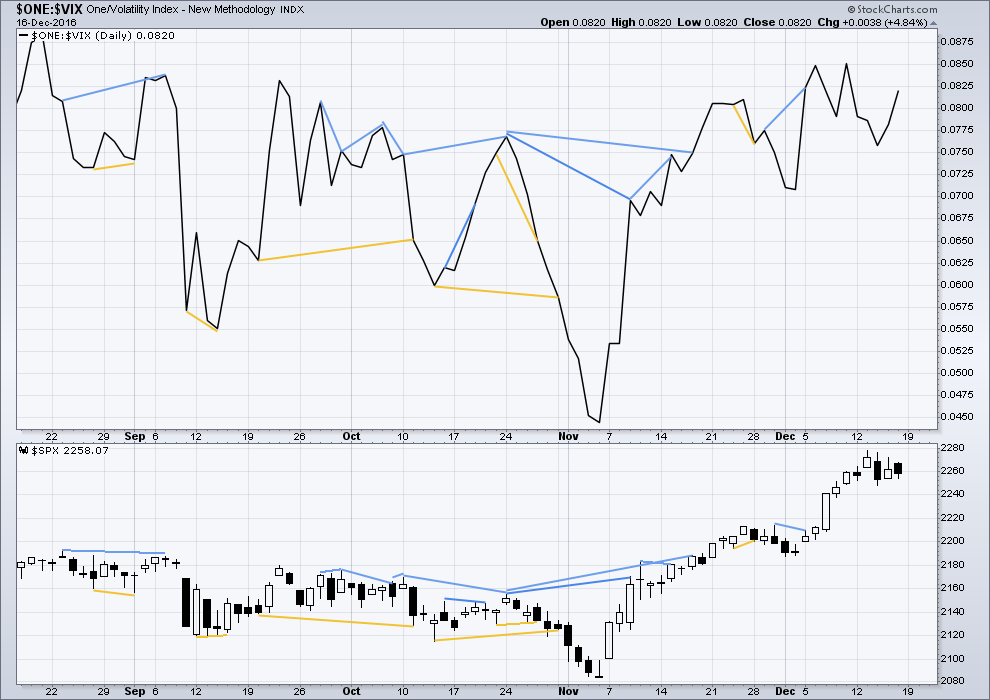
There are a few instances of multi day divergence between price and inverted VIX noted here. Bearish divergence is blue. Bullish divergence is yellow. It appears so far that divergence between inverted VIX and price is again working to indicate short term movements spanning one or two days. While this seems to be working more often than not, it is not always working. As with everything in technical analysis, there is nothing that is certain. This is an exercise in probability.
Price moved a little lower for Friday’s session with the balance of volume downwards, but inverted VIX has moved higher. Normally, as price moves lower volatility increases, but for Friday it declined. This is abnormal and is interpreted as bullish. However, it is noted that this unusual behaviour has happened a few times in the last couple of weeks and it has not predicted the next direction for price. It is noted again, but will be given little weight in this analysis today.
BREADTH – AD LINE
Click chart to enlarge. Chart courtesy of StockCharts.com.
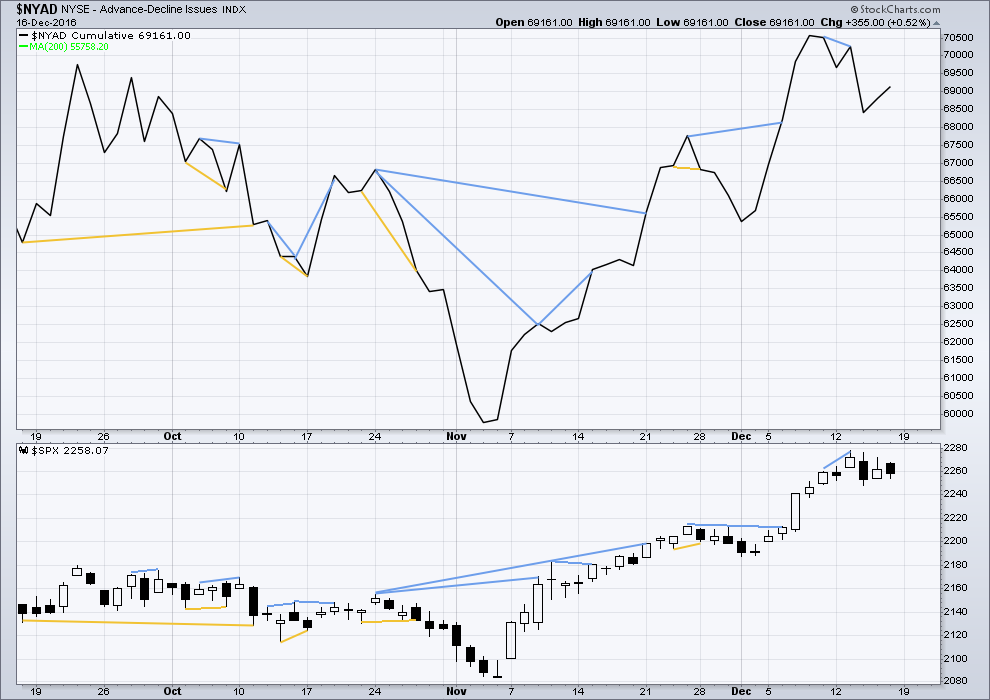
Short term bullish and bearish divergence is again working between price and the AD line to show the direction for the following one or two days.
There is longer term divergence between price and the AD line, but like inverted VIX this has proven reasonably recently to be unreliable. It will be given no weight here.
While price moved a little lower for Friday and the balance of volume was down, the AD line moved higher. The fall in price for Friday was not supported by market breadth. This is interpreted as bullish.
DOW THEORY
Major lows within the old bull market:
DJIA: 15,855.12 (15th October, 2014) – closed below on 25th August, 2015.
DJT: 7,700.49 (12th October, 2014) – closed below on 24th August, 2015.
S&P500: 1,821.61 (15th October, 2014) – has not closed below this point yet.
Nasdaq: 4,117.84 (15th October, 2014) – has not closed below this point yet.
Major highs within the bear market from November 2014:
DJIA: 17,977.85 (4th November, 2015) – closed above on 18th April, 2016.
DJT: 8,358.20 (20th November, 2015) – closed above this point on the 9th of November, 2016.
S&P500: 2,116.48 (3rd November, 2015) – closed above this point on 8th June, 2016.
Nasdaq: 5,176.77 (2nd December, 2015) – closed above this point on 1st August, 2016.
Dow Theory Conclusion: The transportations indicate an end to the prior bear market. The transportation index confirms a bull market.
This analysis is published @ 02:25 p.m. EST on 17th December, 2016.
What if the triangle is a B wave within a B wave?
Intermediate (4) could still be unfolding as a flat correction.
So far it does look like a triangle is unfolding, this fits neatly.
But as always, be wary of triangles. Just when you think you’re sure it’s a triangle, even if you think it’s complete, it will invalidate and turn into a combination or flat correction. Alternate wave counts are essential if you think a triangle is completing. What else could it be?
Here, if it’s a triangle D may be complete. What this chart is saying is look out! If we see a small zigzag down, falling short of the A-C trend line, that could be E.
Price often reverses quickly and strongly out of triangles. In this case the trend is upwards.
Lara,
Can you please repeat your holiday dates. Many thanks.
Monday 26th December 2016 to Friday 6th January inclusive.
This week is the last week of analysis before holiday.
Two weeks holiday. Within that two days NYSE is closed.
The first analysis of 2017 will be done just after NY close of Monday 9th January 2017.