
A breach of the channel on the hourly Elliott wave chart and a new low below 2,252.37 indicate a correction has begun.
Summary: Although the alternate is labeled as such, it may have a higher probability than the main. A pullback has begun and is likely to continue for a few more days with choppy overlapping sideways movement. Tomorrow should move price higher and may complete a green daily candlestick.
Last monthly chart is here.
Last weekly chart is here.
New updates to this analysis are in bold.
DAILY CHART
Click chart to enlarge.
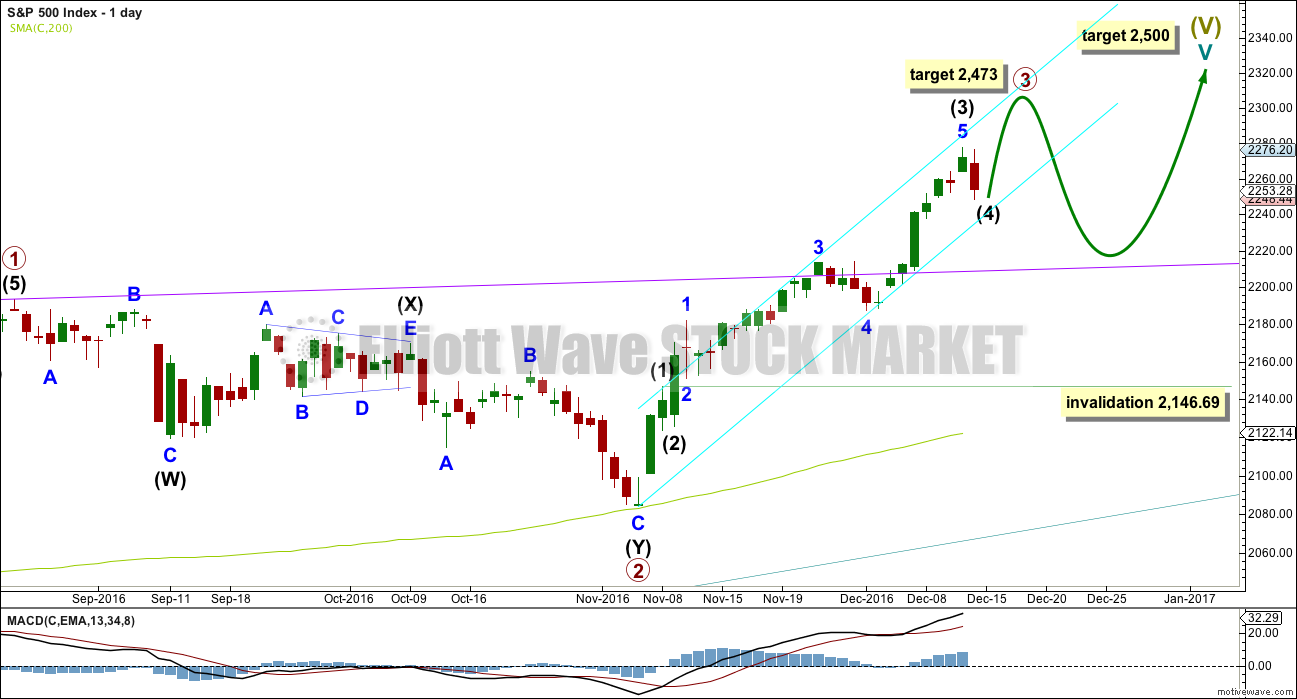
Cycle wave V must subdivide as a five wave structure. At 2,500 it would reach equality in length with cycle wave I. This is the most common Fibonacci ratio for a fifth wave for this market, so this target should have a reasonable probability.
Cycle wave V within Super Cycle wave (V) should exhibit internal weakness. At its end, it should exhibit strong multiple divergence at highs.
Within cycle wave V, primary waves 1 and 2 are complete. Primary wave 3 may be over halfway through and is now exhibiting stronger momentum than primary wave 1. It is possible primary wave 3 may fall short of the target and not reach equality in length with primary wave 1.
Within primary wave 3, the correction for intermediate wave (4) should be relatively brief and shallow. Intermediate wave (2) was over very quickly within one day. Intermediate wave (4) may last a little longer, perhaps two or three days, and may not move into intermediate wave (1) price territory below 2,146.69.
At 2,473 primary wave 3 would reach equality in length with primary wave 1. This Fibonacci ratio is chosen for this target calculation because it fits with the higher target at 2,500.
When primary wave 3 is complete, then the following correction for primary wave 4 may last about one to three months and should be a very shallow correction remaining above primary wave 1 price territory. Although primary wave 3 has now moved above the end of primary wave 1, it looks like primary wave 3 needs to move higher to allow enough room for primary wave 4 to unfold. For this reason, if a pullback begins here, I would not yet expect it to be primary wave 4.
HOURLY CHART
Click chart to enlarge.
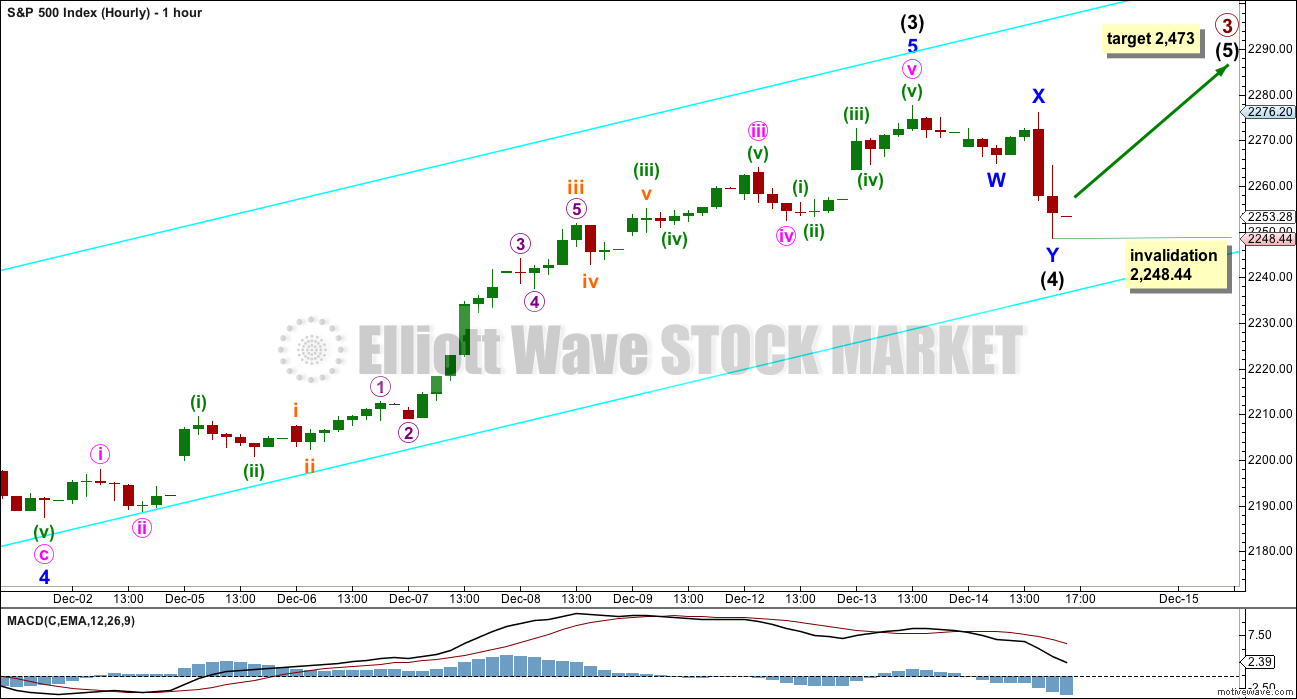
Intermediate wave (4) will fit neatly as a double zigzag on the one minute chart. It may be over here. There is a very little alternation between the single shallow 0.34 zigzag of intermediate wave (2), which lasted 5 hours, and the more shallow 0.19 double zigzag of intermediate wave (4). Alternation is a guideline and not a rule, and the S&P does not always exhibit it perfectly.
Intermediate wave (3) is 12.49 points short of 2.618 the length of intermediate wave (1). This is less than a 10% variation on the length of intermediate wave (3), so it may be considered an adequate Fibonacci ratio, just. If it is accepted that intermediate wave (3) exhibits a Fibonacci ratio to intermediate wave (1), then intermediate wave (5) may be expected to not exhibit a Fibonacci ratio to either of intermediate waves (1) or (3). The target calculation will be left at only primary degree at this stage.
Ratios within intermediate wave (3) are: minor wave 3 is 5.23 points longer than equality in length with minor wave 1, and minor wave 5 is 2.02 points short of 1.618 the length of minor wave 1.
Ratios within minor wave 5 are: minute wave iii is 3.62 points longer than 6.854 the length of minute wave i, and minute wave v 2.35 points short of 2.618 the length of minute wave i.
Intermediate wave (5) would have to be a long extension, longer than equality with intermediate wave (3) to reach the target at 2,473. If this target is wrong, it may be too high.
Within intermediate wave (5), no second wave correction may move beyond the start of its first wave below 2,248.44.
ALTERNATE HOURLY CHART
Click chart to enlarge.
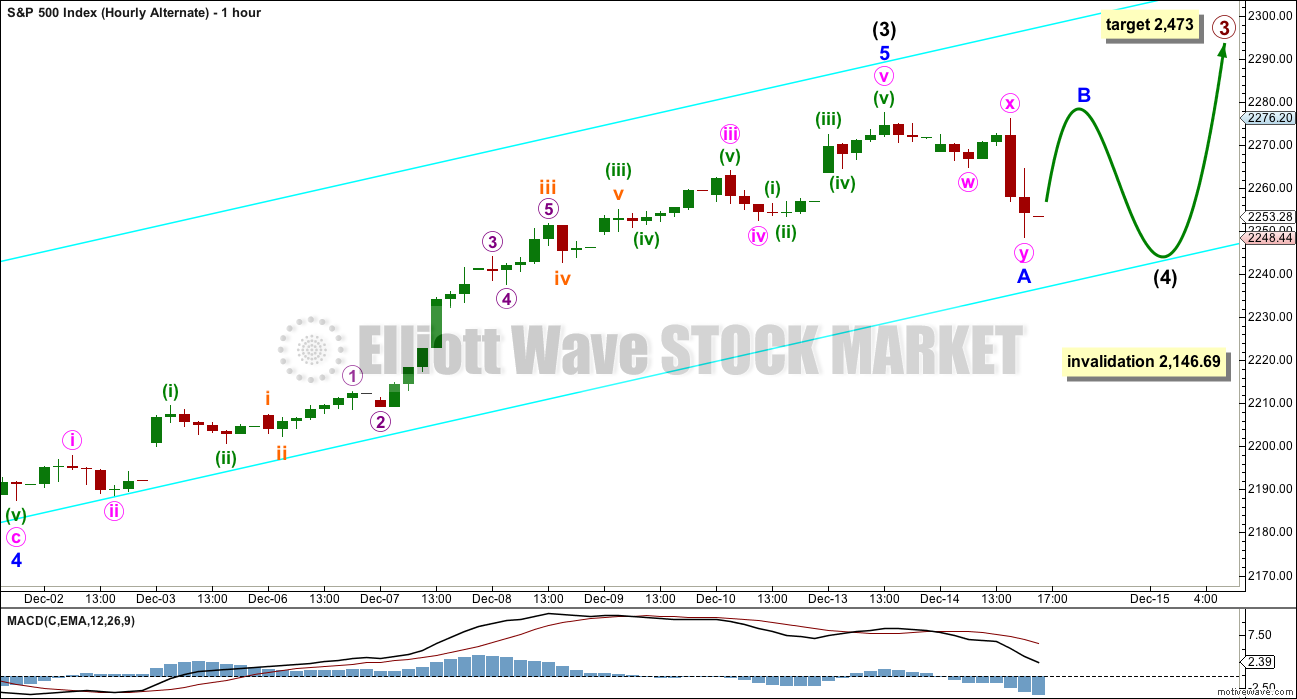
By simply moving the degree of labelling within intermediate wave (4) down one degree, it may be that only minor wave A of a more time consuming flat or triangle is complete today.
If intermediate wave (4) is a flat correction, then within it minor wave B must retrace a minimum 0.9 length of minor wave A at 2,274.62. The normal range for minor wave B within a flat correction would be 1 to 1.38 the length of minor wave A at 2,277.53 to 2,288.58.
If intermediate wave (4) is a triangle, then minor wave B should move higher tomorrow. A normal range for minor wave B within a triangle would be about 0.8 to 0.85 the length of minor wave A at 2,271.71 to 2,273.17. There is no minimum requirement nor maximum limit for B waves within triangles.
A combination may be eliminated for minor wave 4 because a multiple has unfolded lower. This cannot be relabelled as a double zigzag for minor wave W. The maximum number of corrective structures in a multiple is three, and to label multiples within W, Y or Z increases the maximum beyond three violating the rule.
Minor wave B for either an expanded flat or running triangle may make a new high tomorrow above 2,277.53.
In the short term, both wave counts expect a reasonable amount of upwards movement tomorrow. The structure of upwards movement and how high it goes will indicate whether or not intermediate wave (4) is over or not.
TECHNICAL ANALYSIS
WEEKLY CHART
Click chart to enlarge. Chart courtesy of StockCharts.com.
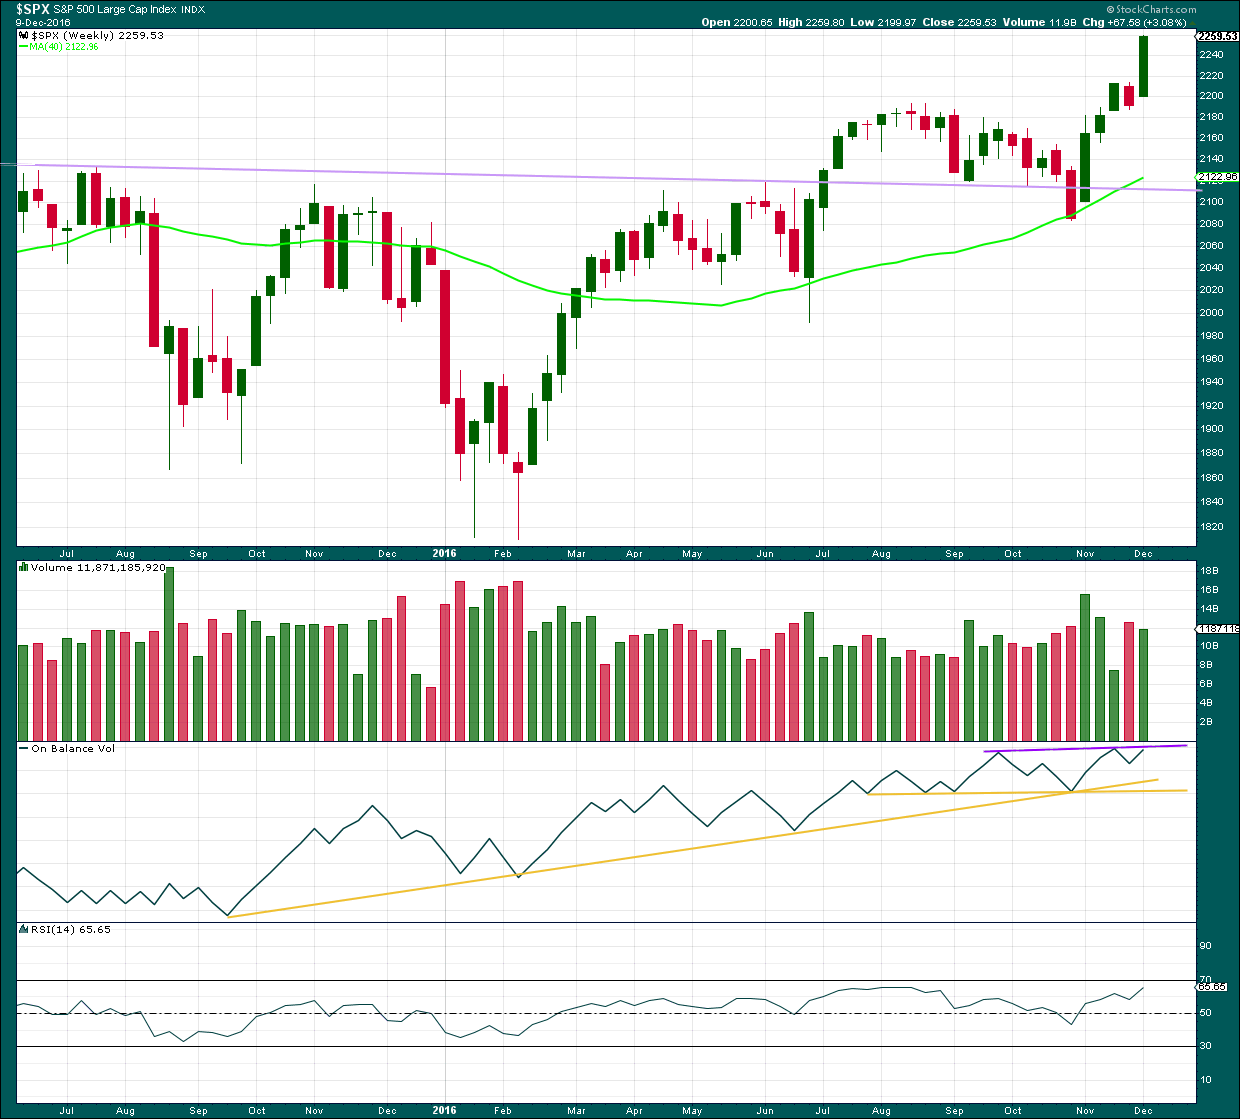
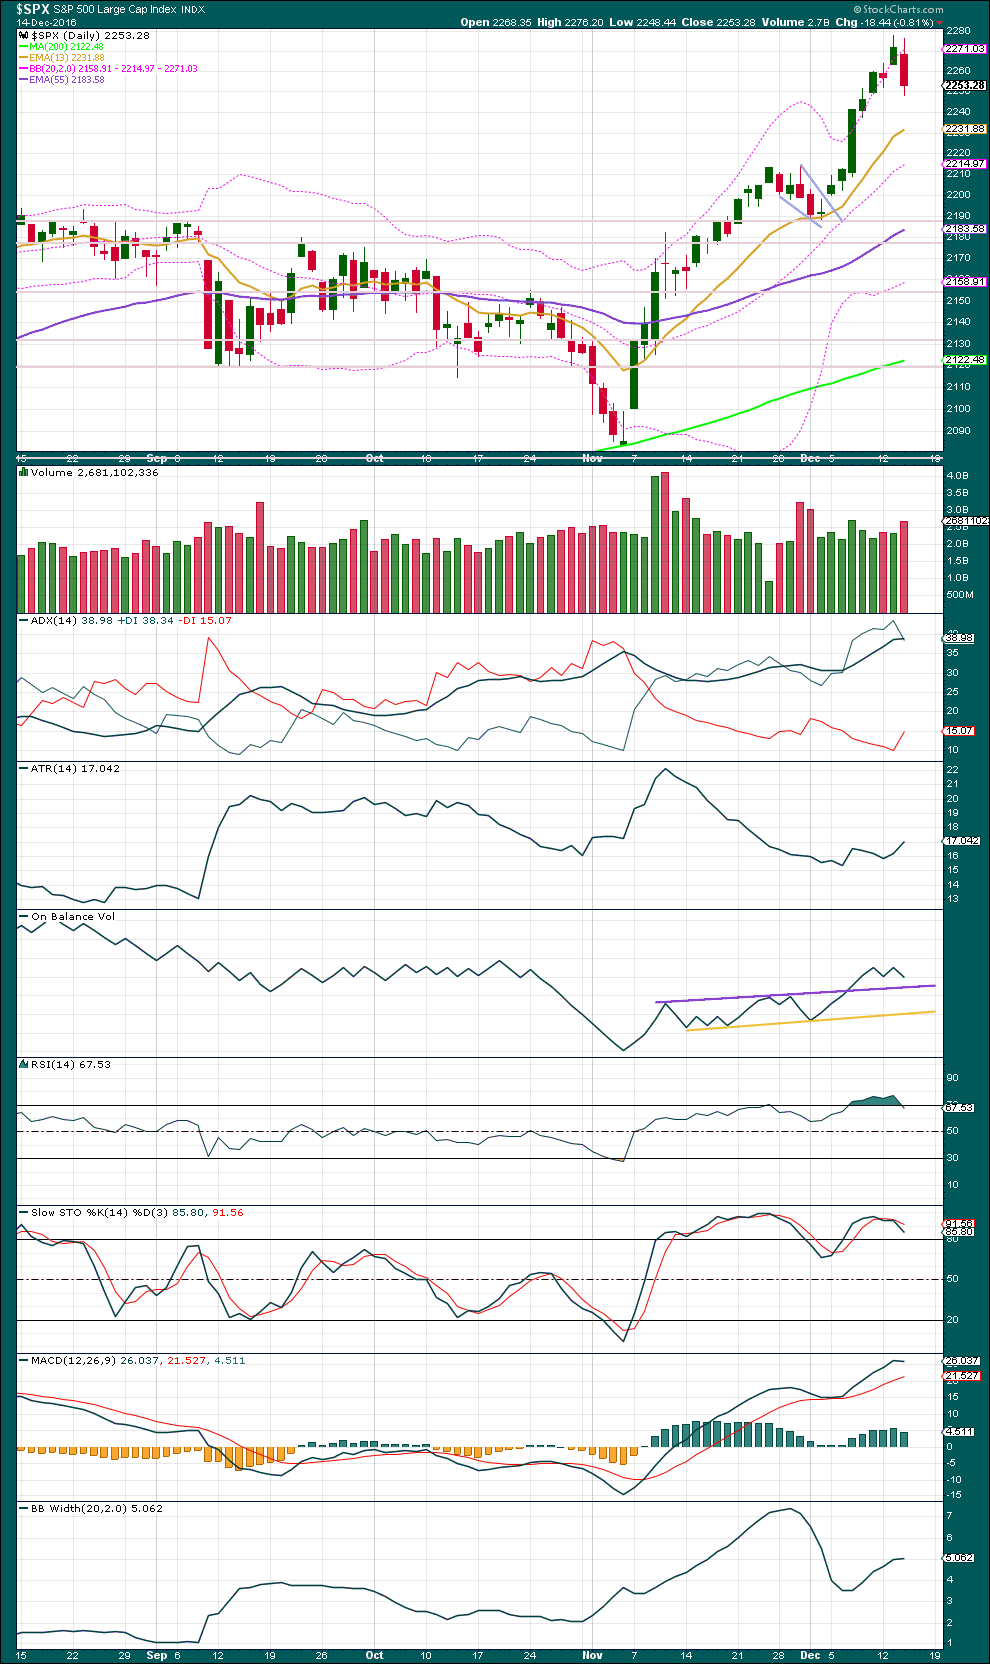
Another strong upwards week comes with a slight decline in volume, but volume is still relatively high.
On Balance Volume may find resistance at the purple line and this may force intermediate wave (4) to arrive earlier than expected. If OBV breaks above this line next week, that would be a fairly bullish signal.
RSI is not yet extreme. There is room for price to rise.
DAILY CHART
Click chart to enlarge. Chart courtesy of StockCharts.com.
The target using the measured rule from the pennant pattern is 2,318. In the first instance, this target should be used. If price keeps rising above it, then use the Elliott wave target at 2,473.
Price has pulled back some after five days in a row of price closing at or above the upper range of Bollinger Bands. Normally, a deeper pullback to find support at either the 13 day moving average or the mid line of Bollinger Bands would be a reasonable expectation.
An increase in volume for a downwards day would normally indicate more downwards movement tomorrow, but this has not always worked more recently.
ADX is today flat and is still extreme. A more time consuming consolidation may be required here to bring ADX back below 35.
ATR is beginning to show some increase. This may support the idea of a deeper pullback about here.
RSI is returning from overbought. A deeper pullback may be required to bring it further into normal range, which would then allow the upwards trend to continue.
Stochastics is still overbought.
It would be reasonable to expect the pullback, which began today, to continue overall for a few more days to relieve oversold and extreme conditions before the upwards trend can resume.
On Balance Volume may find support at the purple trend line halting a fall in price.
VOLATILITY – INVERTED VIX CHART
Click chart to enlarge. Chart courtesy of StockCharts.com.
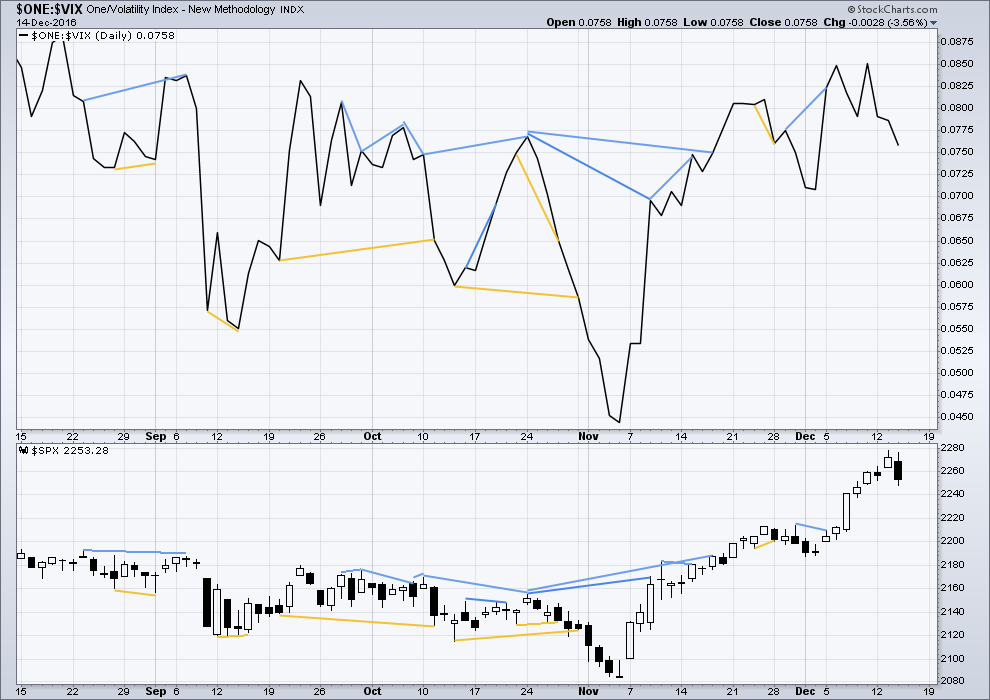
There are a few instances of multi day divergence between price and inverted VIX noted here. Bearish divergence is blue. Bullish divergence is yellow. It appears so far that divergence between inverted VIX and price is again working to indicate short term movements spanning one or two days. While this seems to be working more often than not, it is not always working. As with everything in technical analysis, there is nothing that is certain. This is an exercise in probability.
Bearish divergence has been followed now by one day of reasonably strong downwards movement. It may be followed by one more.
BREADTH – AD LINE
Click chart to enlarge. Chart courtesy of StockCharts.com.
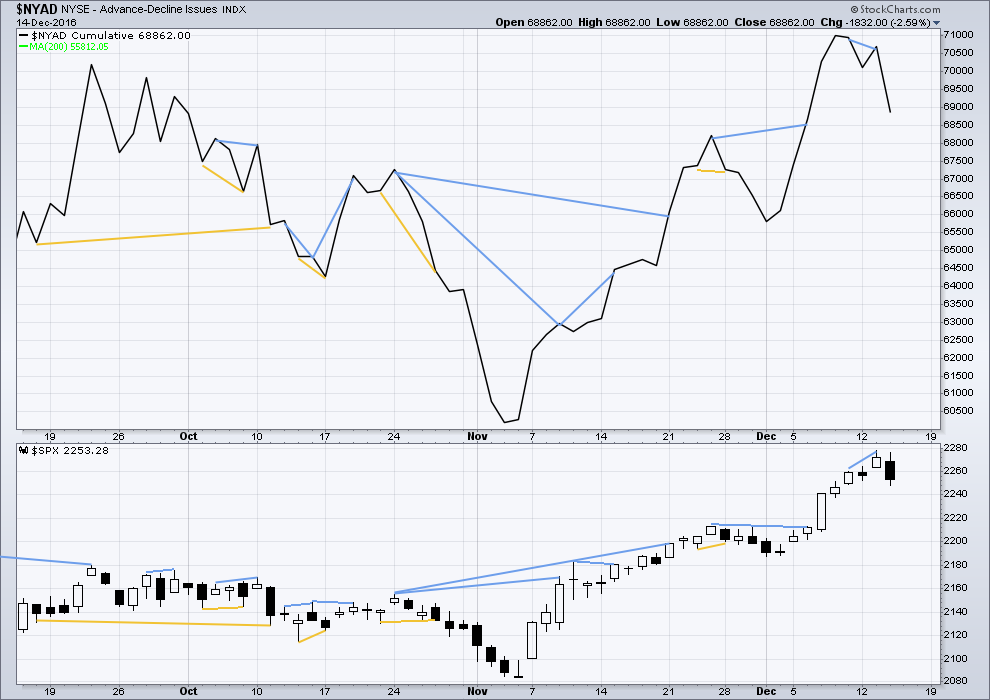
Short term bullish and bearish divergence is again working between price and the AD line to show the direction for the following one or two days.
There is longer term divergence between price and the AD line, but like inverted VIX this has proven reasonably recently to be unreliable. It will be given no weight here.
Bearish divergence is now followed by one day of downwards movement. It may be followed by one more.
DOW THEORY
Major lows within the old bull market:
DJIA: 15,855.12 (15th October, 2014) – closed below on 25th August, 2015.
DJT: 7,700.49 (12th October, 2014) – closed below on 24th August, 2015.
S&P500: 1,821.61 (15th October, 2014) – has not closed below this point yet.
Nasdaq: 4,117.84 (15th October, 2014) – has not closed below this point yet.
Major highs within the bear market from November 2014:
DJIA: 17,977.85 (4th November, 2015) – closed above on 18th April, 2016.
DJT: 8,358.20 (20th November, 2015) – closed above this point on the 9th of November, 2016.
S&P500: 2,116.48 (3rd November, 2015) – closed above this point on 8th June, 2016.
Nasdaq: 5,176.77 (2nd December, 2015) – closed above this point on 1st August, 2016.
Dow Theory Conclusion: The transportations indicate an end to the prior bear market. The transportation index confirms a bull market.
This analysis is published @ 10:22 p.m. EST.
Interesting comments and discussion here today with my morning coffee 🙂
So far today’s upwards move is only 0.81 of yesterday’s downwards move. If intermediate (4) is incomplete and is going to meander sideways for a few days then short term another short wave up would look right.
I’m leaning towards seeing intermediate (4) incomplete, only really because minor 4 one degree lower lasted four days. So far intermediate (4) has lasted only two.
I’m going to wait for it to continue and use it as another opportunity to join the trend.
If I’m wrong then we’ll see a five up develop over the next couple of sessions, that will be minor 1 within intermediate (5).
Actually, here’s another possibility. The upwards move for today could be a complete wave B of a triangle.
Price could just move sideways in an ever decreasing range for a few days for a relatively small triangle.
And this is the problem with fourth waves. There are more than 23 possible structures, and so far I’m only going to rule out 3 (single and multiple zigzags). That leaves over 20 (if you count all the possible combinations).
It’s still impossible at this stage for me to tell you with any reasonable confidence which structure intermediate wave (4) will be.
In fact, it’s impossible for me to say today with any reasonable confidence that it is not over!
As a long term Bull and a very rare breed on this site, I can say buy and hold works in the long term. The same reason why owning a business in long term works, owning a rental property in long term works etc. However, I am a very nervous Bull now. Having been long markets for more than 5 years, I have now scaled most of my longs and started loading up on UVXY and SPXS. I think markets will have a major correction in 2017. I am scaling my dollar longs as well. I think the Euphoria phase of the bull has arrived and usually within 6 months or less, massive correction comes. Will continue closing my longs as markets move higher. We will see 2100 before we see 2350. As always, will reevaluate my thesis on a monthly basis. The goal in this market is not day trading (bots have an edge on it). Look out 3 months, 6months, 12months, 2 years and make trades accordingly. Have a good Christmas and Happy Holidays everyone!!!
Sundeep — have you considered trailing stop sell orders on your positions? Acts to protect the gains in a market like this. Please forgive an explanation, just in case you’re not familiar with ‘trailing’ stops: the stop (aka trigger) price for the sell is set to be X number of points or X% below the stock’s market price. If the stock goes up, the trailing stop goes up. If the stock goes down, the trailing stop does not budge but can be the trigger for a sell. Just an idea.
Lance,
Thanks. Appreciate your help. I used to use trailing stops. But more often than not, they would get executed and I would be out of a long term trade during intra day or couple day gyrations. Now I use mental stops. I use trailing stops for my /CL and /DX trades.
Another idea is to use gaps. Breakaway and running gaps are rarely filled, so these can be good places to move your hard stop up to.
Thanks Lara. Good idea!!!
Either wave four is done, or we are tracing out a flat correction. The theme has been short-lived corrections as the buy the dip frenzy continues to hold sway so I suspect we are already starting the fifth wave up. This will not do much to relieve the over-bought conditions if the next wave up has indeed started. The extremities continue.
I continue to look for a deeper correction. I think I’ll start accumulating long positions around 2240. Hopefully we go that low and lower on a ‘C’ of ‘4’.
That is what SHOULD happen Rod, but…. 🙂
I am trying to think of what a wily bull would do to buck off a few riders, and that would be an unexpectedly deep fourth wave. What kind of fourth waves uniquely goes back into wave one territory?
I know the wave count is seeing an impulse up but I cannot help but wonder…
I took a course with John Carter (he founded Simpler Options) a few years ago and he was the first trader to point out how market signals were changing. For example, during the course he showed a remarkable number of charts with dojis appearing after a clear uptrend that did not lead to the expected reversal, but the exact opposite, in many cases seeing the trend continue with even more gusto. It was truly uncanny, as if some invisible hand was deliberately trying to make the doji mean the exact opposite of what people was expecting. It was also around this time that it became very clear to me that most bearish directional trades were not working and you absolutely had to take profits on bearish trades immediately as I watched countless numbers of winning trades quickly turn into loosing ones. The corrections were swift and quickly being reversed to the upside. I still have to smile at all the times we saw the market setting up to deliver what appeared to be third wave declines at multiple degrees only to see the market continue to power on to the upside. EWI is calling the last move up a third of a third, and I know we have not seen this kind of downside momentum since early this year, with the exception of the remarkable move in futures o election night, which again was entirely reversed by the open.
Another long term bear is now throwing in the towel. I am talking about Harry Dent of Dent Research who has been anticipating a top since 2012, when it looked like a massive head and shoulders top was forming in the indices. He then switched to a megaphone pattern a few years ago and was anticipating a top around DJI 17,000.00
For a while it looked as if that would be the right call as we had quite an extended period of non-conformation from the Transports. But here we are with DJI a whisker from 20,000.00
Dent has recently issued a mea culpa to all his subscribers admitting that he got it wrong and is now expecting DJI to go on to at least 21,500.00 and SPX to 2500.00
Although his main market forecasting metric is demographics, he mentioned in his letter how a host of other indicators he has used reliably for years were all wrong in predicting what would happen in the markets. It would be interesting to find out if there was ever another period in market history with over a year long non-conformation from the Transports with an intact bull market.
That long-winded prelude leads me to this ultimate query. With so many market metrics proving unreliable, how on earth are we going to know when the bear has finally put in an appearance? We have seen from what happened in the futures markets that even thousand point overnight declines in the markets are meaningless so far as predicting future market direction is concerned. In fact I think we even saw a thousand point intra-day decline reversed also last August in DJI. Are we now, as so many seem to opine, in an era of the perpetual bull market? Have the banksters really managed to destroy the business cycle?
I have my own opinions on the answers to those two queries.
What do you think?
I saw the Dent apology letter yesterday. He has been WRONG since 2012.
EWI has been WRONG since 2012.
Nothing works anymore or makes any sense. The ONLY thing that has proven RIGHT?
BUY an Index and FOGETABOUTIT forever!
That has proven RIGHT since at least 1897… as the chart in my other posting shows (if I can figure out how to copy and paste here a chart from an email).
The Mutual Fund and Financial Planning Complex has been proven RIGHT over the long-term.
No? Why?
Try saving the image as a JPG, GIF or PNG file. You should be able to click on “Choose File” in your comment window and browse to the location where you have saved the file, then click “Open”. Easy peasy! 🙂
So that’s how it works! It posted and when I edited the text, it turned into a link. I guess you can’t edit after you post.
It does not go away if you edit. It just does not show up for about a minute after the edit. It took me a few tries before I realized that the image was still there.
Okay thanks… I have it now.
To his credit, in the middle of the apparent incipient market melt-down in Feburary, Prechter did switch his call after sending out an interim report of an imminent market crash and called a fourth wave correction after market breadth of the decline lessened dramatically. I am not sure why he seemed to prefer the ending diagonal he called for earlier this year. Perhaps it was again due to internal market weakness in the breadth of the advance but that fifth wave did look a bit short to me personally. Too many analysts are failing to recognize that formerly reliable market metrics no longer can be relied upon to give insight into what the market is going to do. The banksters have very deep pockets and seemed determined to do whatever it takes to keep this bull alive….
That was NOT a clear cut switch in his call… it was very vague!
That is the problem with their writings… He is clear cut when he calls for a big decline… but very vague when it’s over or if he is changing.
You are right about the vagueness, but it is outright certainty compared to their arrogant pronoucnements of a few years ago. I am guessing somebody sued them for all their wrong calls so now the have resorted to talking out of both sides of their mouth to protect their hiny. I use to get so frustrated reading Hochberg’s analysis as he seemed incapable of providing objective analysis, even when his intractable bearish counts repeatedly proved to be dead wrong. I actually sent him an e-mail telling him the only way his subscribers were going to make any money from his updates was to do the exact oppoiste of what his wave counts called for. I am not kidding you. That is when I started to make profitable trades – trading against his wave counts! 🙂
Anyway these days what they provide is pretty pathetic. Rather than be wrong, they are always hedging their bets in their analysis. I keep reading them so I can figure out where the market is likely to go…
It’s right during bull markets.
But you wouldn’t want to have bought in 1929 and tried to hold throughout the massive crash that began the Great Depression.
Those grey areas on your chart? Some are pretty long in duration. That would have been a long time to hold equities and see them flat or decline.
Plenty of people lose their businesses, homes, all their savings, in market crashes and depressions that tend to follow.
We want to avoid those.
Oh My! Yes indeed! Let’s do avoid those if at all possible. If we are indeed in a GSC top, the decline is going to be as relentless as the move up has been, and true to human nature, folk will keep buying the dip all the way down. My last indicator of choice is now SVXY and its 100 day SMA. Until that is surrendered, the trend remains up. Now let’s get this fourth wave completed so we can hop on this one last ride to the top. All aboard!! 🙂
Verne,
You make some excellent comments and with rates moving higher and dollar rise, buy-backs will eventually become more difficult for the multi-national companies.
Meanwhile, I have noticed that you have a very good feel for using options. From your experience, do you think John Carter’s course is one of the best out there, or would you suggest another?
I’d appreciate your input….thank you…
Melanie
You are most welcome Melanie. Thank you for the kind comments.
John Carter is one of a kind and I do recommend his group and courses. The thing I love about him is he understands a trader’s learning is never done and that is I think the most important thing that he communicates to his students. He is also good friends with Richard Branson (did some oil hedging trades for Virgin Air, now sold of course) who has a nice spread in my hometown neck of the woods in the BVI (Necker Island). John’s courses (and those of his colleagues) are typically around two to three hundred bucks for an all day session and a little more if you want to do a live trade session in which he actually shows the techniques learned live in action. It really is amazing watching these guys go to work. One of his colleagues, Chris Brecher also has a very keen eye for unusual option activity and can spot whale-like trades in the making. They have been running a 7.00 trial period for a month for folk who want to try out the service and kick the tires. Hope that helps a bit.
Thanks very much Verne….I will look take a look at his website.
I just received an Email with the following part included… Amazing!
[This 1 Chart Proves Dow 50,000 is Inevitable
Dear Reader,
Take a good look at this chart of the stock market dating back to 1897…
{I don’t know how to post copies of charts… never works}
See the repeating pattern?
Bull market … bear market. Bull market … bear market…
For the last 120 years, this pattern has never been interrupted. And right now this pattern proves that we are entering a new bull market.
“This chart proves that this next bull market will be bigger than
every other bull market in U.S. history … combined!
The Dow is going to 50,000.” ]
Yep… Everything is absolutely amazing.
I will be watching the bond market with great interest the next few weeks. I have always contended that the FED would not raise rates until the market forced them to. Well, they were forced (and are still behind the curve based on current market rates). Did anybody notice how Frau Yellen conveniently ignored “data” that could have easily been cited as a reason to continue FED inaction but did not? At the moment, everyone is bullish, and I mean everyone! I wonder why VIX is heading higher?! 🙂
In my opinion… 3.26% on the 30 Year Treasury is the key level to view.
If a 3.26% Yield is penetrated and accelerates higher, LOOK OUT!
That would mean the long-term reversal in Yields is confirmed and a new higher high… higher low range is now in place permanently (means Next 40 Years).
If it doesn’t go through 3.26%… expect that is it for higher yields for at least the next 12 months.
There is no question that the decades old bond bull market is over…period. The only question is how quickly rates are going to rise. The equities markets are continuing to pretend that all is well but that delusion will end as rates continue to march higher. The FED think that they are in control but they are now captive to the market’s rate pricing mechanism and WILL be dragged, albeit kicking and screaming into a higher rate environment. I seriously doubt you will hear too much more talk about “data dependence”, it has always been a canard. Higher rates mean increasing global bond defaults. Increasing bond defaults means a stampede of bond holders to salvage what is left of their principal. A stampede of bond holders means higher rates as folk attempt to liquidate at any price…you get the picture. Now, think about how much of this market rocket rise higher has been based on stock buy-backs courtesy of trillions in corporate bonds issued to finance those purchases. Perpetual bull market?
As Raiden in mortal kombat would opine:
“I don’t think so!”
Vern… You and I have been saying this (Bond Defaults- Buy Backs, etc) for a long time now!
It doesn’t look like any of this is ever going to happen… Maybe time to… well give up on it.
Well my friend, I do not think we have been wrong. I do think we have been early. Never underestimate the gullibility of the herd. After all, this is the first rate hike from the FED in a year! Think about it. Folk are still watching what the FED, and not the market is doing. Of course this market could keep marching higher with DJI 21500.00 and SPX 2500 both real possibilities. It will eventually end but calling a top has been clearly a fool’s errand. The key is to still have some powder dry when it does end. As someone we know would say…it’s gonna be YUGE!! 🙂
The window is getting very small… only 1.5 Years…IMO.
After that it will NOT occur!
Let the major restructuring of the USA economy begin… IMO an adjustment period is in the cards. But the stock market is already pricing in the future growth that will start 1.5 years from now and beyond.
And frankly… what EWI has been calling for… lows well below 2008/2009, well the way I see things playing out now with Trump and what I believe he is planning… I just don’t see that occurring anymore.
One thing I can say with certainty is the Trump will execute his planed restructuring to the fullest! The adjustment period is 1.5 years or less.
Lows below 2008/2009… no not anymore!
The crack-up could come much sooner imho. Remember the bond market totally dwarfs the equities market and their is no way that banksters can paper over a bond market melt-down – not even if they kept the printing presses running 24/7. The artificially suppressed interest rate, even more so than all the bankster cash infusions and corporate buy-backs, has been what has kept this bull market alive and well. If interest rates continue to rise, it will have and accelerating domino effect on the entire house of cards, forgive my mixing of metaphors!
Dollar at 113 and change, not sure how long the market can move up against such a huge move, you gotta wonder how we are going to export with other countries loosening their currency.