
Upwards movement was expected for Monday’s session. Price today has made a new all time high.
Summary: There is an upwards trend in place, but it is becoming extreme. Use the narrow channel on the hourly chart; while price remains in the channel, the target for intermediate wave (3) to end is at 2,280 – 2,282. If price breaches the lower edge of the channel with downwards (not sideways) movement, expect a brief shallow pullback has begun. Corrections are an opportunity to join the trend.
Last monthly chart for the main wave count is here.
Last weekly chart is here.
New updates to this analysis are in bold.
MAIN WAVE COUNT
DAILY CHART
Click chart to enlarge.
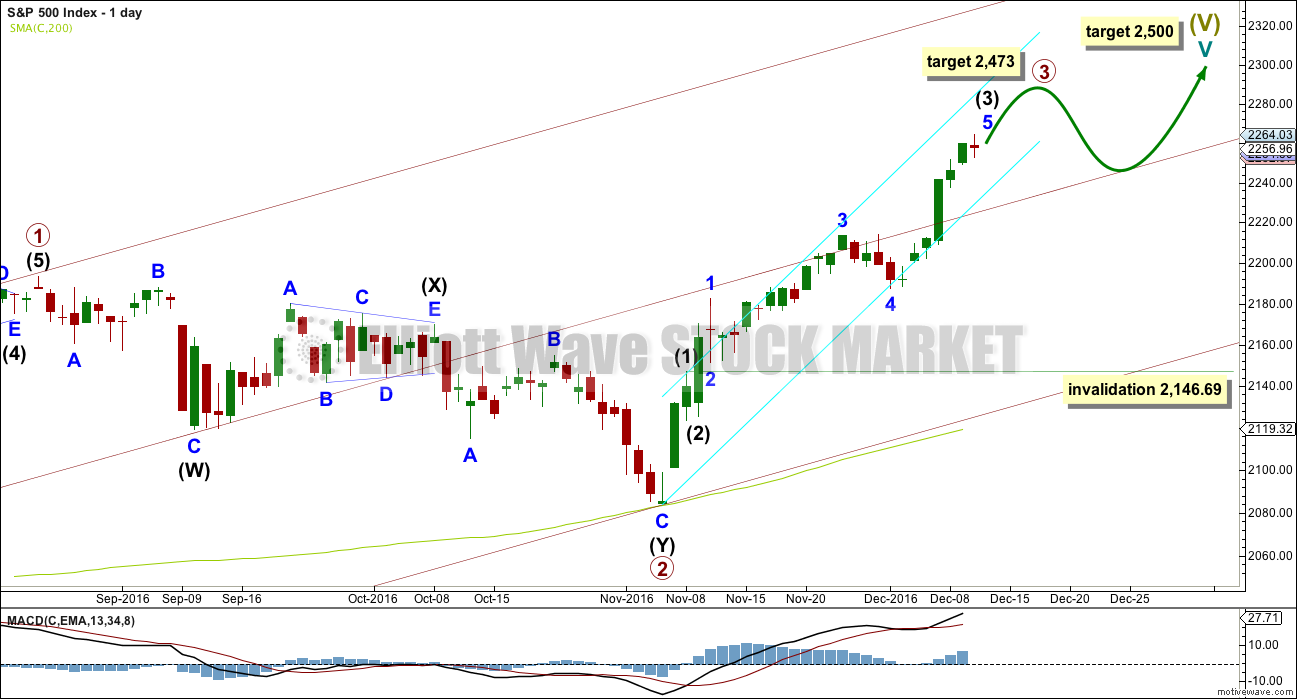
Cycle wave V must subdivide as a five wave structure. At 2,500 it would reach equality in length with cycle wave I. This is the most common Fibonacci ratio for a fifth wave for this market, so this target should have a reasonable probability.
Cycle wave V within Super Cycle wave (V) should exhibit internal weakness. At its end, it should exhibit strong multiple divergence at highs.
Within cycle wave V, primary waves 1 and 2 may be complete. Primary wave 3 may be over halfway through and is now exhibiting stronger momentum than primary wave 1. It is possible primary wave 3 may fall short of the target and not reach equality in length with primary wave 1.
Within primary wave 3, the upcoming correction for intermediate wave (4) should be relatively brief and shallow. Intermediate wave (1) was over very quickly within one day. Intermediate wave (4) may last a little longer, perhaps two or three days, and may not move into intermediate wave (1) price territory below 2,146.69.
At 2,473 primary wave 3 would reach equality in length with primary wave 1. This Fibonacci ratio is chosen for this target calculation because it fits with the higher target at 2,500.
When primary wave 3 is complete, then the following correction for primary wave 4 may last about one to three months and should be a very shallow correction remaining above primary wave 1 price territory. Although primary wave 3 has now moved above the end of primary wave 1, it looks like primary wave 3 needs to move higher to allow enough room for primary wave 4 to unfold. For this reason, if a pullback begins here, I would not yet expect it to be primary wave 4.
The maroon channel is redrawn as a base channel about primary waves 1 and 2. Draw the first trend line from the start of primary wave 1 at the low of 1,810.10 on the 11th of February, 2016, then place a parallel copy on the high of primary wave 1. Add a mid line, which has shown about where price has been finding support and resistance. This may provide support for any pullback here now that price is back above the mid line.
HOURLY CHART
Click chart to enlarge.
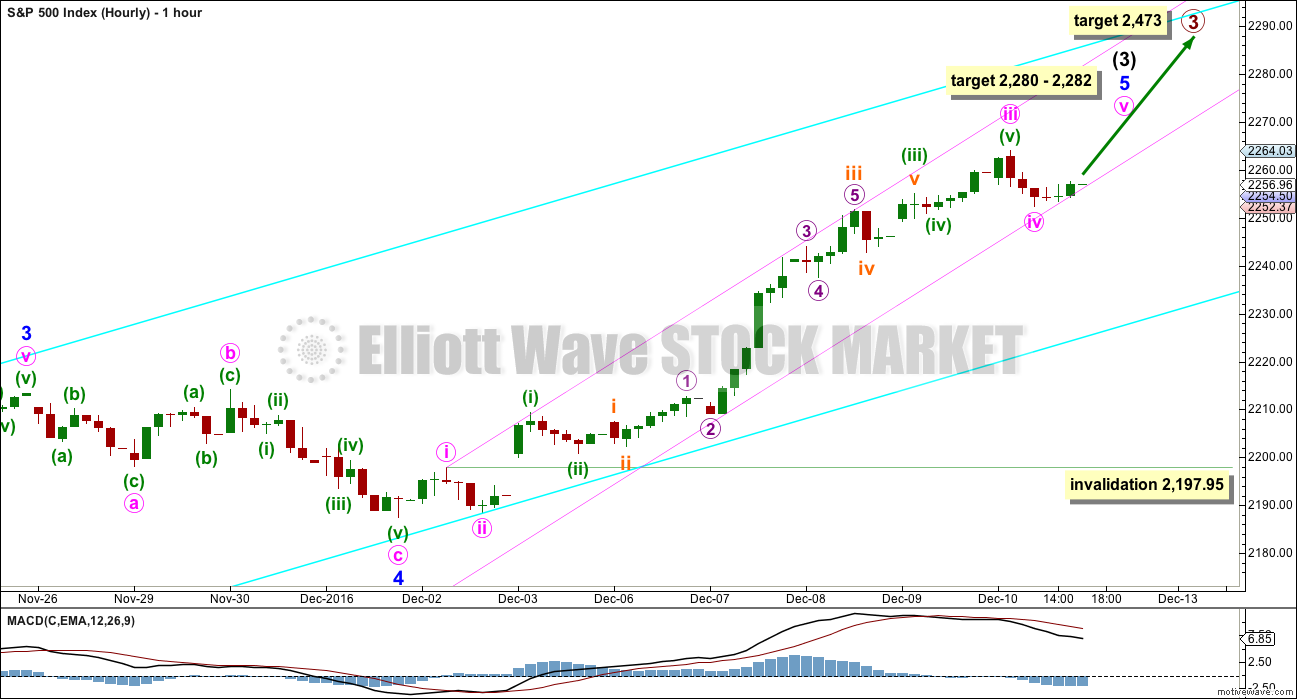
Intermediate wave (3) may still be incomplete. Use the narrow pink channel about minor wave 5 to indicate when it is over. It will be an indication intermediate wave (3) might be over when this channel is breached by downwards (not sideways) movement.
During Monday’s session price has found support along the lower edge of this pink channel. If that continues in the morning of tomorrow’s session, then the probability that intermediate wave (3) is incomplete will increase.
At 2,280 minor wave 5 would reach 1.618 the length of minor wave 1. Minor wave 5 has passed equality in length with minor wave 1, so this is the next Fibonacci ratio in the sequence.
At 2,282 minute wave v would reach 0.618 the length of minute wave iii. This gives a two point target zone calculated at two degrees.
Expect price to keep rising while it remains within the pink channel. When the channel is breached, then intermediate wave (4) may have begun.
Within minor wave 5, the final wave up of intermediate wave (3), the downwards movement for Monday’s session may have been minute wave iv, which may not move into minute wave i price territory below 2,197.95.
If minute wave iii was over at Monday’s high, then it would be 3.62 points longer than 6.854 the length of minute wave i.
Ratios within minute wave iii are: minuette wave (iii) is 0.91 points short of 2.618 the length of minuette wave (i), and minuette wave (v) is just 0.65 points short of 0.618 the length of minuette wave (i).
Ratios within minuette wave (iii) are: subminuette wave iii is 3.63 points longer than 6.854 the length of subminuette wave i, and subminuette wave v is 0.61 points longer than 0.236 the length of subminuette wave iii.
ALTERNATE HOURLY CHART
Click chart to enlarge.
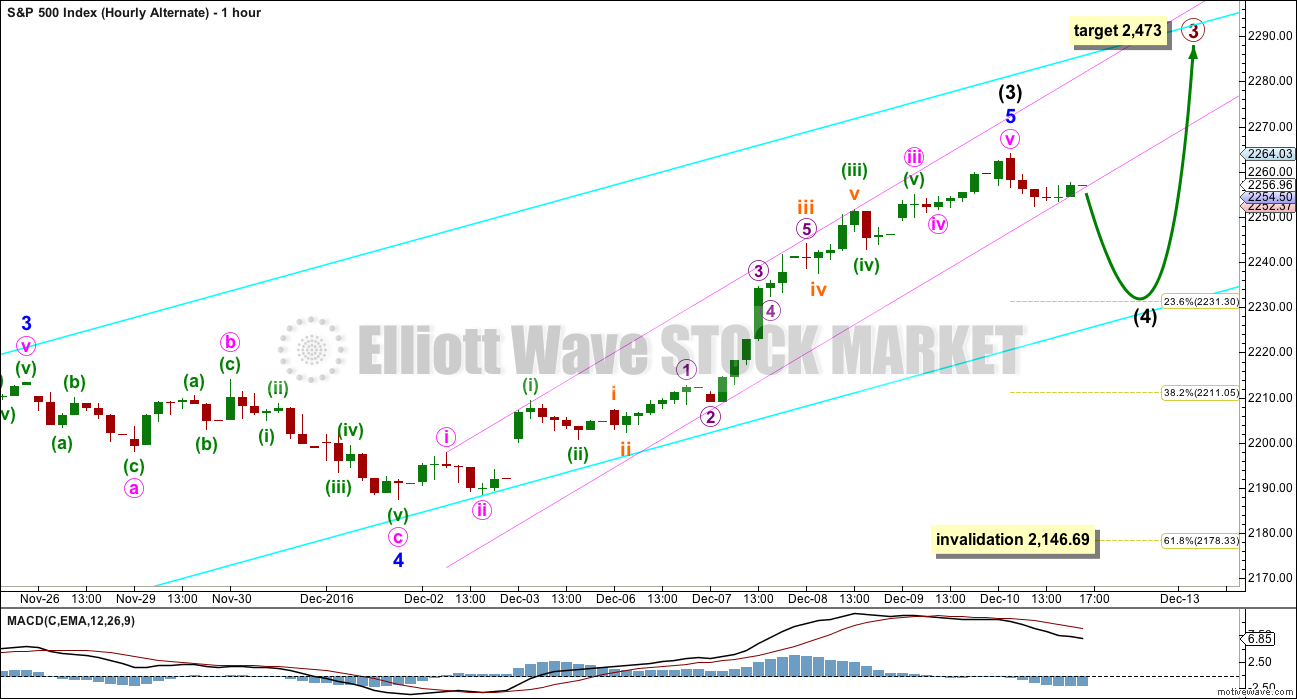
What if intermediate wave (3) is over? The small red daily candlestick for Monday’s session may be the start of intermediate wave (4).
Intermediate wave (4) may not move into intermediate wave (1) price territory below 2,146.69.
Intermediate wave (4) should be expected to be a relatively shallow flat, combination or triangle, lasting about three days. Targets for it would be the 0.236 and 0.382 Fibonacci ratios of intermediate wave (3) at 2,231 and 2,211.
Ratios within minor wave 5 are: minute wave iii is 5.34 points short of 6.854 the length of minute wave i, and minute wave v has no Fibonacci ratio to either of minute waves i or iii.
Ratios within minute wave iii are: minuette wave (iii) is 4.19 points short of 2.618 the length of minuette wave (i), and minuette wave (v) is 0.72 points short of 0.618 the length of minuette wave (i).
Ratios within minuette wave (iii) are: subminuette wave iii is 4.03 points short of 6.854 the length of subminuette wave i, and subminuette wave v has no Fibonacci ratio to either of subminuette waves i or iii.
The Fibonacci ratios within this alternate wave count are not as good as those for the main hourly Elliott wave count. This must reduce the probability of this alternate to less than the main Elliott wave count.
Assume the trend remains the same until proven otherwise. Use the main Elliott wave count until the channel is breached, then consider this alternate.
TECHNICAL ANALYSIS
WEEKLY CHART
Click chart to enlarge. Chart courtesy of StockCharts.com.
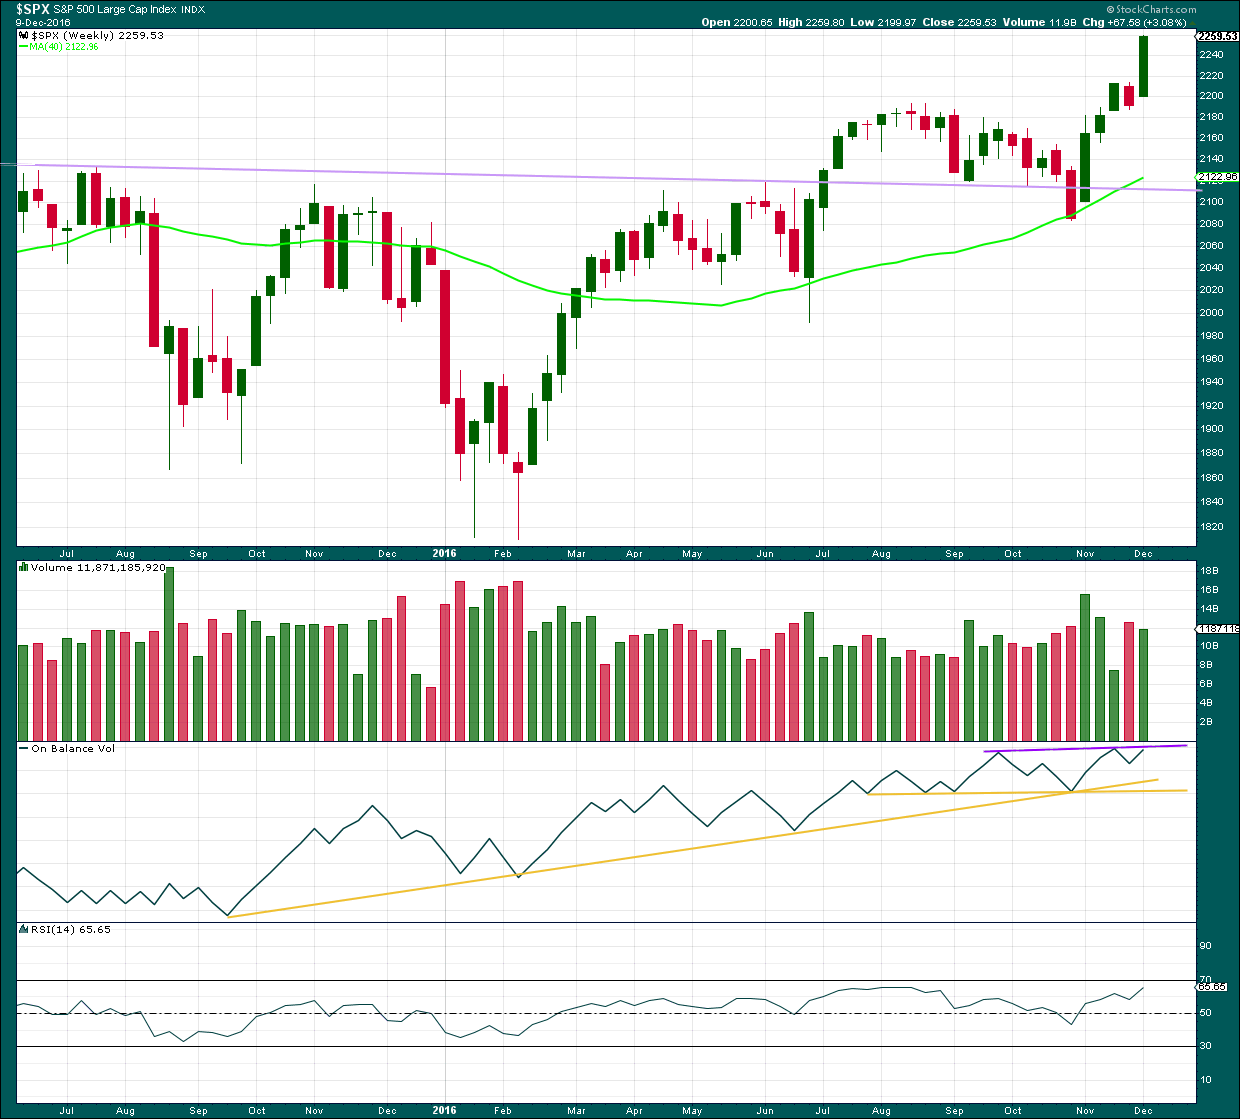
Another strong upwards week comes with a slight decline in volume, but volume is still relatively high.
On Balance Volume may find resistance at the purple line and this may force intermediate wave (4) to arrive earlier than expected. If OBV breaks above this line next week, that would be a fairly bullish signal.
RSI is not yet extreme. There is room for price to rise.
DAILY CHART
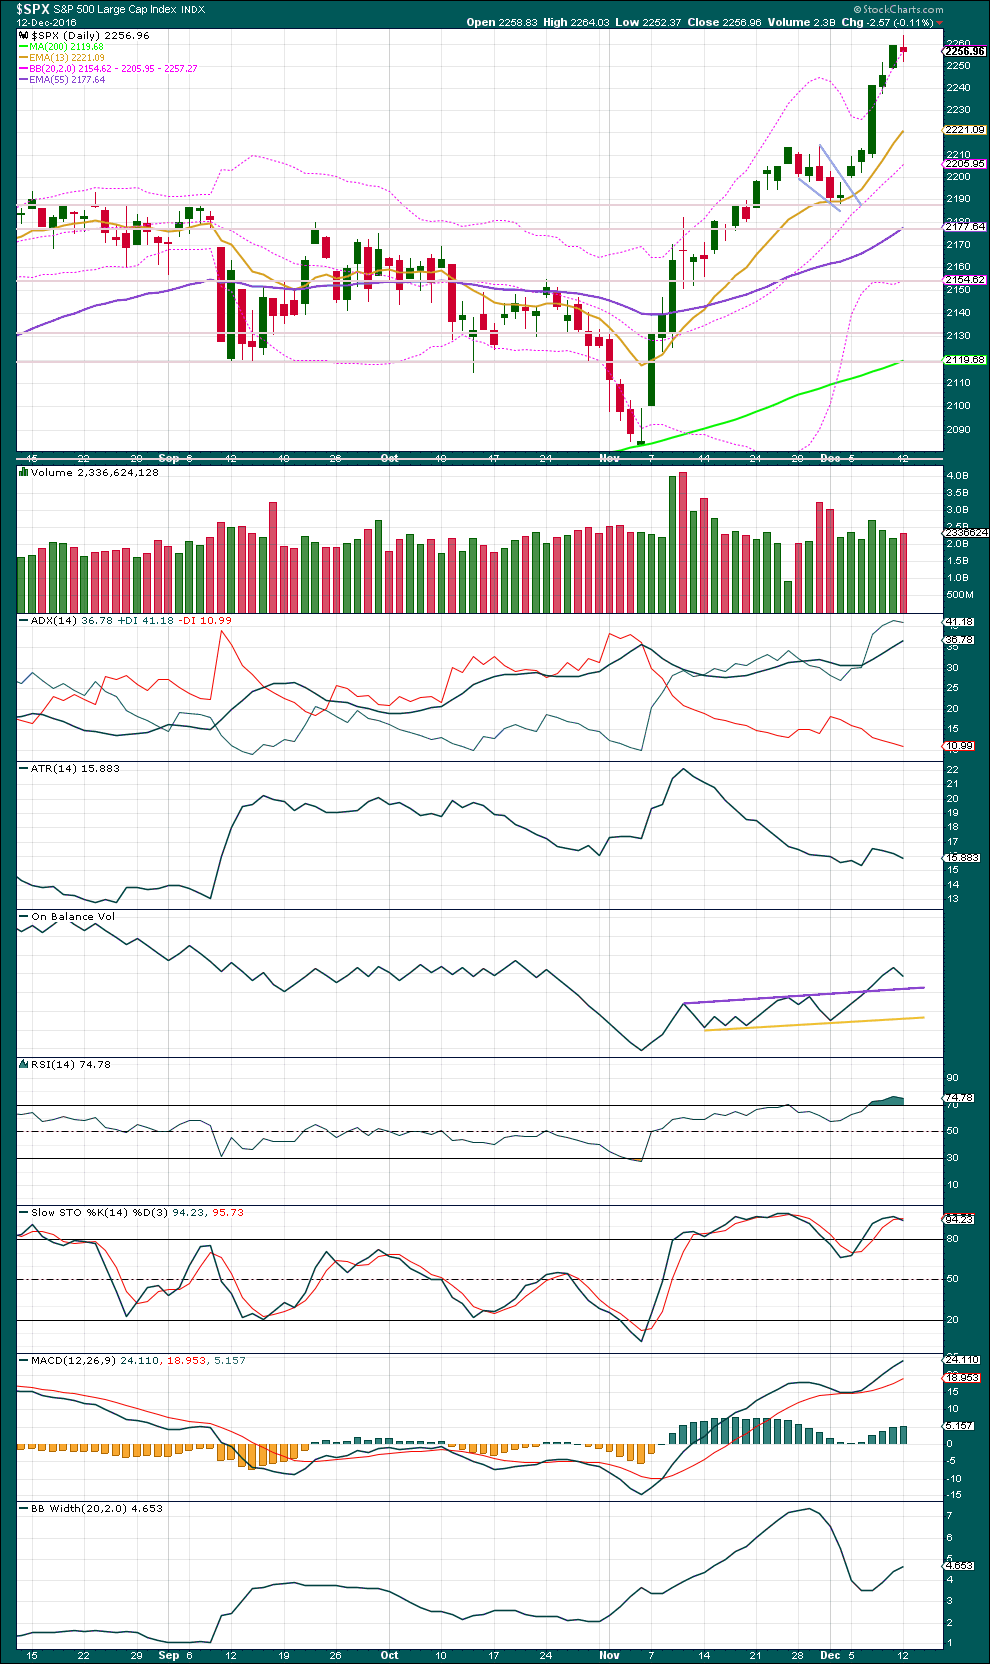
Click chart to enlarge. Chart courtesy of StockCharts.com.
The target using the measured rule from the pennant pattern is 2,318.
Four days in a row of price closing above upper Bollinger Bands indicates this upwards trend is extreme. Normally, an expectation of a reversion to the mean would see a pullback here, but it has been noted recently that this upwards trend is not behaving normally. It appears to have an overabundance of exuberance, and surprises have been to the upside.
The last two upwards sessions come with price moving higher on declining volume. This would also normally indicate a pullback, at least a short one to last a day or so. Now a red daily candlestick has slightly higher volume and On Balance Volume indicates the balance of volume for this session is down. The fall in price during the session had support from volume. Normally, this too would indicate a pullback about here and favour the alternate Elliott wave count, but this market has not been behaving exactly normally lately. Continue to expect surprises to the upside.
ADX is increasing, indicating an upwards trend. But it is now over 35 and so extreme.
Normally, during an extreme extended trend, some divergence with Stochastics and preferably RSI may be used to indicate a pullback to relieve extremes.
RSI is extreme, and today exhibits some small divergence with price. If this develops further, then it would be more convincing because this session closed red and it is not entirely convincing; the decline in RSI today may be due to strength of downwards movement within the session, and divergence here would be more convincing for a day in which the balance of volume was upwards and not downwards.
Stochastics is extreme and exhibits single small divergence with price. If Stochastics remains extreme and price continues higher, then if it exhibits multiple divergence with price, that would be a stronger indication of weakness.
MACD is bullish. Bollinger Bands are widening. The upwards trend has shown a burst of energy at the end of last week.
With indicators extreme and some small divergence, it would be reasonable to expect a pullback here or reasonably soon. The best method would still be to use trend lines to indicate a change.
VOLATILITY – INVERTED VIX CHART
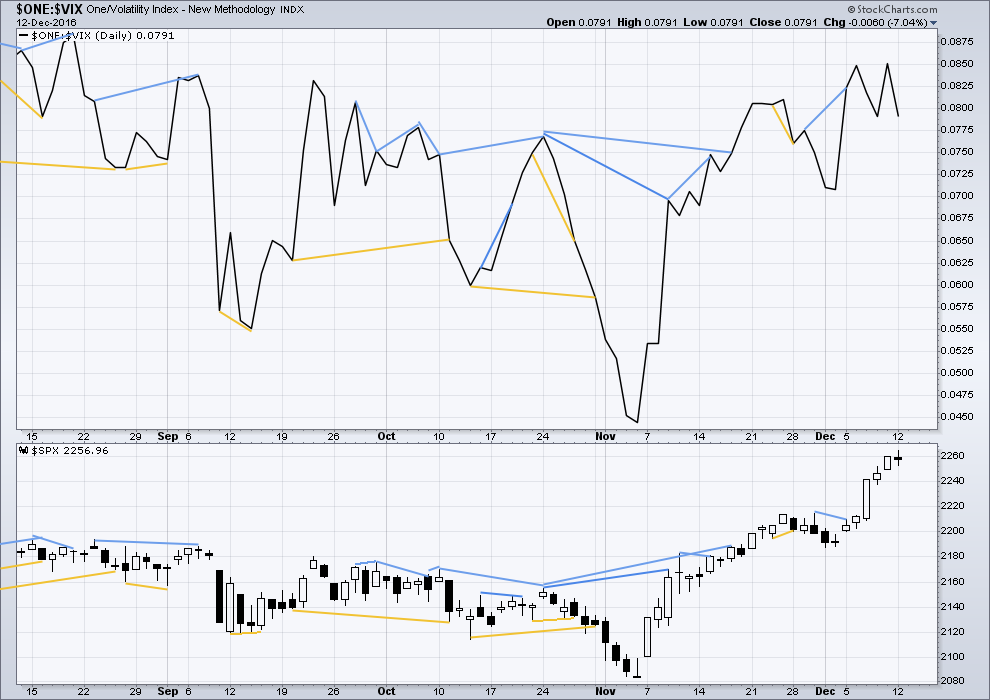
Click chart to enlarge. Chart courtesy of StockCharts.com.
There are a few instances of multi day divergence between price and inverted VIX noted here. Bearish divergence is blue. Bullish divergence is yellow. It appears so far that divergence between inverted VIX and price is again working to indicate short term movements spanning one or two days. While this seems to be working more often than not, it is not always working. As with everything in technical analysis, there is nothing that is certain. This is an exercise in probability.
No new divergence is noted.
BREADTH – AD LINE
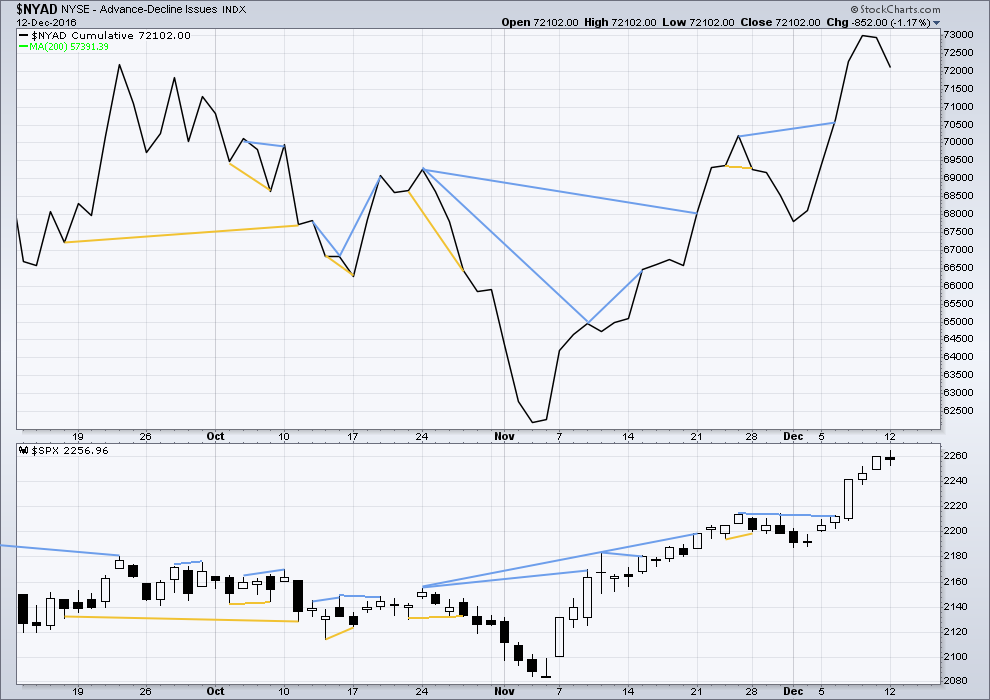
Click chart to enlarge. Chart courtesy of StockCharts.com.
Short term bullish and bearish divergence is again working between price and the AD line to show the direction for the following one or two days.
There is longer term divergence between price and the AD line, but like inverted VIX this has proven reasonably recently to be unreliable. It will be given no weight here.
Bearish divergence noted in last analysis has been followed by a red daily candlestick in which the balance of volume was downwards. However, this candlestick meets the technical definition of an upwards day with a higher high and a higher low, although it closed red. The bearish divergence may be now resolved by a red daily candlestick.
DOW THEORY
Major lows within the old bull market:
DJIA: 15,855.12 (15th October, 2014) – closed below on 25th August, 2015.
DJT: 7,700.49 (12th October, 2014) – closed below on 24th August, 2015.
S&P500: 1,821.61 (15th October, 2014) – has not closed below this point yet.
Nasdaq: 4,117.84 (15th October, 2014) – has not closed below this point yet.
Major highs within the bear market from November 2014:
DJIA: 17,977.85 (4th November, 2015) – closed above on 18th April, 2016.
DJT: 8,358.20 (20th November, 2015) – closed above this point on the 9th of November, 2016.
S&P500: 2,116.48 (3rd November, 2015) – closed above this point on 8th June, 2016.
Nasdaq: 5,176.77 (2nd December, 2015) – closed above this point on 1st August, 2016.
Dow Theory Conclusion: The transportations indicate an end to the prior bear market. The transportation index confirms a bull market.
This analysis is published @ 06:53 p.m. EST.
Again price closed four days in a row at or above upper Bollinger Bands, yet continues higher. This upwards movement is showing some good strength now.
RSI is now overbought, but shows no divergence yet.
The end is closer but no indication of it being here just yet folks. It looks like the targets may be met.
If my Elliott wave target is inadequate then use the classic TA target at 2,318.
With minute iv now probably over the invalidation point may be moved up to 2,256.13. This is great, it means now that a new low below this point would give us some confidence that a deeper pullback has arrived.
With all that mania we are seeing in the market, my volatility positions should be getting hammered. Instead, they too are exploding to the upside after being underwater for a few days. There is something historic, momentous, unprecedented, and frankly that downright scares the- you- know- what out of me going on here. Be careful out there poeple! Back tomorrow GW.
Again, VIX moving higher and price for S&P moving higher….
This is just so completely strange.
Verne, you’re the expert on VIX here. Have you ever seen this happen before to this degree?
Am I reading this as strange, when it actually isn’t?
Lara in all honesty I have NEVER seen anything like this. It is in my experience entirely unprecedented. I have to confess I have no idea what the implications are as it makes absolutely no sense for VIX (which is supposed to reflect the put/call SPX ratio) to be heading higher with this kind of market strength. It suggests that somebody with very deep pockets is establishing massively short positions in the teeth of this market strength. This of course assumes that VIX still means what it always has. One can never be sure about what is actually going on with market metrics these days but I have to assume any change in how VIX is measured would have been fully disclosed.
I took a look at the price action of primary three of cycle three up. Unless I missed something, I could not find even in the strongest portion of intermediate three up anything remotely like what we are currently seeing.
It appears short gamma has been in the works, thereby correlating VIX to equities
I’m a new user and love the detail, Lara.
I’d like to describe my understanding of your analysis to see if I have it right. Here goes…
minor 5 is the last leg within intermediate (3). when we talk about intermediate 3 ending … by either by going below the pink line or by going up to 2280+ and then reversing … we’re saying that minor 5 is ending as well.
when intermediate 3 ends, then intermediate (4) will commence, going down to a target range of 2211-to-2231 (but no lower than 2146)
at which point intermediate (5) should start, going up to a target of 2473. Intermediate (5) will be the last leg within primary 3 …. so the primary 3 shares the same target level as intermediate 5.
Do I have that right?
If so, is there any way to estimate the timeline of these moves? I see that you estimate intermediate 4 to be brief, about 3 days. What about the duration of intermediate 5?
Thanks very much.
Lance
Yes, you’ve got that right.
Price is easier (ha, yeah right) than time to try and estimate. Neither are easy.
Primary 1 lasted 134 days (no Fibonacci duration) and primary 2 lasted 52 days (three short of a Fibonacci 55). So far primary 3 has lasted 27 days, so if it ended in seven more sessions then it may total a Fibonacci 34.
Now, here’s the problem. As you can see from P1 and P2 the waves of the S&P just don’t often exhibit Fibonacci durations. So giving an estimate like this for P3 is really a rough stab in the dark with a blunt instrument. Not really helpful.
Thanks. I just up’d my 7 day trial into a 6 months-at-a-time subscription.
I look forward to the analysis of Dec 13.
Everything is absolutely amazing!
Thought I would share this great posting on Zero:
Deutsche Bank “Explains” How Stocks Will React To The Fed’s Rate Hike
http://www.zerohedge.com/sites/default/files/images/user5/imageroot/2016/11/29/db%20reactopm.jpg
DOW to 40,000
S&P 500 to 4400
Everything is Amazing! Why oh Why have I fought this the last 4 Years??? Just Amazing!
A Very Merry Christmas and a Happy New Year to all here on the Lara EW Board!
Thank you Joe, and a very merry Christmas to you too!
Once again outstanding analysis Lara – thorough, objective, precise. Your observation regarding the markets abnormal price action and the possibility of extremes continuing is I think a very important one so hopefully members are taking it seriously. Thank you!
Why thank you very much kind Sir 🙂
DITTO!
I continue to wait for any sort of pullback that we expected to materialize around 2227. Now at 2270, I am looking for a pull back to that same area, 2227 or so. If it materializes, I will be going long again looking for the next move towards 2350+.
Getting ready for a snowshoe expedition after the New Year. We have up to 7 feet of snow on the ground! And that is not counting the drifting. Awesome.
Have a great day.