
Upwards movement was expected for Tuesday, which is exactly what has happened.
Summary: The main wave count now expects upwards movement here for a fifth wave to end a third wave. The target is at 2,226 – 2,227. This bull market is ageing, but it still shows some signs of strength and is not done yet. Corrections present an opportunity to enter the trend. In the short term, a little more upwards movement to 2,215 may begin tomorrow’s session. Thereafter, a correction may unfold for one to three days and should find support at the blue channel on the hourly chart. When the small green channel, also on the hourly chart, is breached by downwards movement expect a correction has begun. Expect price to continue higher while price remains in the channel.
Last monthly chart for the main wave count is here.
Last weekly chart is here.
New updates to this analysis are in bold.
MAIN WAVE COUNT
DAILY CHART
Click chart to enlarge.
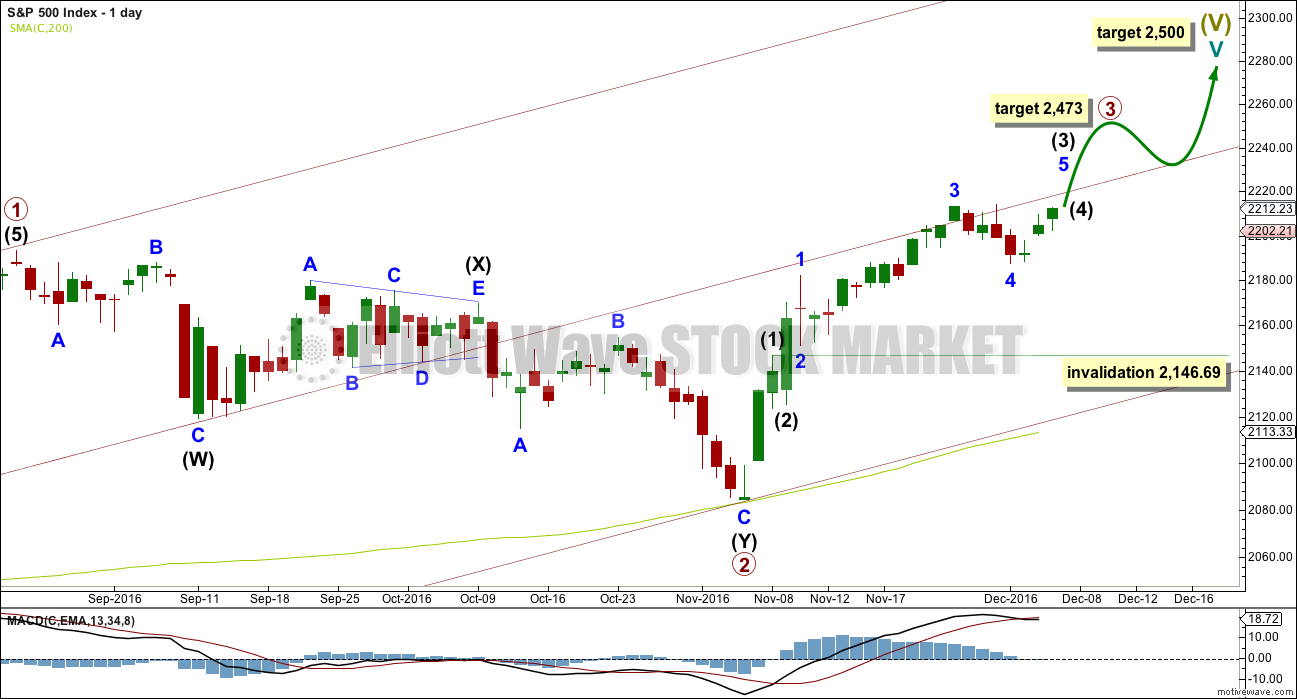
Cycle wave V must subdivide as a five wave structure. At 2,500 it would reach equality in length with cycle wave I. This is the most common Fibonacci ratio for a fifth wave for this market, so this target should have a reasonable probability.
Cycle wave V within Super Cycle wave (V) should exhibit internal weakness. At its end, it should exhibit strong multiple divergence at highs.
Within cycle wave V, primary waves 1 and 2 may be complete. Primary wave 3 may be over halfway through and is so far exhibiting weaker momentum than primary wave 1, which fits with the larger picture of expected weakness for this fifth wave at cycle degree. It is possible primary wave 3 may fall short of the target and not reach equality in length with primary wave 1.
Within primary wave 3, the upcoming correction for intermediate wave (4) should be relatively brief and shallow. Intermediate wave (1) was over very quickly within one day. Intermediate wave (4) may last a little longer, perhaps two or three days, and may not move into intermediate wave (1) price territory below 2,146.69.
At 2,473 primary wave 3 would reach equality in length with primary wave 1. This Fibonacci ratio is chosen for this target calculation because it fits with the higher target at 2,500.
When primary wave 3 is complete, then the following correction for primary wave 4 may last about one to three months and should be a very shallow correction remaining above primary wave 1 price territory.
The maroon channel is redrawn as a base channel about primary waves 1 and 2. Draw the first trend line from the start of primary wave 1 at the low of 1,810.10 on the 11th of February, 2016, then place a parallel copy on the high of primary wave 1. Add a mid line, which has shown about where price has been finding support and resistance.
HOURLY CHART
Click chart to enlarge.
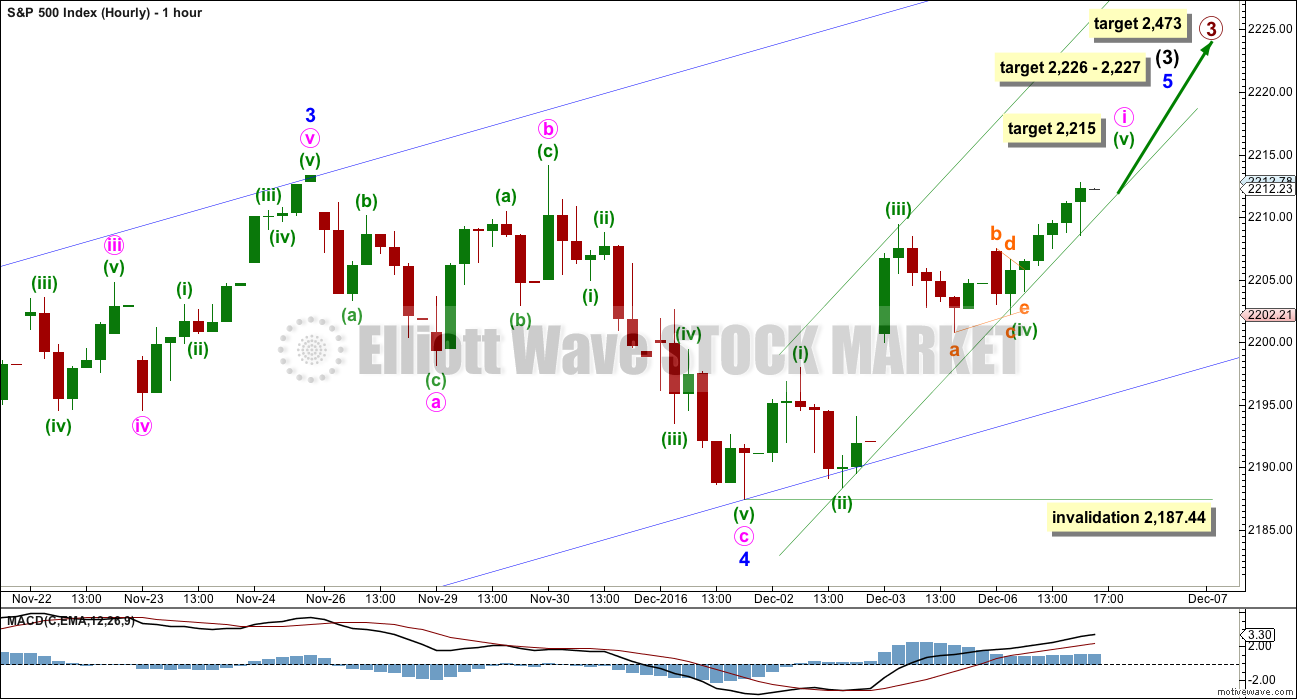
At 2,227 intermediate wave (3) would reach 1.618 the length of intermediate wave (1).
Now within intermediate wave (3), at 2,226 minor wave 5 would reach 0.618 the length of minor wave 3. This gives a 1 point target zone calculated at two degrees.
This wave count sees the middle of a third wave particularly weak; this is not common. The larger context of a fifth wave at cycle and Super Cycle degrees may see persistent unusual weakness though, so this wave count is possible.
There is now a five up on the hourly chart adding confidence today that minor wave 4 is over and minor wave 5 is underway.
So far, within minor wave 5, minute wave i may be close to completion or it may be over already. If it is not complete, then it may end tomorrow. Expect minute wave i to continue higher while price remains within the small narrow green channel. Expect minute wave ii has begun when price breaks below the lower edge of this small channel.
There is no Fibonacci ratio between minuette waves (i) and (iii). At 2,215 minuette wave (v) would reach equality in length with minuette wave (i).
Draw a Fibonacci retracement along the length of minute wave i as soon as the green channel is breached. Expect minute wave ii to end close to the 0.618 Fibonacci ratio, especially if this coincides with the lower blue trend line.
The wider blue channel is redrawn using Elliott’s second technique. Draw the first trend line from the ends of minor waves 2 to 4, then place a parallel copy on the end of minor wave 3. If minor wave 4 is over, then along the way up within minor wave 5 corrections should find support at the lower edge of this channel.
However, the S&P does not always work well with trend channels. Sometimes the S&P breaches channels and then continues in the prior direction. A breach of the lower edge of this channel would be a warning of a possible trend change, but it would not be a strong warning.
The S&P often forms slow rounded tops. When it does this the many subdivisions make analysis difficult. Only when support is breached by movement that is clearly downwards and not sideways would it be an indication of a deeper pullback.
Minor wave 5 may end about mid way within the channel. It must subdivide as a five wave structure. It may last about one or two weeks.
ALTERNATE WAVE COUNT
DAILY CHART
Click chart to enlarge.
There is a wave count that fits for the Dow Industrials that sees an imminent trend change. It relies upon an ending diagonal, but that idea will not fit well for the S&P.
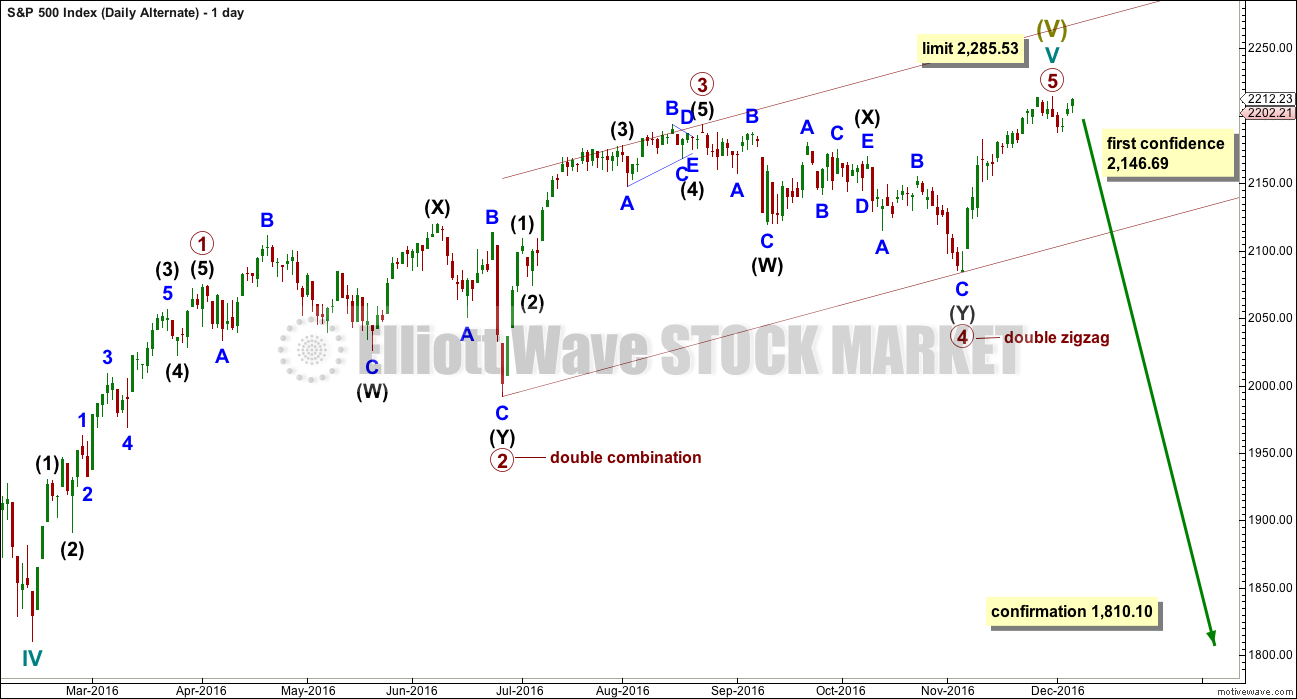
What if an impulse upwards is now complete? The large corrections labelled primary waves 2 and 4 do look like they should be labelled at the same degree as each other, so that gives this wave count the right look.
Primary wave 4 ends within primary wave 2 price territory, but it does not overlap primary wave 1. Primary wave 1 has its high at 2,057 and primary wave 4 has its low at 2,083.79. The rule is met.
There is alternation between the double combination of primary wave 2 and the double zigzag of primary wave 4. Even though both are labelled as multiples W-X-Y, these are different structures belonging to different groups of corrective structures.
Primary wave 3 is shorter than primary wave 1. This limits primary wave 5 to no longer than equality with primary wave 3 at 2,285.53.
The equivalent wave count for DJIA expects an end now to upwards movement and the start of a large bear market. Only for that reason will this alternate for the S&P also expect a reversal here.
This wave count has good proportions. Primary wave 1 lasted a Fibonacci 34 days, primary wave 2 lasted 60 days, primary wave 3 lasted 40 days, and primary wave 4 lasted 52 days. Primary wave 5 may be more brief than primary wave 3. If primary wave 5 is over now as labelled, then it may have ended in 18 sessions so with no Fibonacci duration.
If there has been a substantial multi generational trend change last week, then price should be falling with strength. The fact that it is not must reduce the probability of this wave count. This wave count remains technically viable, it is a warning of a potential fall in price, but it does not have support from classic technical analysis this week.
DOW JONES INDUSTRIALS
DAILY CHART
Click chart to enlarge.
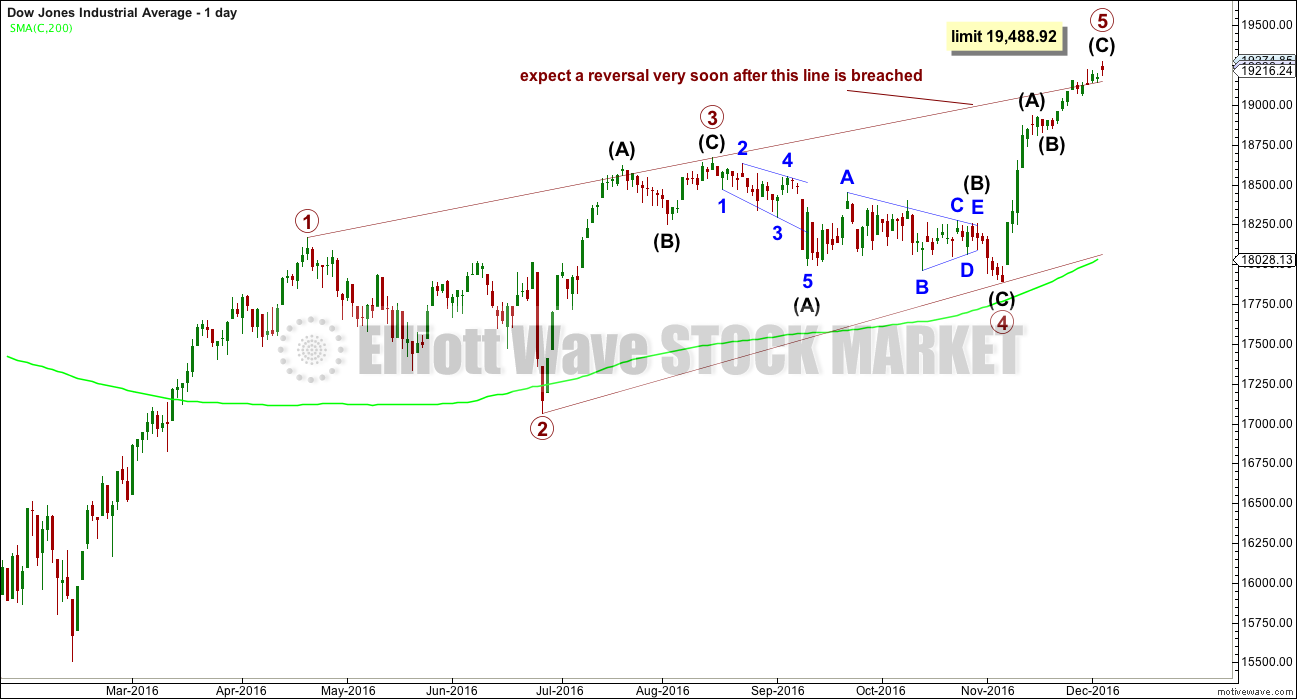
An ending contracting diagonal may be complete for the DJIA. This fits into the same picture as the alternate wave count for the S&P; both see a final fifth wave coming to an end very soon.
The 1-3 trend line is now overshot. Contracting diagonals normally end very quickly after this line is overshot, and it can be surprising how small the overshoot is. This wave count expects a very strong reversal.
The reversal is usually swift and strong when ending diagonals are complete. The DJIA has failed to fall strongly today after a stronger overshoot of the 1-3 trend line yesterday. Price is not behaving as expected for this wave count reducing its probability.
The diagonal is contracting, so the final fifth wave is limited to no longer than equality in length with primary wave 3 at 19,488.92.
TECHNICAL ANALYSIS
WEEKLY CHART
Click chart to enlarge. Chart courtesy of StockCharts.com.
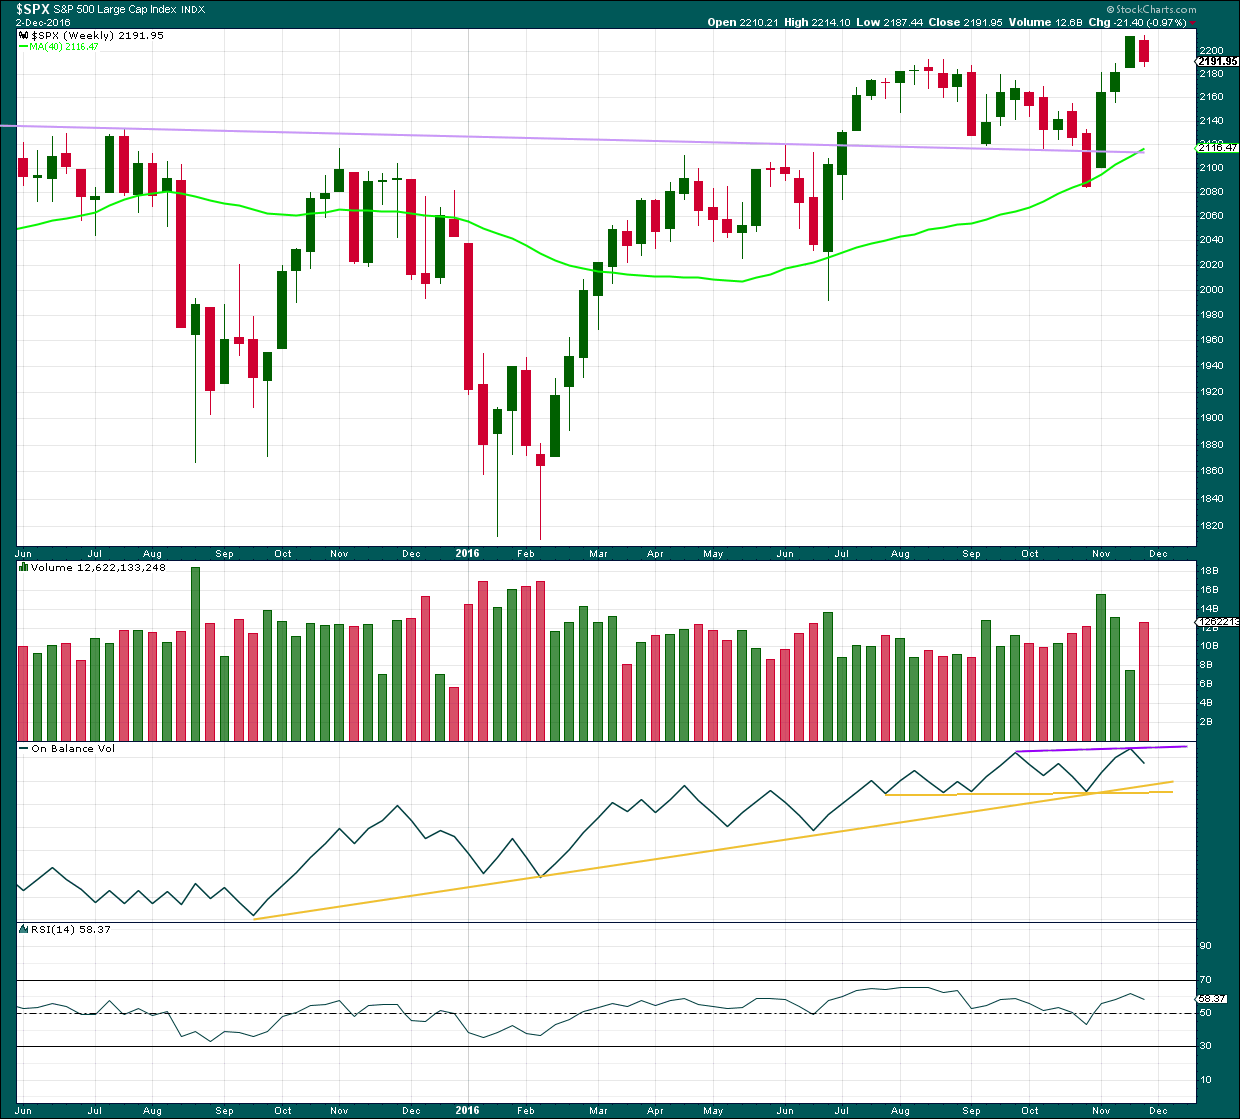
Price moved overall upwards last week with a higher high (slightly) and a higher low. But the week closed with a red candlestick.
On Balance Volume last week moved lower. With stronger volume lastweek, the balance of it was downwards. The fall in price this week was supported by volume.
If price falls further this week, then the support lines for OBV may assist to hold the fall, at least temporarily.
If OBV breaks above the purple resistance line, that would offer a weak bullish signal.
RSI is not extreme. There is room for price to rise. There is mid term divergence with price and RSI for the new high last week and the high in August. This indicates weakness, but this is expected from the Elliott wave count.
DAILY CHART
Click chart to enlarge. Chart courtesy of StockCharts.com.
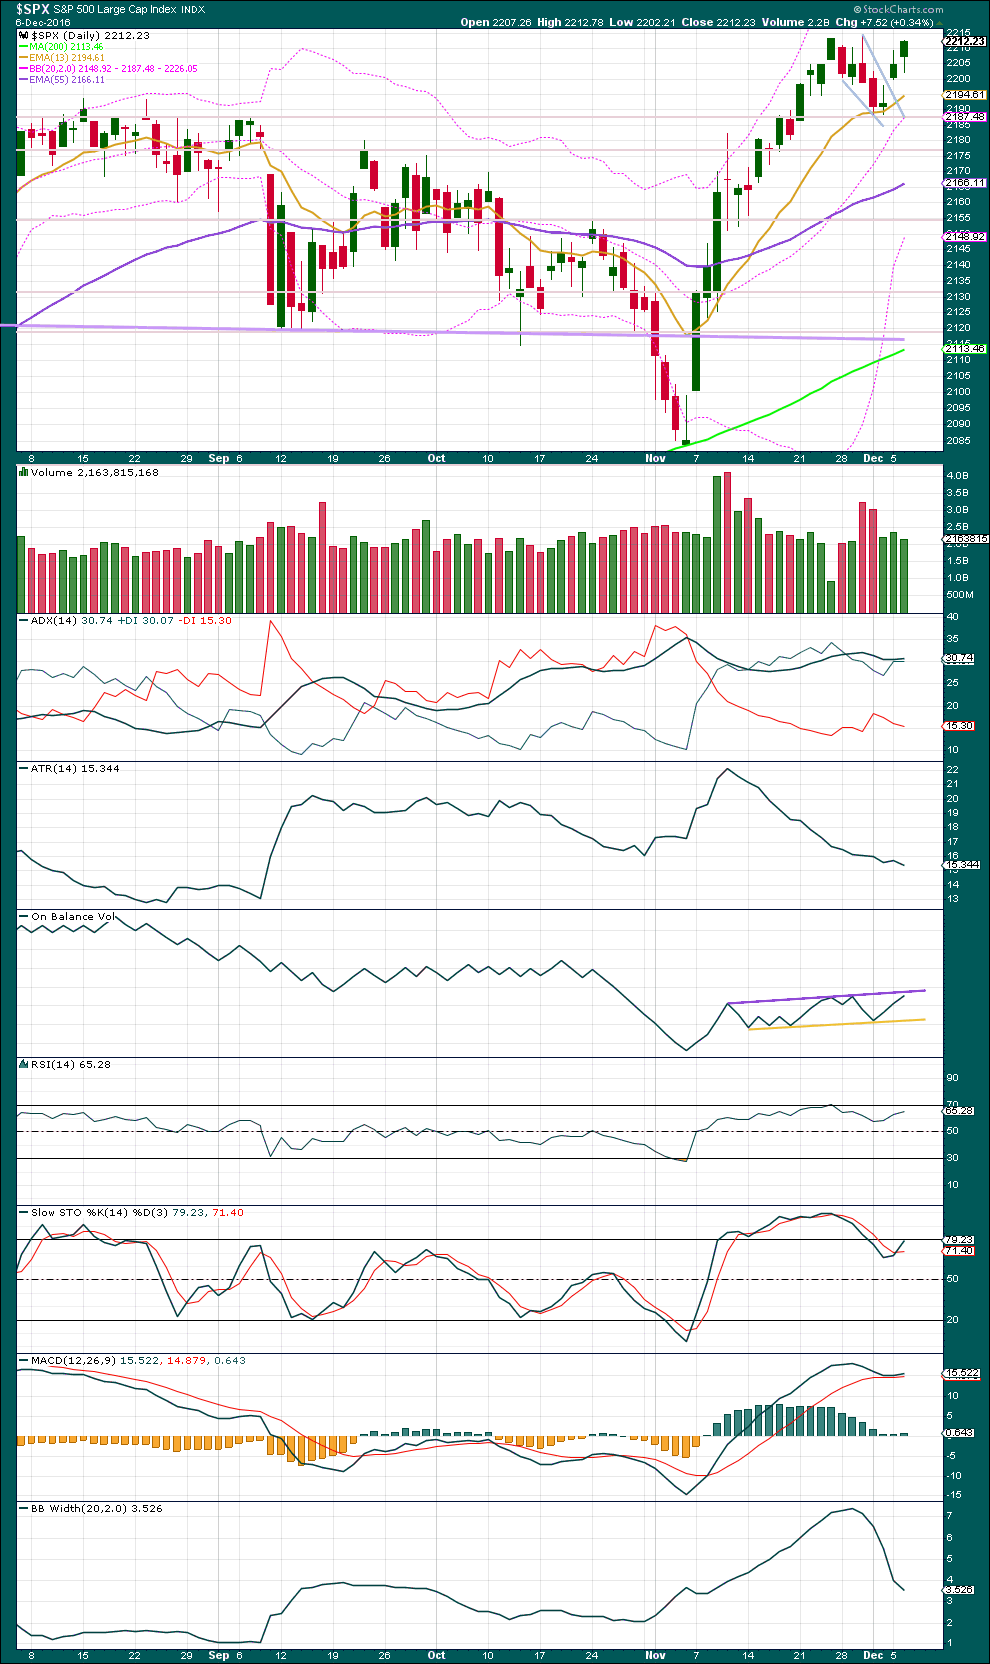
If the gap created by yesterday’s candlestick is a breakaway gap following an upwards breakout of a small pennant pattern, then the upper edge of this gap should provide support. A trailing stop may be set there for long positions.
Today’s candlestick is bullish with a reasonable sized real body and a long lower wick. This completes three green candlesticks in a row which may be interpreted as a Three White Soldiers candlestick pattern, although the body of the first candlestick is very small. This is a continuation pattern, and it supports the Elliott wave count.
Using the measured rule, a target for the next movement up would be 2,318.
On Balance Volume is still constrained. A breakout of support or resistance would offer a bearish or bullish signal. OBV today is almost at the purple resistance line, which may serve to halt the rise in price here.
The slight decline in volume for a day which produced a reasonable sized real body in the candlestick indicates bulls are a little tired. This, in conjunction with resistance here for OBV, indicates a red candlestick or doji is likely for tomorrow.
ADX increased today indicating an upwards trend. ATR remains overall declining and Bollinger Bands are contracting. There is weakness to this upwards trend.
Neither RSI nor Stochastics are extreme. There is room for price to rise again.
MACD has not offered a bearish crossover.
The short term average today increased. It remains above the mid term average which is above the long term average. All are pointing upwards, and price is above all three. Price may have just last week found support at the short term average. The probability that a bull market remains intact is greater than a deep pullback here.
VOLATILITY – INVERTED VIX CHART
Click chart to enlarge. Chart courtesy of StockCharts.com.
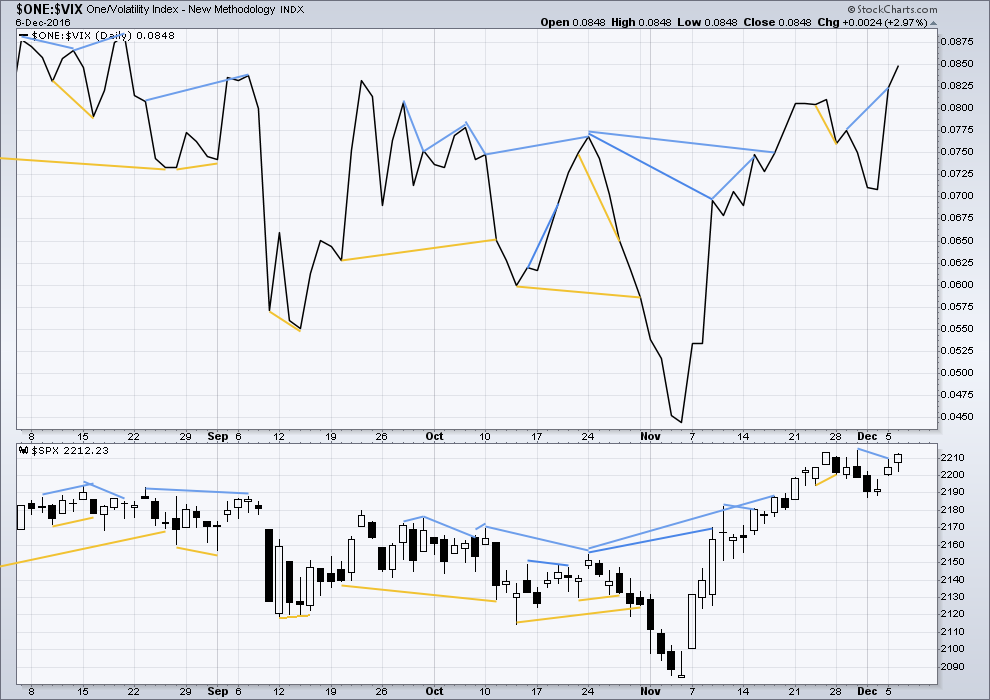
There are a few instances of multi day divergence between price and inverted VIX noted here. Bearish divergence is blue. Bullish divergence is yellow. It appears so far that divergence between inverted VIX and price is again working to indicate short term movements spanning one or two days. While this seems to be working more often than not, it is not always working. As with everything in technical analysis, there is nothing that is certain. This is an exercise in probability.
The short term bearish divergence noted in yesterdays analysis is followed by a reasonable upwards day. It is now assumed to have failed.
BREADTH – AD LINE
Click chart to enlarge. Chart courtesy of StockCharts.com.
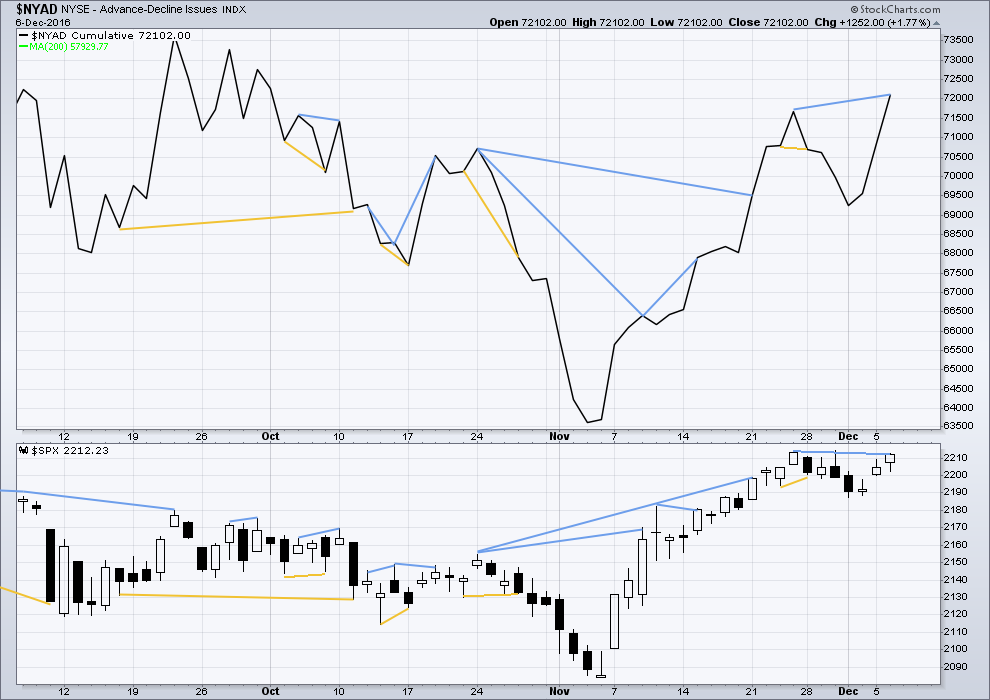
Short term bullish and bearish divergence is again working between price and the AD line to show the direction for the following one or two days.
There is longer term divergence between price and the AD line, but like inverted VIX this has proven reasonably recently to be unreliable. It will be given no weight here.
The AD line today made a new high above the prior swing high of the 25th of November, but price has not. This short / mid term divergence is bearish, but it is slight. It may be followed by one or two days of downwards movement.
If price makes a new high tomorrow, this divergence would have failed.
DOW THEORY
Major lows within the old bull market:
DJIA: 15,855.12 (15th October, 2014) – closed below on 25th August, 2015.
DJT: 7,700.49 (12th October, 2014) – closed below on 24th August, 2015.
S&P500: 1,821.61 (15th October, 2014) – has not closed below this point yet.
Nasdaq: 4,117.84 (15th October, 2014) – has not closed below this point yet.
Major highs within the bear market from November 2014:
DJIA: 17,977.85 (4th November, 2015) – closed above on 18th April, 2016.
DJT: 8,358.20 (20th November, 2015) – closed above this point on the 9th of November, 2016.
S&P500: 2,116.48 (3rd November, 2015) – closed above this point on 8th June, 2016.
Nasdaq: 5,176.77 (2nd December, 2015) – closed above this point on 1st August, 2016.
Dow Theory Conclusion: The transportations indicate an end to the prior bear market. The transportation index confirms a bull market.
This analysis is published @ 09:07 p.m. EST.
The S&P is behaving like a commodity today. This looks like a strong extended fifth wave.
Minor 5 is almost equal in length with minor 1, that would be achieved at 2,244. So if upwards movement continues a little further it may end closer to this price point.
That’s the most common ratio for a fifth wave so that should have a reasonable probability.
Intermediate (4) may be relatively quick, it may be over within one session. It may or may not turn up on the daily chart as a red candlestick or doji, more likely it will show with at least one of these.
Preferred target for intermediate (4) would be a very shallow 0.236 Fibonacci ratio, thereafter next target 0.382 Fibonacci ratio.
Price has just broken above the upper edge of the blue channel, it may now find support there. If support is breached then that line may provide some resistance.
Wow! It sure is. That was one heckuva fifth wave up. Some divergence with VIX today so it will be interesting to see how deep the fourth wave goes. We are at multi-year overbought extremes. Just when you thought the market could not get any more over-bought, it does. Another upper BB penetration in both DJI and SPX coming just about a month after initial penetrations on November 8 and 10 respectively. It will be interesting to see whether we continue to trade in the rarefied are of the upper BB. The animal spirits must be strong indeed to maintain a failure of mean reversion for this extended a period! Never seen anything quite like it. Curious the move was in no way signaled by overnight futures action. The implications of that I find most interesting.
That divergence with VIX today is completely bizarre, strange behaviour.
I’d normally read it as very bearish, but everything else from the S&P today is very bullish…..
What to do….. I must admit that I’m a bit stumped here.
McClellan Oscillator is extreme too…. but that’s not really very helpful in finding a top.
I have some words for this market today, and they’re not very polite.
More than bizarre. There are things going on this market that I have never seen before and I have no idea what to make of it all. The persistent trading of price well beyond a couple standard deviations is taking place not only in some major indices but also in a few other individual charts as well, such as the government long bond. Something quite strange about it all. Some analysts are now concluding that VIX is no longer a reliable gauge of market sentiment. I think that question is still open but why it is printing a green candle during one of the most powerful upward moves in the markets this year is indeed a mystery. BBs appear to be beginning some very intense compression
It kinda makes sense to me actually. If what we are seeing now and for the next few months is a multi generational top then things should get extreme, appear broken, and behave bizarrely.
Unfortunately when that happens for each individual case it will not be what we expected. Because IMO we will be working with the methods and techniques that we’ve developed over the years, and others have written books about, and they won’t work so well here.
Because this is a very unique situation, a multi generational process. Which, if that is true, means that no one in our generation nor the one before (these two wrote all the books) has experienced. So we have no guide for TA here.
VIX and price both printing strong green candlesticks today is the most bizarre thing I have seen yet. Pretty sure that no one would have predicted that!
Lots of program buying today by the big hedge funds coupled with a massive short squeeze. I had widened the stops on my vol positions and am down about 3%. The new ATH DJT high means the bull is alive and well according to DOW theory; the rule is not inviolable as there have been a few instances in which a bear markets began despite a nonconfimation. I expect a reasonable sized pull-back the next few days an another opportunity to join the upward trend.
DJT has finally caught up with all the other indices and made a new ATH today.
That’s very bullish.
Wow. That’s a good move up today. The target for minute i was inadequate. As was the target zone for intermediate (3).
The question now is to figure out when and where primary 3 may end.
When it arrives primary 4 should be in proportion to primary 2 for the wave count to have the right look, so it should last about a Fibonacci 55 days.
For now the target for primary 3 remains the same at 2,473
Scaled longs. Bought some SPXS and UVXY as a hedge . Now only 25% long with hedges in place such as UVXY, ES puts, and SQQQ.
I cashed in my hedges today on this monster move up. Hard to leave those kinds of gains for another day. Still very much long and strong volatility but slightly under water.
TICK… TICK… TICK
It just relentless, punting longs…..
Yep… Straight up to the moon! The Bear is permanently dead and buried! Buy and forget about it still works and will work for the rest of my life…
All the reading… All the research… All the technical analysis education… All the EW stuff… All you have to do is Buy and Hold for the long term… No?
38 Years… through all kinds of events and shocks and if you just buy and forget about it and wake up in 38 years, you are rich…
That’s the most bearish thing I’ve heard all day 🙂
DOW 40,000 soon!
S&P 4400 soon!
Spend everything you have on Christmas this year… Let the good times roll!
Alt eliminated with Lara
ED Eliminated with Prechter… Cancelling Prechter for good!
He has been really having trouble with his calls lately. In his defence, the market breadth he was watching in calling a terminal wave is understandable. What is going on the market is an extension of already extreme conditions.