
Price remains above the invalidation point on the hourly Elliott wave count.
The small downwards movement for today still fits with overall expectations.
Summary: An upwards trend is in place. Corrections are an opportunity to join the trend. A sideways correction is expected to continue for another one to two sessions. The small correction for a fourth wave should end within 2,204.80 to 2,194.51 and may not move below 2,182.30.
Last monthly chart for the main wave count is here.
Last weekly chart is here.
New updates to this analysis are in bold.
MAIN WAVE COUNT
DAILY CHART
Click chart to enlarge.
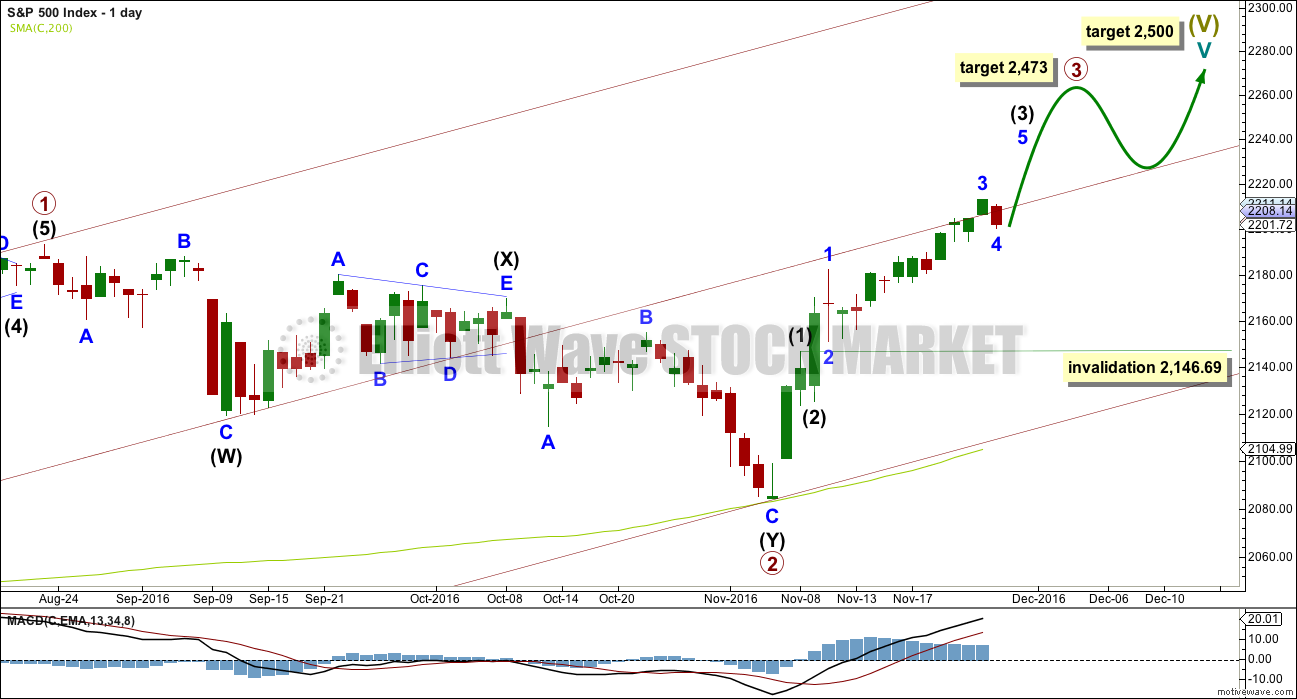
Cycle wave V must subdivide as a five wave structure. At 2,500 it would reach equality in length with cycle wave I. This is the most common Fibonacci ratio for a fifth wave for this market, so this target should have a reasonable probability.
Cycle wave V within Super Cycle wave (V) should exhibit internal weakness. At its end, it should exhibit strong multiple divergence at highs.
Within cycle wave V, primary waves 1 and 2 may be complete. The degree of labelling within primary wave 3 is moved up one degree today. Primary wave 3 may be over halfway through and is so far exhibiting weaker momentum than primary wave 1, which fits with the larger picture of expected weakness for this fifth wave at cycle degree. It is possible primary wave 3 may fall short of the target and not reach equality in length with primary wave 1.
Within primary wave 3, the upcoming correction for intermediate wave (4) should be relatively brief and shallow. Intermediate wave (1) was over very quickly within one day. Intermediate wave (4) may last a little longer, perhaps two or three days, and may not move into intermediate wave (1) price territory below 2,146.69.
At 2,473 primary wave 3 would reach equality in length with primary wave 1. This Fibonacci ratio is chosen for this target calculation because it fits with the higher target at 2,500.
When primary wave 3 is complete, then the following correction for primary wave 4 may last about one to three months and should be a very shallow correction remaining above primary wave 1 price territory.
The maroon channel is redrawn as a base channel about primary waves 1 and 2. Draw the first trend line from the start of primary wave 1 at the low of 1,810.10 on the 11th of February, 2016, then place a parallel copy on the high of primary wave 1. Add a mid line, which has shown about where price has been finding support and resistance.
HOURLY CHART
Click chart to enlarge.
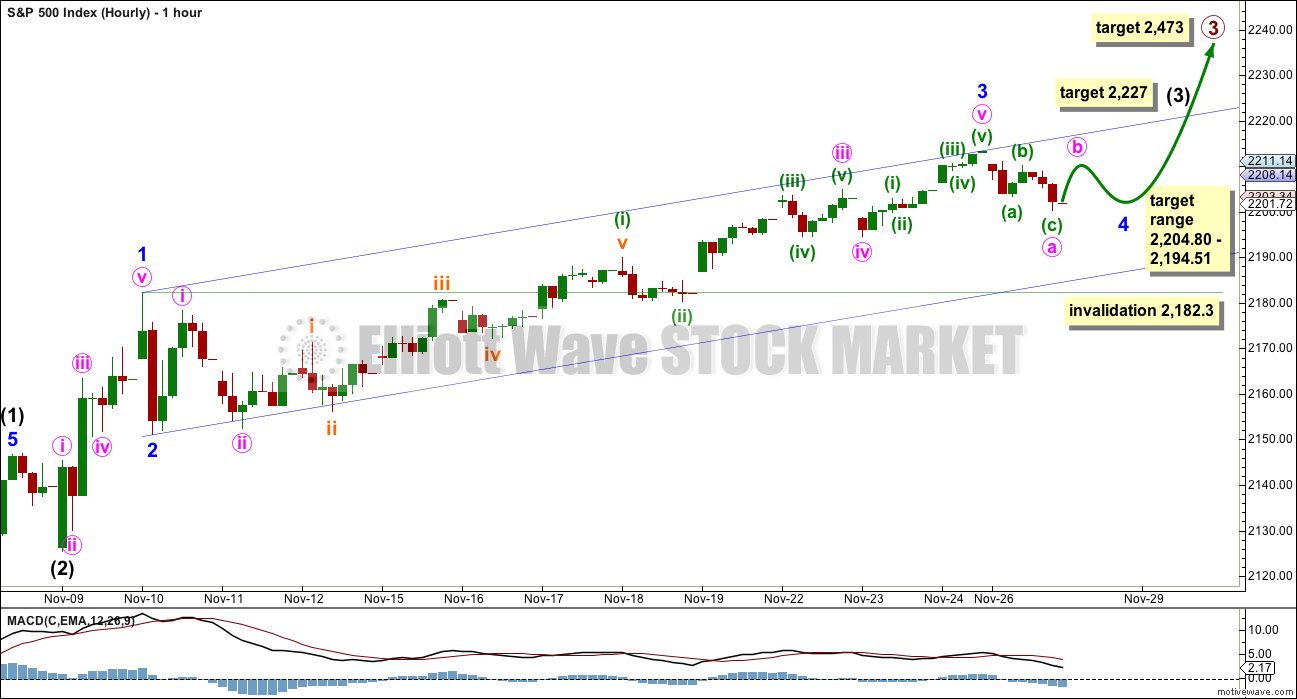
At 2,227 intermediate wave (3) would reach 1.618 the length of intermediate wave (1).
This wave count sees the middle of a third wave particularly weak; this is not common. The larger context of a fifth wave at cycle and Super Cycle degrees may see persistent unusual weakness though, so this wave count is possible.
Downwards movement for Monday’s session may be the start of minor wave 4. It is most likely that minor wave 4 will continue sideways and somewhat lower for another one to two sessions as a flat, combination or triangle. This would provide alternation with the zigzag of minor wave 2.
Minor wave 4 may not move into minor wave 1 price territory below 2,182.30.
The channel is redrawn now using Elliott’s technique. Draw the first trend line from the ends of minor waves 1 to 3, then place a parallel copy on the end of minor wave 2. The lower edge of this channel may provide support if minor wave 4 moves lower.
It is likely that minor wave 4 will end within the price territory of the fourth wave of one lesser degree. Minute wave iv has its range from 2,204.80 to 2,194.51. Minor wave 4 is now within this territory, so if it continues the expectation would be for it to continue sideways and not substantially lower.
The S&P often forms slow rounded tops. When it does this the many subdivisions make analysis difficult. Only when support is breached by movement that is clearly downwards and not sideways would it be an indication of a deeper pullback.
ALTERNATE WAVE COUNT
DAILY CHART
Click chart to enlarge.
There is a wave count that fits for the Dow Industrials that sees an imminent trend change. It relies upon an ending diagonal, but that idea will not fit well for the S&P.
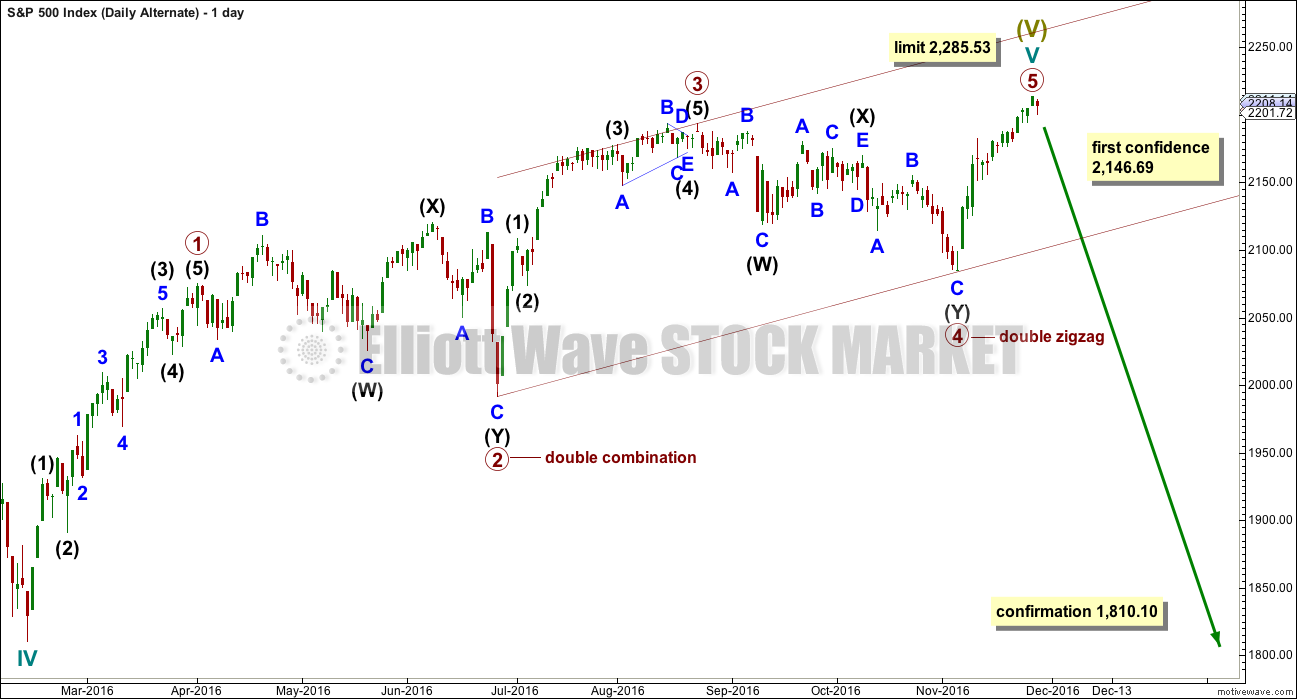
What if an impulse upwards is now complete? The large corrections labelled primary waves 2 and 4 do look like they should be labelled at the same degree as each other, so that gives this wave count the right look.
Primary wave 4 ends within primary wave 2 price territory, but it does not overlap primary wave 1. Primary wave 1 has its high at 2,057 and primary wave 4 has its low at 2,083.79. The rule is met.
There is alternation between the double combination of primary wave 2 and the double zigzag of primary wave 4. Even though both are labelled as multiples W-X-Y, these are different structures belonging to different groups of corrective structures.
Primary wave 3 is shorter than primary wave 1. This limits primary wave 5 to no longer than equality with primary wave 3 at 2,285.53.
The equivalent wave count for DJIA expects an end now to upwards movement and the start of a large bear market. Only for that reason will this alternate for the S&P also expect a reversal here.
This wave count has good proportions. Primary wave 1 lasted a Fibonacci 34 days, primary wave 2 lasted 60 days, primary wave 3 lasted 40 days, and primary wave 4 lasted 52 days. Primary wave 5 may be more brief than primary wave 3. If it exhibits a Fibonacci duration, it may total a Fibonacci 34 days and that would see it end on the 22nd of December. If it is only a Fibonacci 21 days in duration, it may end more quickly on the 2nd of December.
DOW JONES INDUSTRIALS
DAILY CHART
Click chart to enlarge.
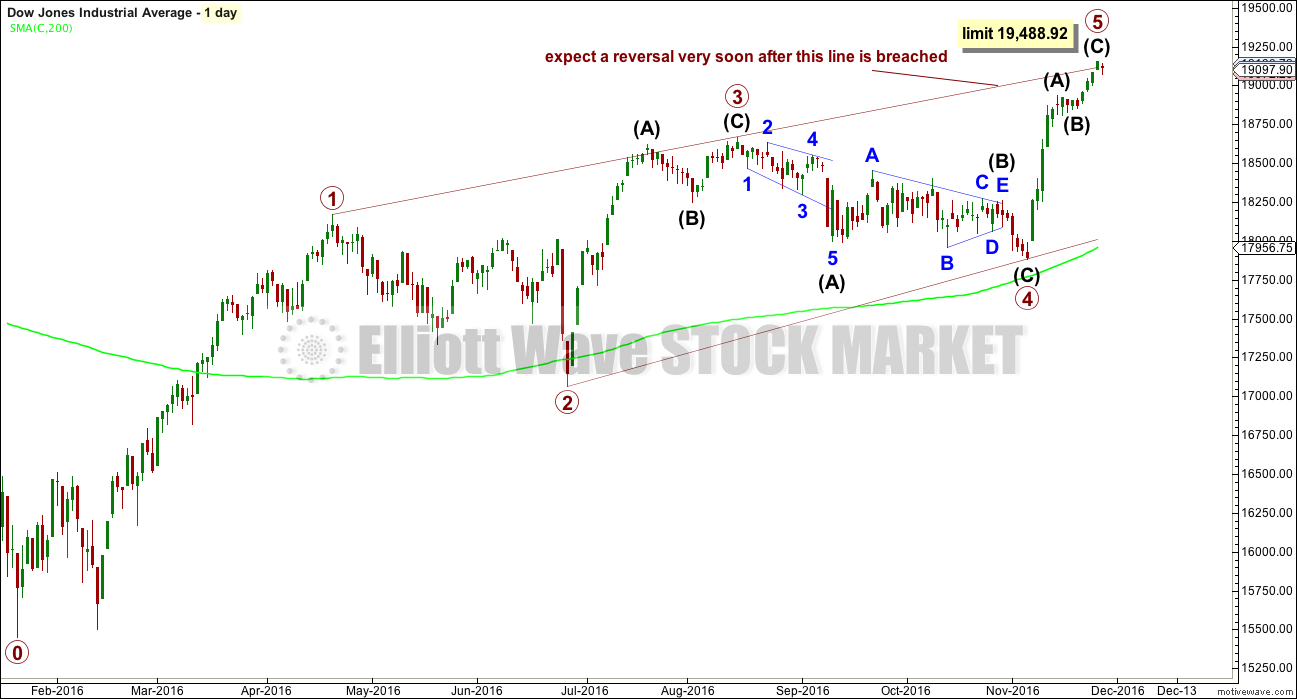
An ending contracting diagonal may be complete for the DJIA. This fits into the same picture as the alternate wave count for the S&P; both see a final fifth wave coming to an end very soon.
The 1-3 trend line is now overshot. Contracting diagonals normally end very quickly after this line is overshot, and it can be surprising how small the overshoot is. This wave count expects a very strong reversal.
The small red doji for this session is completely unconvincing as a sharp reversal. Diagonals are normally followed immediately by a sharp reversal, but this is not what is happening. Price behaviour today strongly suggests this wave count is wrong.
The diagonal is contracting, so the final fifth wave is limited to no longer than equality in length with primary wave 3 at 19,488.92.
TECHNICAL ANALYSIS
WEEKLY CHART
Click chart to enlarge. Chart courtesy of StockCharts.com.
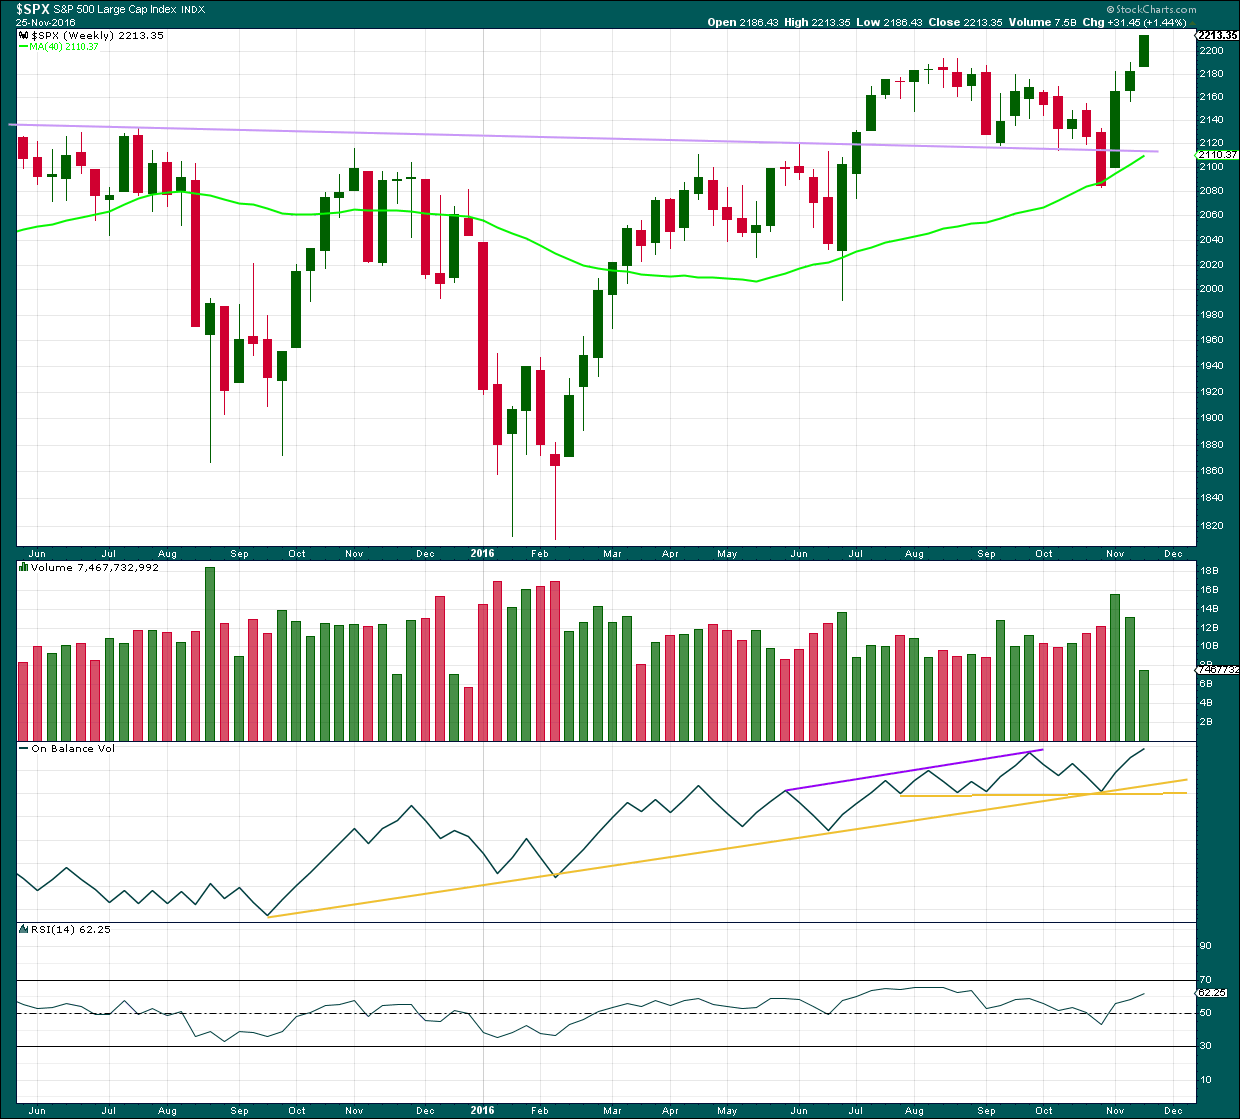
Another upwards week comes with an increase in range but a strong decline in volume. This is partly due to the Thanksgiving Day holiday making this week short of one day, so not too much will be read into it.
On Balance Volume is bullish.
There is some mid term divergence between price and RSI: price is making new all time highs, but RSI is not following. This indicates weakness in price. It is not a signal of a trend change, only indication of weakness.
DAILY CHART
Click chart to enlarge. Chart courtesy of StockCharts.com.
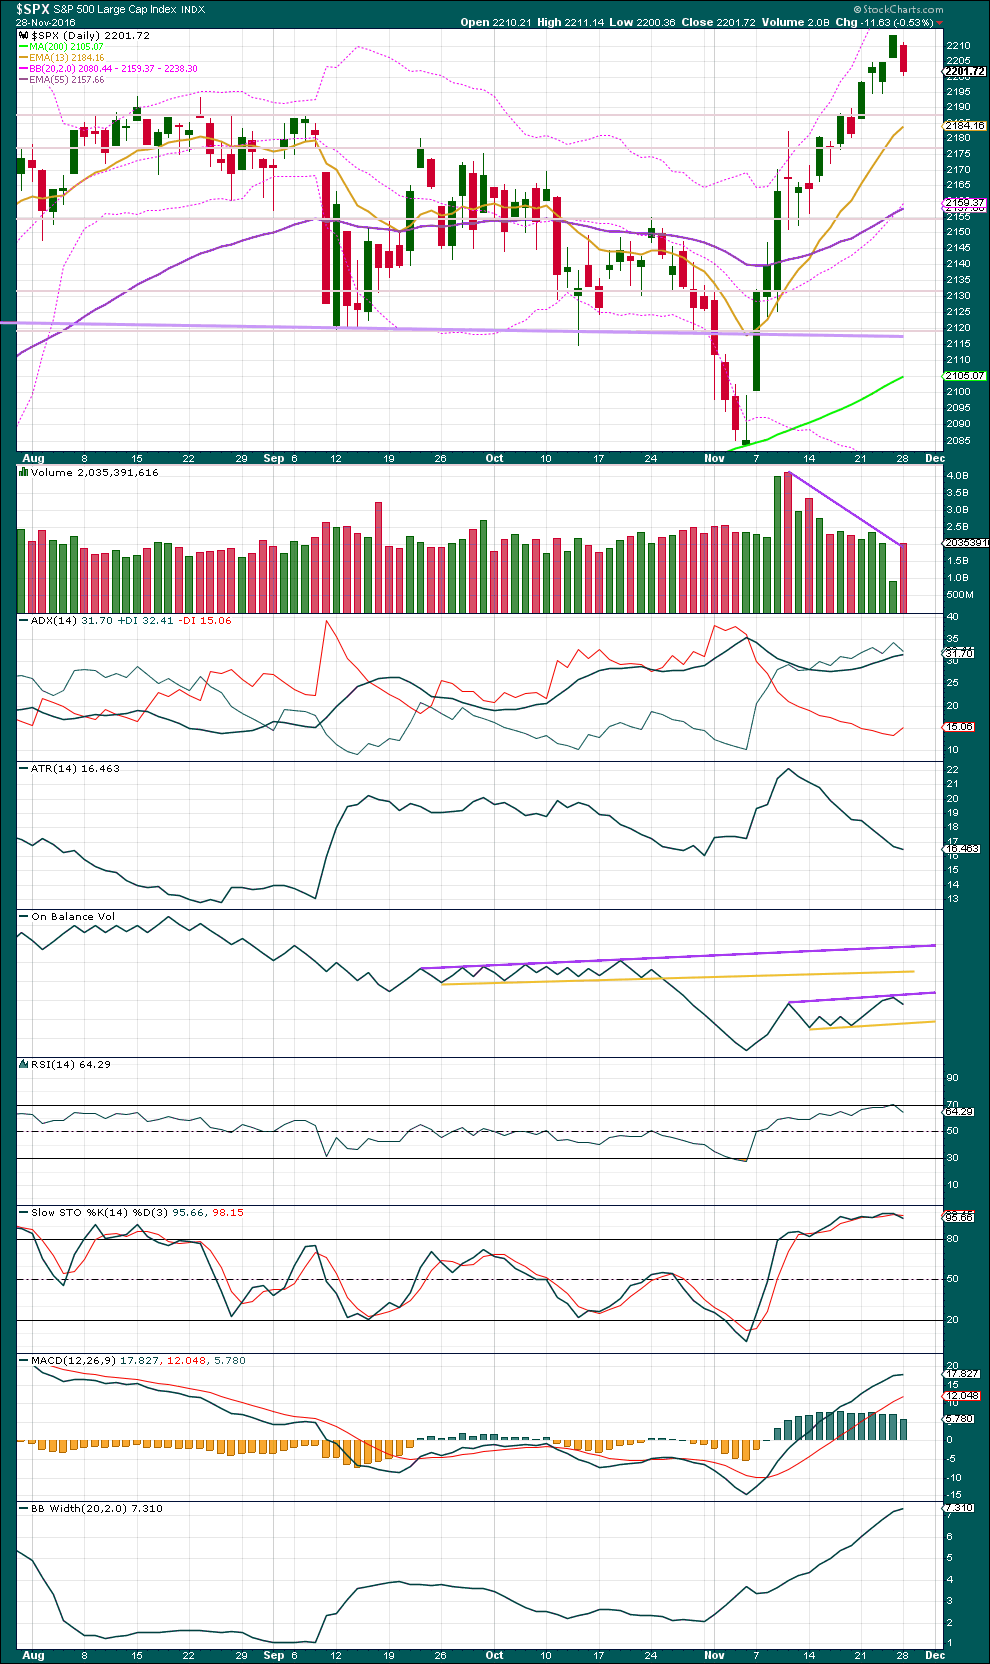
A strong increase in volume for Monday’s session suggests that bears have enough energy to push price lower for at least one more session.
Overall, volume is still declining.
Monday’s session essentially completes a bearish engulfing candlestick pattern. The important part of a bearish engulfing pattern is that the close of the second candlestick is below the open of the first candlestick. In this case, the open of the second candlestick is below the close of the first candlestick; bears were in charge before the session began and the session has gapped lower. This may be read as more bearish than if price had opened higher.
Engulfing candlestick patterns are the strongest reversal patterns, and this one is particularly strong. This in conjunction with a red daily candlestick indicates it is highly likely price will move lower for another one to few sessions.
Reversal patterns make no comment on how far the next movement may travel, nor even on direction. Price here may reverse from up to down, or equally likely from up to sideways.
ADX still indicates an upwards trend is in place, and Bollinger Bands agree. ATR disagrees though because this upwards trend comes with declining range. This is not normal or healthy for a sustained trend, but this is what the Elliott wave count expects to see though.
RSI and Stochastics have reached overbought, so some consolidation would be a reasonable expectation here before the trend continues.
MACD is still bullish. This upwards trend has support from momentum.
VOLATILITY – INVERTED VIX CHART
Click chart to enlarge. Chart courtesy of StockCharts.com.
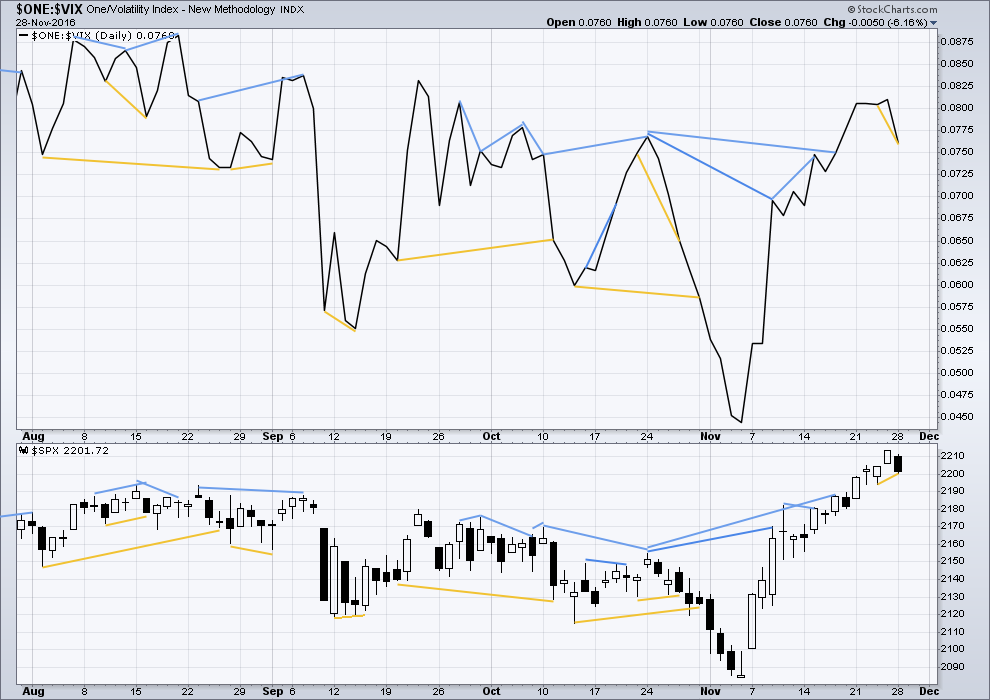
There are a few instances of multi day divergence between price and inverted VIX noted here. Bearish divergence is blue. Bullish divergence is yellow. It appears so far that divergence between inverted VIX and price is again working to indicate short term movements spanning one or two days. While this seems to be working more often than not, it is not always working. As with everything in technical analysis, there is nothing that is certain. This is an exercise in probability.
Some short term divergence is noted today between price and inverted VIX: price has made a higher low from the low two sessions ago, but inverted VIX has made a lower low. This hidden bullish divergence indicates weakness in price. It may be followed by one or two days of upwards movement.
BREADTH – AD LINE
Click chart to enlarge. Chart courtesy of StockCharts.com.
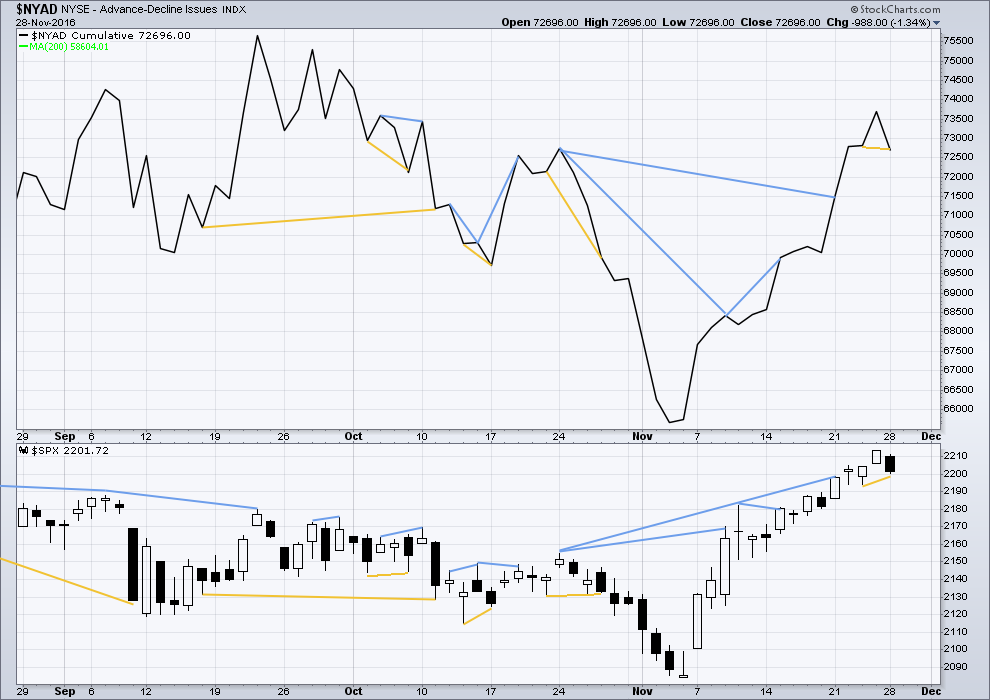
Short term bullish and bearish divergence is again working between price and the AD line to show the direction for the following one or two days.
There is longer term divergence between price and the AD line, but like inverted VIX this has proven reasonably recently to be unreliable. It will be given no weight here.
Some short term divergence is noted today between price and the AD line: price has made a higher low from the low two sessions ago, but the AD line has made a lower low. This hidden bullish divergence suggests there is weakness to this downwards movement from price. Breadth declined to a lower point, but this was not enough to bring price down to a corresponding point.
BREADTH – MCCLELLAN OSCILLATOR
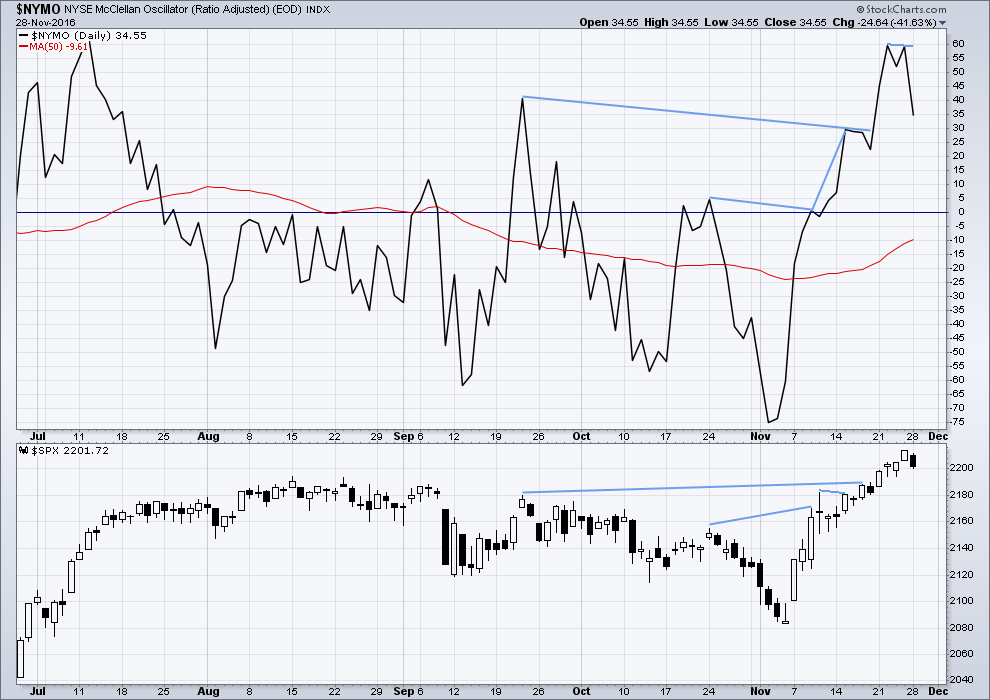
Click chart to enlarge. Chart courtesy of StockCharts.com.
On the 21st August, 2015, the McClellan Oscillator reached -71.56. Price found a low the next session, 104 points below the closing price of the 21st August. This very extreme reading for the 24th August would have been a strong indicator of a low in place.
On the 11th December, 2015, the McClellan Oscillator reached -80.82. It moved lower the next session to -92.65 and price moved 19 points lower. The extreme reading of 11th December might possibly have led to an expectation of a bigger bounce than the one that occurred, and might have misled analysis into missing the strong fall from 29th December to 20th of January.
The next most recent occasion where this oscillator was extreme was the 8th January, 2016. It reached -66.25 on that date. The low was not found for seven sessions though, on the 20th January 2016, almost 110 points below the closing price of the 8th January. At the low of the 11th February, there was strong bullish divergence with price making new lows and the oscillator making substantially higher lows. This may have been a strong warning of a major low in place.
The most recent occasion of an extreme reading was -75.05 on the 2nd of November. The last low came two days later.
As an indicator of a low this is not it. It is a warning of extreme levels. The next thing to look for would be some divergence with price and this oscillator at lows. Divergence is not always seen at lows, but when it is seen it should be taken seriously. Any reading over 100 should also be taken very seriously.
This indicator will be approached with caution. It is one more piece of evidence to take into account.
The McClellan Oscillator has just reached extreme at 60 and now exhibits divergence with price at Friday’s high. This does not mean price must turn here. The last time on this chart this oscillator reached 60 was on the 12th of July and price continued higher to the 15th of August before a reasonable correction began. It looks like this does not work well to indicate or warn of highs.
DOW THEORY
Major lows within the old bull market:
DJIA: 15,855.12 (15th October, 2014) – closed below on 25th August, 2015.
DJT: 7,700.49 (12th October, 2014) – closed below on 24th August, 2015.
S&P500: 1,821.61 (15th October, 2014) – has not closed below this point yet.
Nasdaq: 4,117.84 (15th October, 2014) – has not closed below this point yet.
Major highs within the bear market from November 2014:
DJIA: 17,977.85 (4th November, 2015) – closed above on 18th April, 2016.
DJT: 8,358.20 (20th November, 2015) – closed above this point on the 9th of November, 2016.
S&P500: 2,116.48 (3rd November, 2015) – closed above this point on 8th June, 2016.
Nasdaq: 5,176.77 (2nd December, 2015) – closed above this point on 1st August, 2016.
Dow Theory Conclusion: The transportations indicate an end to the prior bear market. The transportation index confirms a bull market.
This analysis is published @ 08:45 p.m. EST.
I think Jeff Clark is a pretty sharp trader and generally agree with his view on the markets. He is at the moment suggesting that applying a really good idea, buying a fund that is trading below its NAV (net asset value) might be a good trade now for IIM, Invesco Value Municipal Income Trust. It is trading around 9% below its asset value at the moment. Here’s my problem with this idea and it is a huge one – in a rising interest rate environment, funds like these are going to trade for a lot more than a 9% discount. Many of the bonds behind these funds are going to default. You don’t want to own assets like these regardless of how cheap they appear – not now. They are probably going to get a lot cheaper…!
Vern — you are right. Interest rates longer term are going higher. Bonds may have rallies now and then but most of those rallies should be shorted.
I totally agree with you, TLT looks to have started a wave 4 up, with a 5 down still to come.
New 52 week low in UVXY. Keep and eye on VIX. A green print today could signal an interim top.
Sharp sell off from 2:45PM ET to this point. What to make of it???
Other than my long vols, I am ignoring these intra-day swings until we get a simultaneously break in some round numbers.
The interest rate function on the Bloomberg terminal is showing a 100% chance of a rate hike by the FED in December. You heard me…100%! In fact so are lots of other quant indicators used by investors to gauge rate direction.
I have spoken ad nauseam about the impractibility of the FED voluntarily raising rates because of the dire implications it has for the ability of governments to service their debts. I have also said they will only raise rates when the market drags them kicking and screaming in that direction. As many of you have noticed, the dragging has already begun! We cannot however, forget the kicking and screaming. I am betting that they will continue sit on their hands and claim the strong dollar has already done the tightening that a rate hike would have. I think think that is going to be the catalyst that blows up the market has the masses finally realise the depth of the dodo we are are in. If the FED does nothing, that will signal the end of the current pause in the march higher of interest rates and as counter-intuitive as it seems, rates will spike higher after an initial knee-jerk reaction.